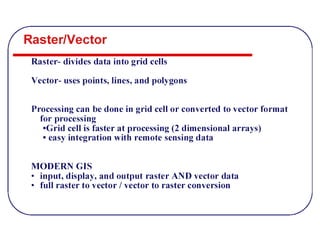
Vector (discrete)
and
Raster (continuous)Models
GIS works with three fundamentally
different types of geographic data models:
Vector (discrete), Raster (continuous) and
TIN
3.
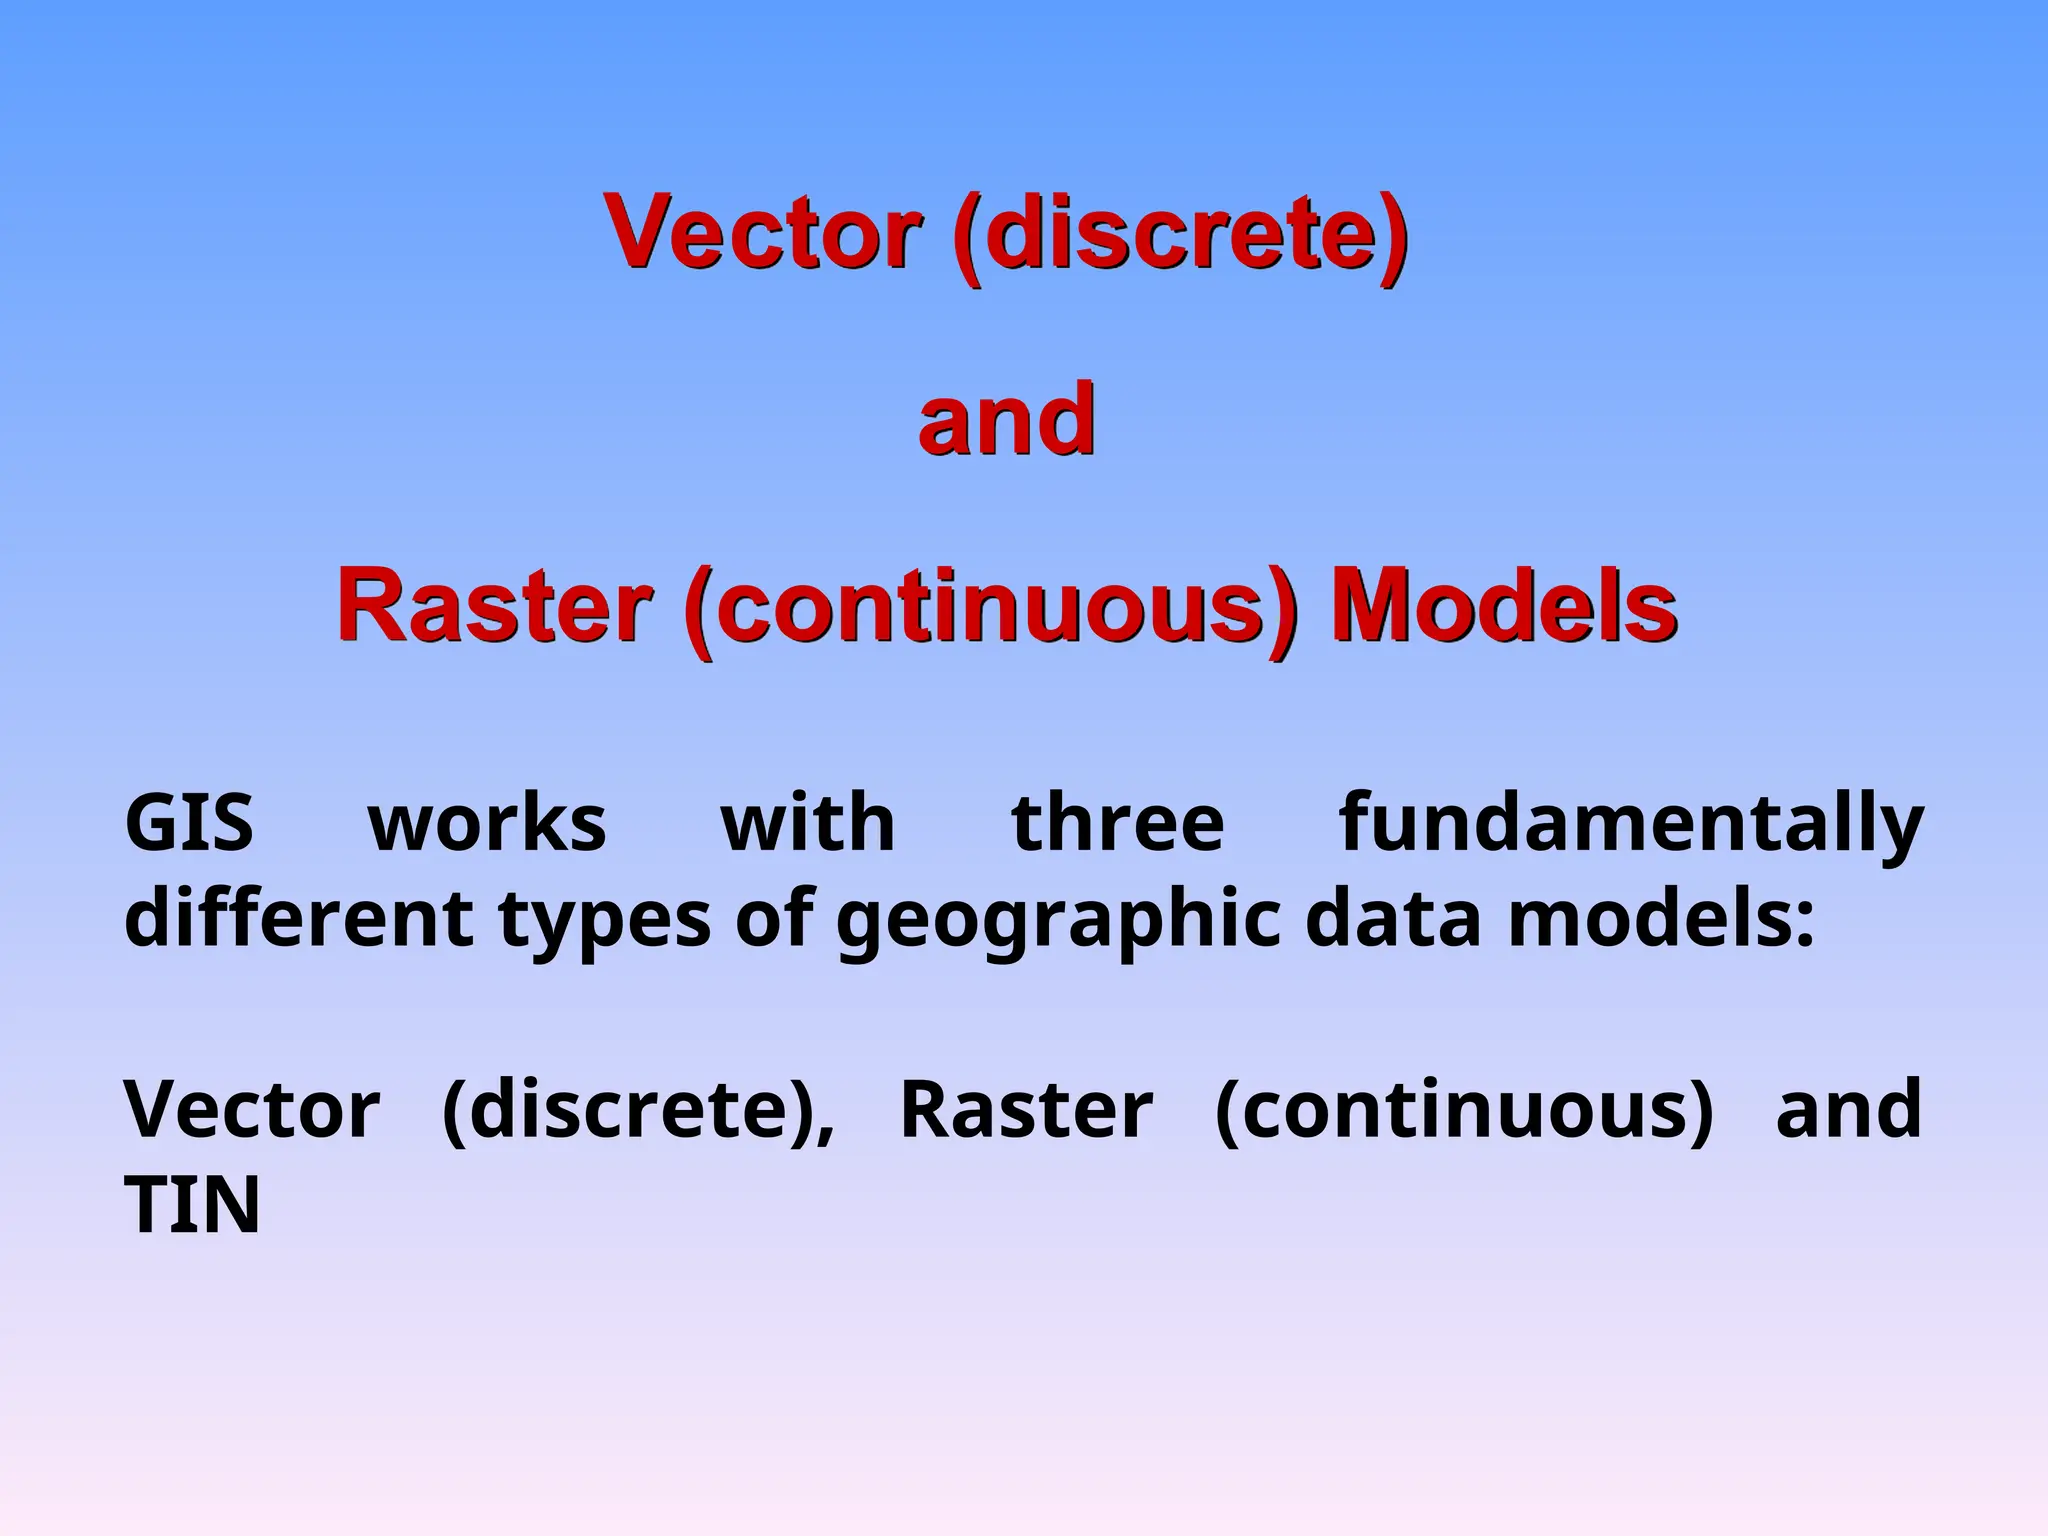
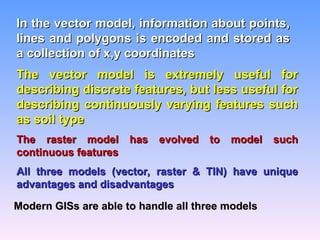
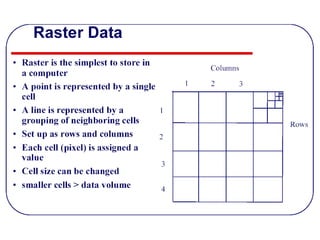
In the vectormodel, information about points,
In the vector model, information about points,
lines and polygons is encoded and stored as
lines and polygons is encoded and stored as
a collection of x,y coordinates
a collection of x,y coordinates
The vector model is extremely useful for
The vector model is extremely useful for
describing discrete features, but less useful for
describing discrete features, but less useful for
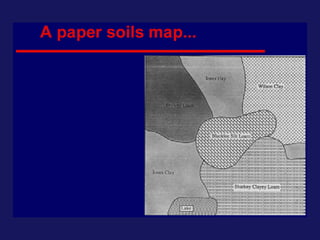
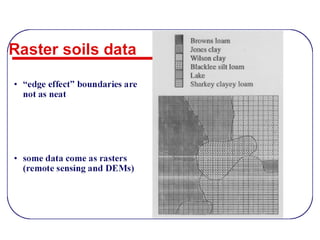
describing continuously varying features such
describing continuously varying features such
as soil type
as soil type
The raster model has evolved to model such
The raster model has evolved to model such
continuous features
continuous features
All three models (vector, raster & TIN) have unique
All three models (vector, raster & TIN) have unique
advantages and disadvantages
advantages and disadvantages
Modern GISs are able to handle all three models
Modern GISs are able to handle all three models
8.
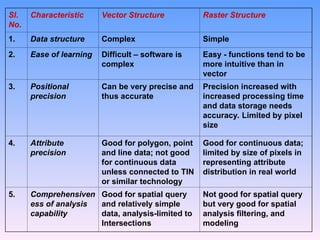
Sl.
No.
Characteristic Vector StructureRaster Structure
1. Data structure Complex Simple
2. Ease of learning Difficult – software is
complex
Easy - functions tend to be
more intuitive than in
vector
3. Positional
precision
Can be very precise and
thus accurate
Precision increased with
increased processing time
and data storage needs
accuracy. Limited by pixel
size
4. Attribute
precision
Good for polygon, point
and line data; not good
for continuous data
unless connected to TIN
or similar technology
Good for continuous data;
limited by size of pixels in
representing attribute
distribution in real world
5. Comprehensiven
ess of analysis
capability
Good for spatial query
and relatively simple
data, analysis-limited to
Intersections
Not good for spatial query
but very good for spatial
analysis filtering, and
modeling
9.
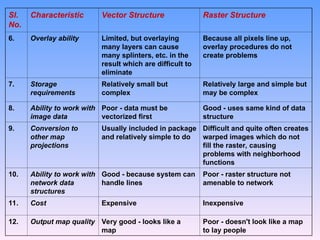
Sl.
No.
Characteristic Vector StructureRaster Structure
6. Overlay ability Limited, but overlaying
many layers can cause
many splinters, etc. in the
result which are difficult to
eliminate
Because all pixels line up,
overlay procedures do not
create problems
7. Storage
requirements
Relatively small but
complex
Relatively large and simple but
may be complex
8. Ability to work with
image data
Poor - data must be
vectorized first
Good - uses same kind of data
structure
9. Conversion to
other map
projections
Usually included in package
and relatively simple to do
Difficult and quite often creates
warped images which do not
fill the raster, causing
problems with neighborhood
functions
10. Ability to work with
network data
structures
Good - because system can
handle lines
Poor - raster structure not
amenable to network
11. Cost Expensive Inexpensive
12. Output map quality Very good - looks like a
map
Poor - doesn't look like a map
to lay people
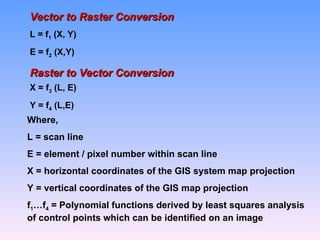
11.
Vector to RasterConversion
Vector to Raster Conversion
L = f1 (X, Y)
E = f2 (X,Y)
Raster to Vector Conversion
Raster to Vector Conversion
X = f3 (L, E)
Y = f4 (L,E)
Where,
L = scan line
E = element / pixel number within scan line
X = horizontal coordinates of the GIS system map projection
Y = vertical coordinates of the GIS map projection
f1…f4 = Polynomial functions derived by least squares analysis
of control points which can be identified on an image
12.
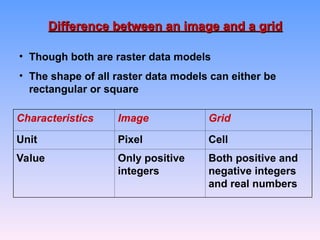
Difference between animage and a grid
Difference between an image and a grid
• Though both are raster data models
• The shape of all raster data models can either be
rectangular or square
Characteristics Image Grid
Unit Pixel Cell
Value Only positive
integers
Both positive and
negative integers
and real numbers
13.
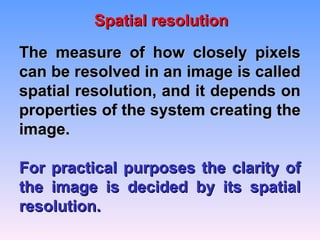
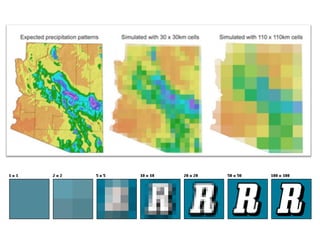
The measure ofhow closely pixels
The measure of how closely pixels
can be resolved in an image is called
can be resolved in an image is called
spatial resolution, and it depends on
spatial resolution, and it depends on
properties of the system creating the
properties of the system creating the
image.
image.
For practical purposes the clarity of
For practical purposes the clarity of
the image is decided by its spatial
the image is decided by its spatial
resolution.
resolution.
Spatial resolution
Spatial resolution