CONTENTS
1. INTRODUCTION
a. RASTER
b.VECTOR
2. DEFINITIONS
3. CHARACTERISTICS
4. ADVANTAGES OF RASTER AND VECTOR
5. DISADVANTAGES OF RASTER AND VECTOR DATA
6. COMPARISION BETWEEN RASTER AND VECTOR
7. EXAMPLES
8. CONCLUSION
3.
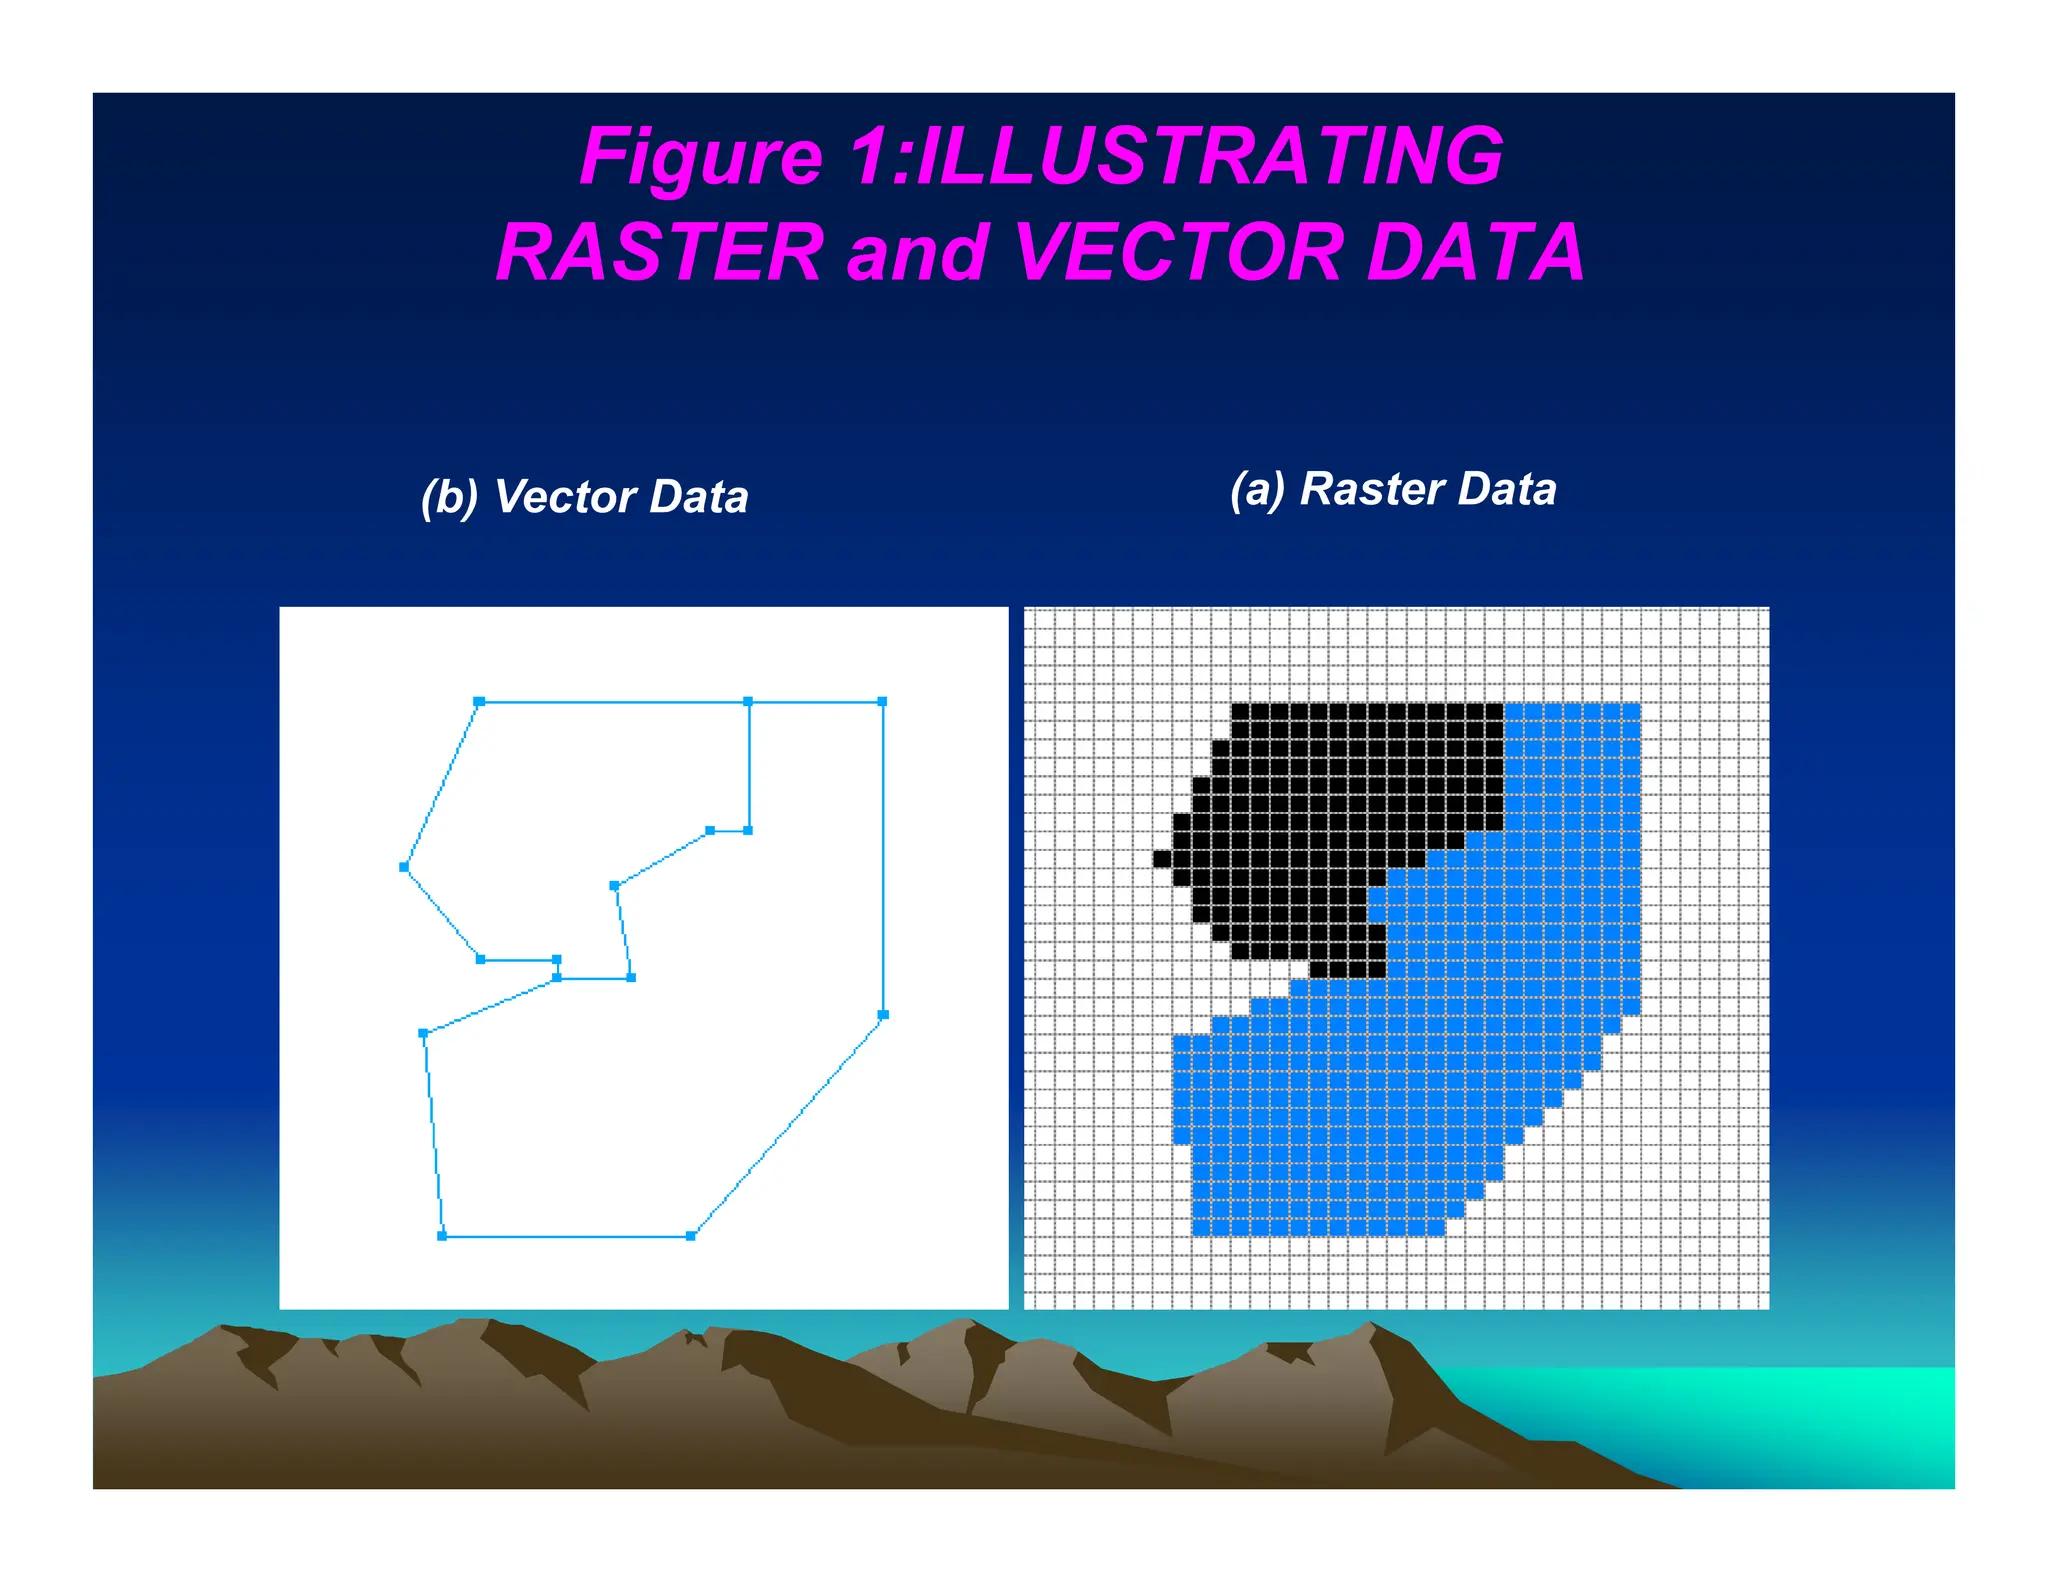
RASTER AND VECTORDATA
• Geographic features stored in a GIS can be
considered as one of three types:
• points: no area at this scale (e.g. building,
tower)
• lines (arcs): no width at this scale (e.g. river,
road, administrative boundary)
• areas (polygons): line surrounding enclosed
area (e.g. forest stand, census district)
• Spatial characteristics of features can be stored
in a GIS in one of two ways:
as raster data or as vector data.
4.
Thus geographicallyreferenced data is stored in: -
· Raster (grid or cellular-based) data structure.
· x, y coordinate reference-based (vector) data
structure.
Raster data structure
Grid or cellular-based
Grid representation of a measured image property in
which each grid cell (pixel) comprises a digital
number. The larger the area represented the lower the
resolution of the data. The smaller the area covered the
greater the resolution and the more accurately features
are represented.
5.
Vector data structure
Arc-nodemodel
Arcs represent the shape of lines and
are split at their intersections with other
arcs, where nodes occur; nodes
represent the beginning and ending
vertex of each arc. Vector format-
representation of features on the earth as
lines, points, or polygons as a series or
XY Cartesian coordinates
6.
DEFINITIONS:
• RASTER DATAMODEL
A spatial data model that uses a
grid and cells to represent the spatial
variation of a feature.
• VECTOR DATA MODEL
A data model that uses points and
their x-, y- coordinates to construct
spatial features.
7.
Characteristics Of RasterData Model
• Simple 'grid' structure of rows and
columns.
• Based on cells or picture elements
(pixels).
• Linear feature (e.g. a road) is a
contiguous set of cells.
• Resolution based on size of grid (cell)
the smaller the cell, the higher the
resolution.
• Features are considered homogenous
within a pixel.
• Storage increases with the square of the
resolution.
8.
Characteristics Of VectorData Model
• Based on objects (points, lines, areas).
• Constructed using arcs, nodes and
vertices.
• Resolution can be independent of detail.
• Every point has a unique location.
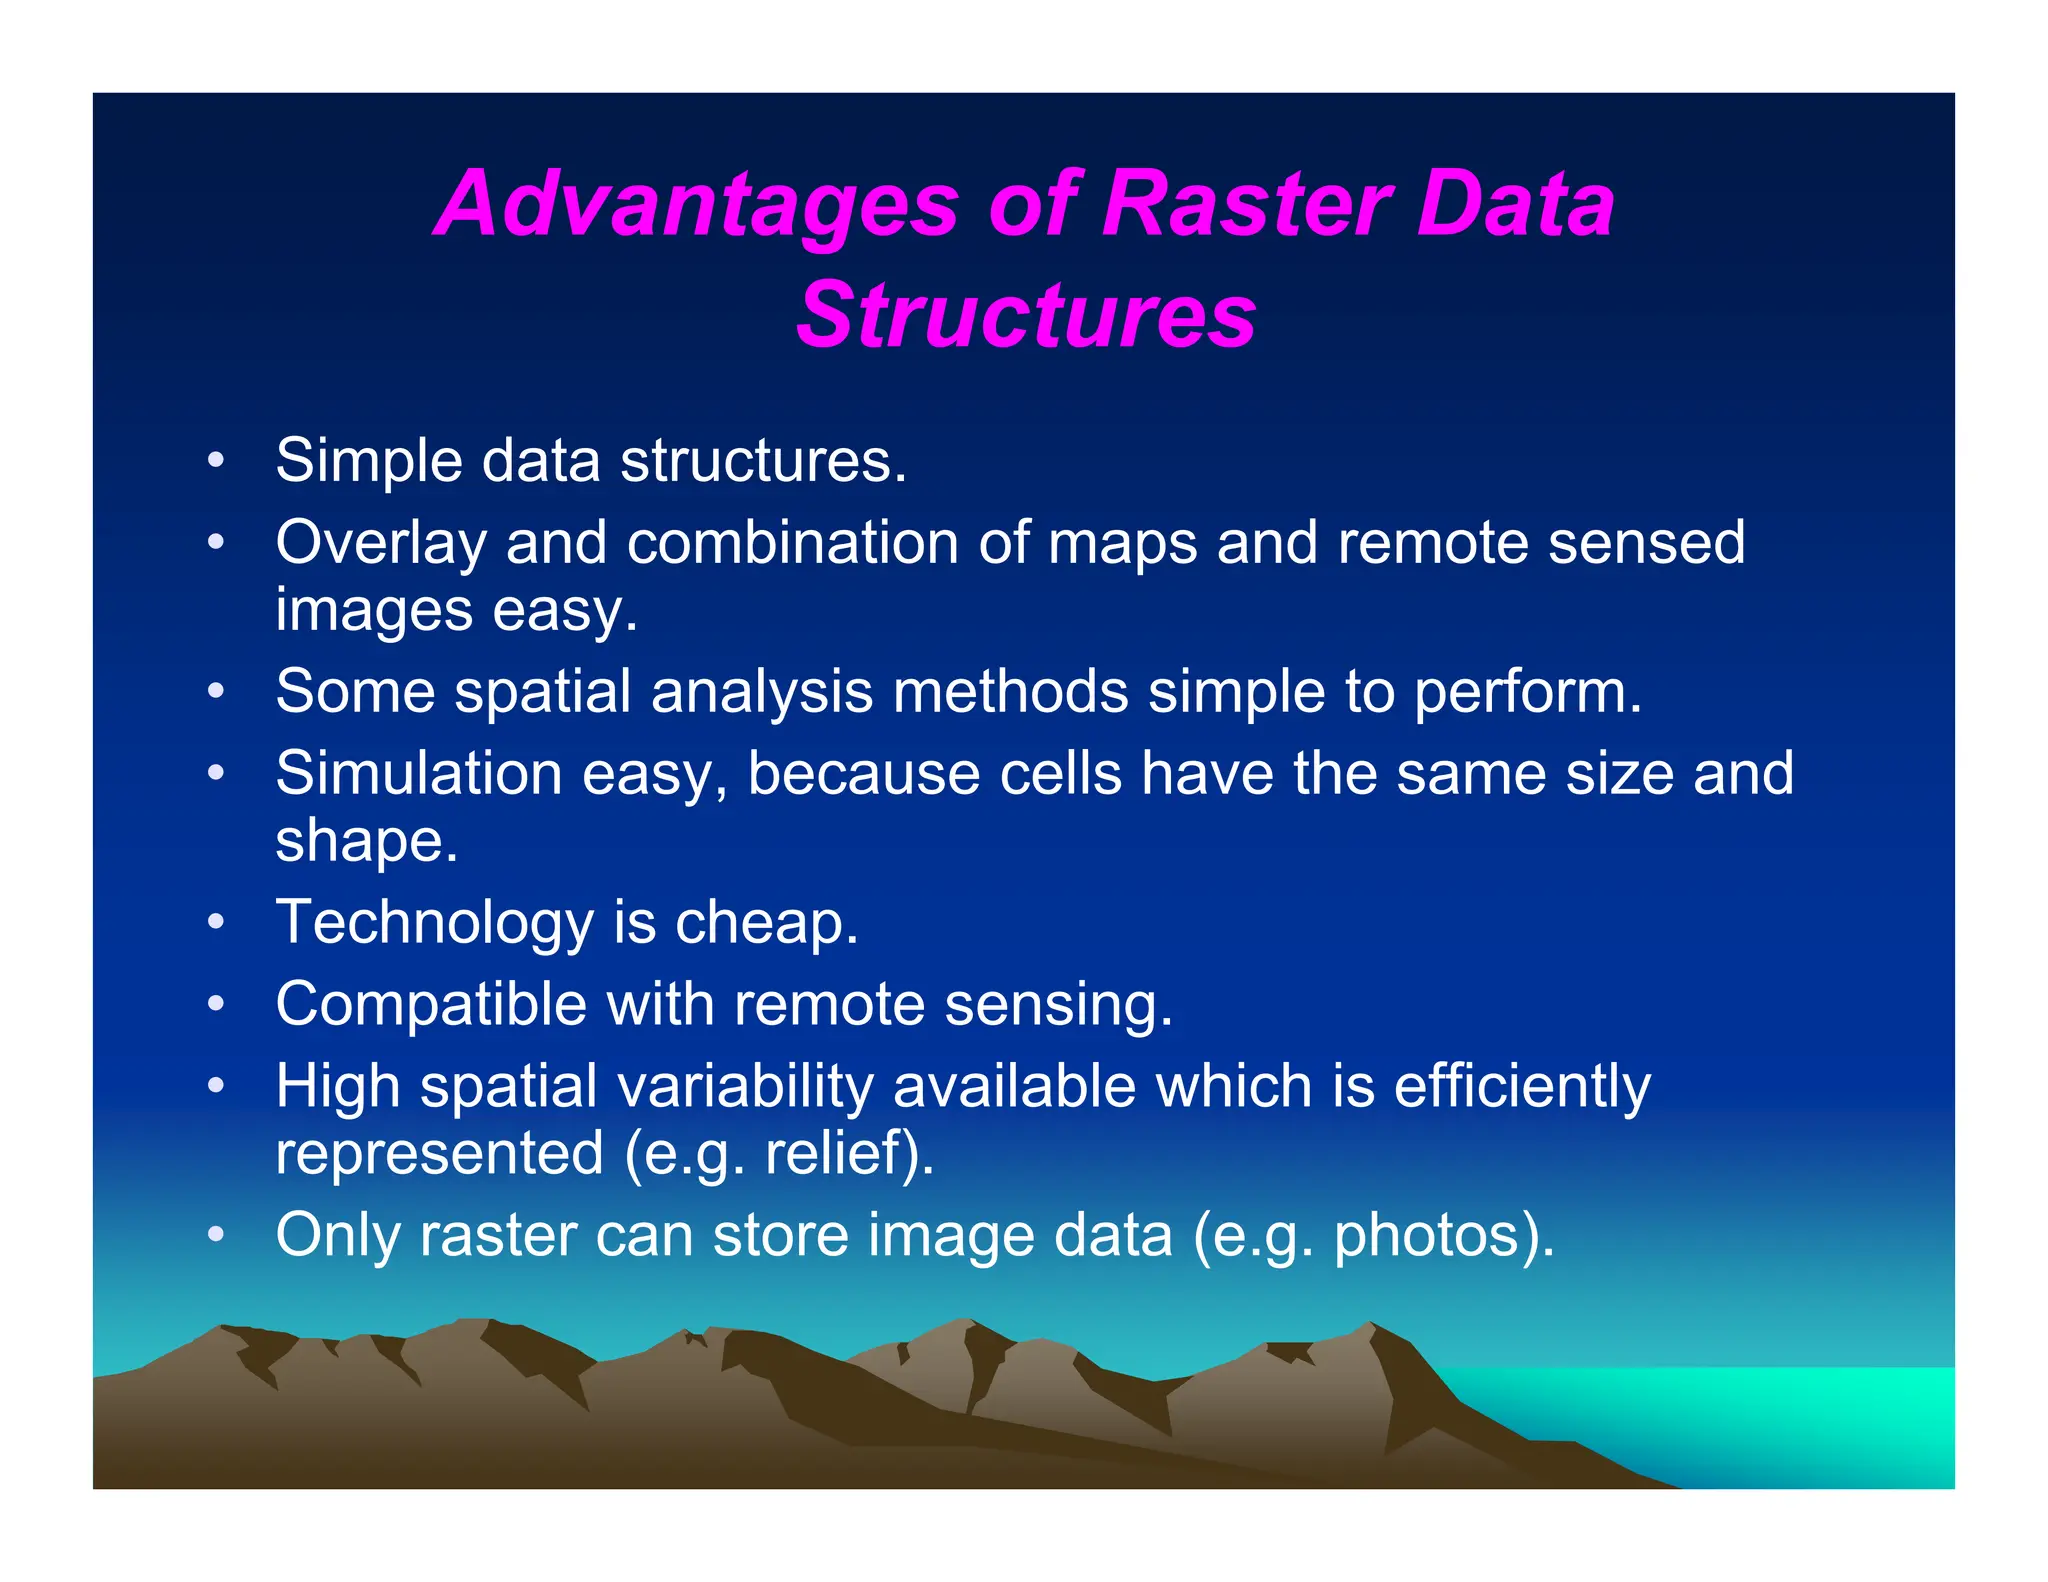
Advantages of RasterData
Structures
• Simple data structures.
• Overlay and combination of maps and remote sensed
images easy.
• Some spatial analysis methods simple to perform.
• Simulation easy, because cells have the same size and
shape.
• Technology is cheap.
• Compatible with remote sensing.
• High spatial variability available which is efficiently
represented (e.g. relief).
• Only raster can store image data (e.g. photos).
11.
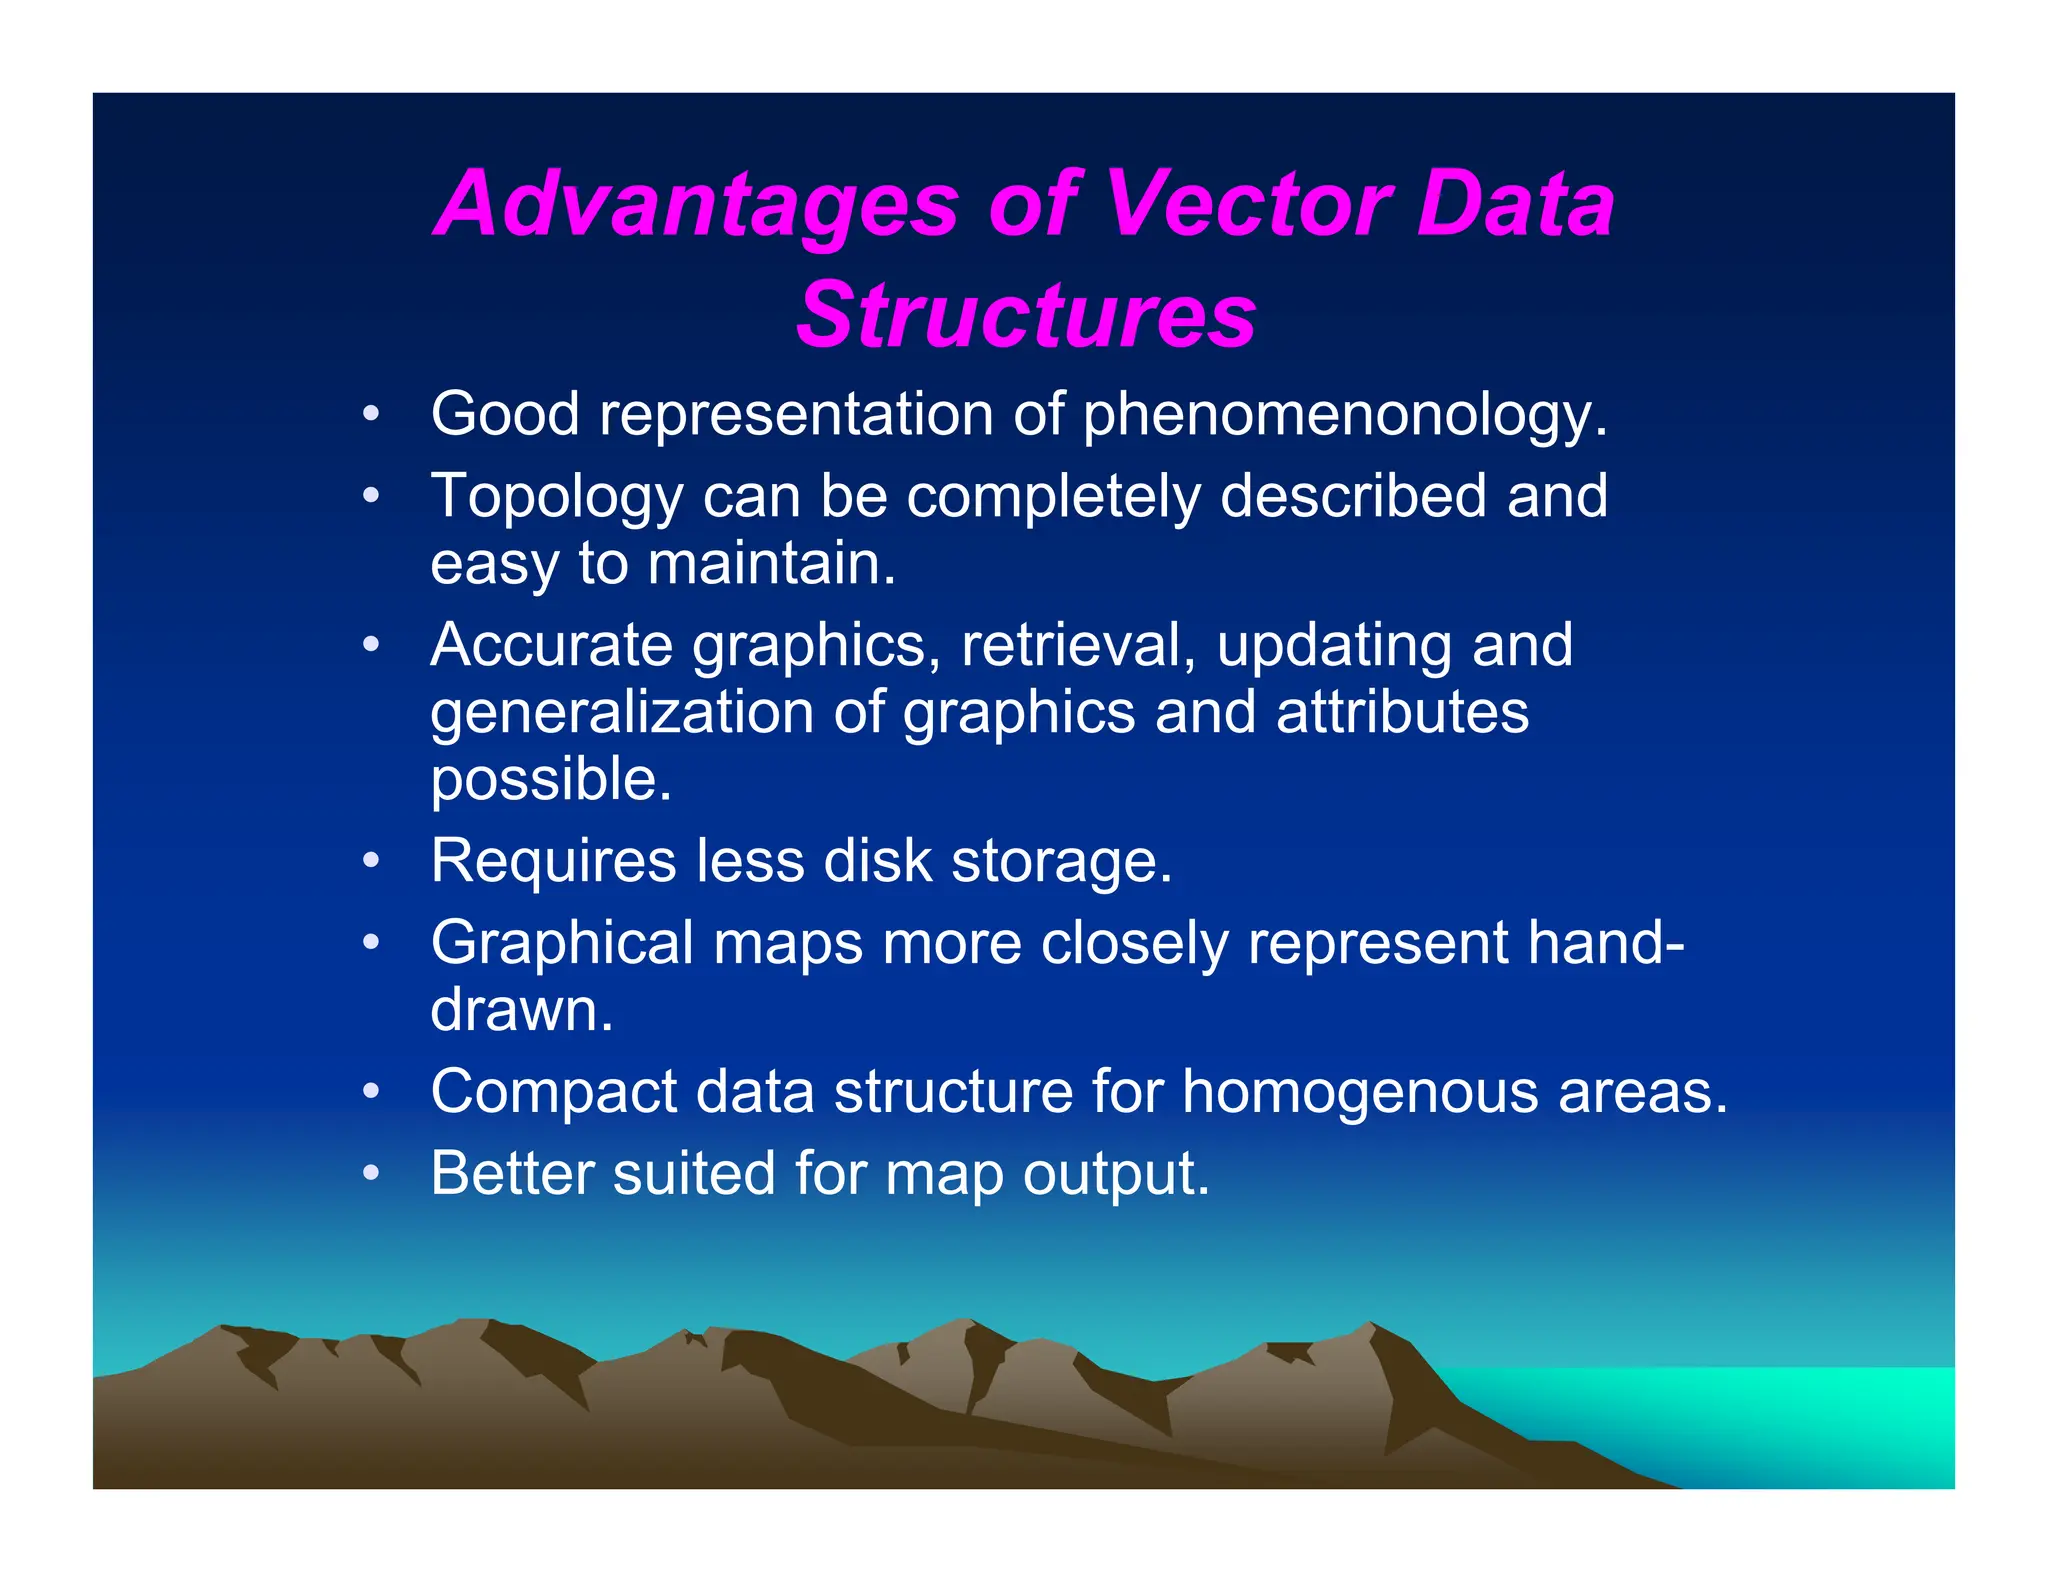
Advantages of VectorData
Structures
• Good representation of phenomenonology.
• Topology can be completely described and
easy to maintain.
• Accurate graphics, retrieval, updating and
generalization of graphics and attributes
possible.
• Requires less disk storage.
• Graphical maps more closely represent hand-
drawn.
• Compact data structure for homogenous areas.
• Better suited for map output.
12.
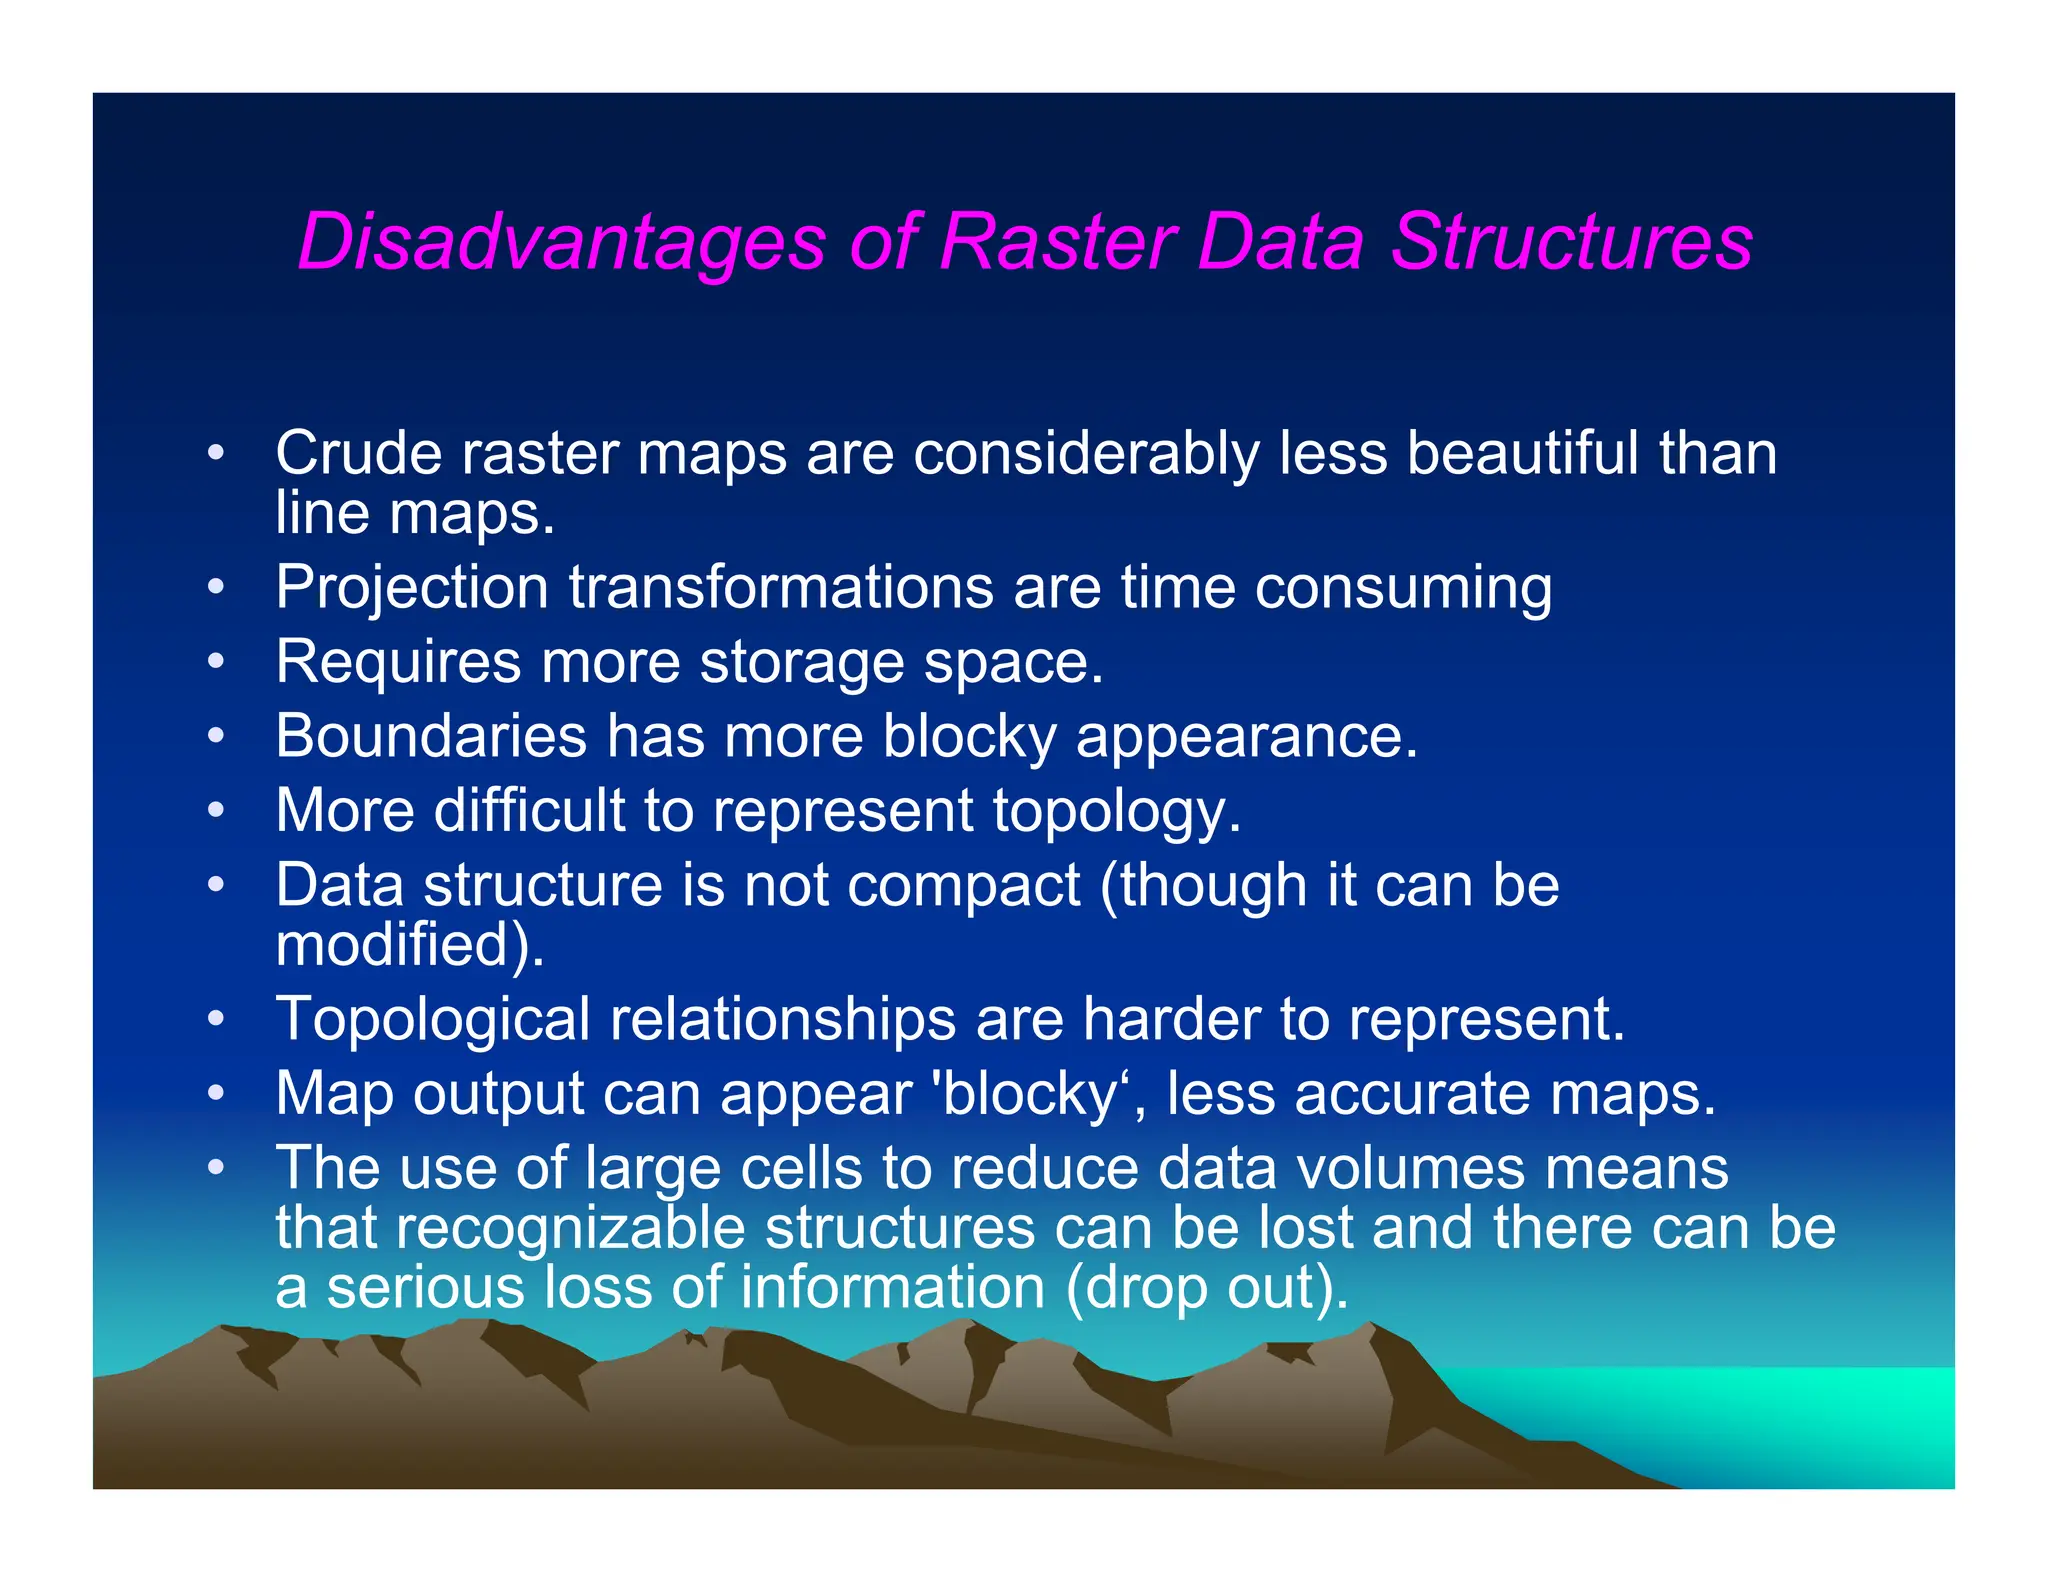
Disadvantages of RasterData Structures
• Crude raster maps are considerably less beautiful than
line maps.
• Projection transformations are time consuming
• Requires more storage space.
• Boundaries has more blocky appearance.
• More difficult to represent topology.
• Data structure is not compact (though it can be
modified).
• Topological relationships are harder to represent.
• Map output can appear 'blocky‘, less accurate maps.
• The use of large cells to reduce data volumes means
that recognizable structures can be lost and there can be
a serious loss of information (drop out).
13.
Disadvantages of VectorData Structures
• More complex Data Structures.
• Combination of several vector polygon maps or polygon and raster maps
through overlay creates difficulties.
• Simulation is difficult because each unit has a different topological form.
• Display and plotting can be expensive, particularly for high quality, color and
cross-hatching.
• Spatial analysis and filtering within polygons are impossible.
• Not as compatible with remote sensing as raster data.
• Overlay analysis more time-consuming than raster data.
• High spatial variability is less efficiently stored.
• Cannot store (continuously varying) image data.
14.
COMPARISON OF RASTERAND VECTOR
DATA MODELS
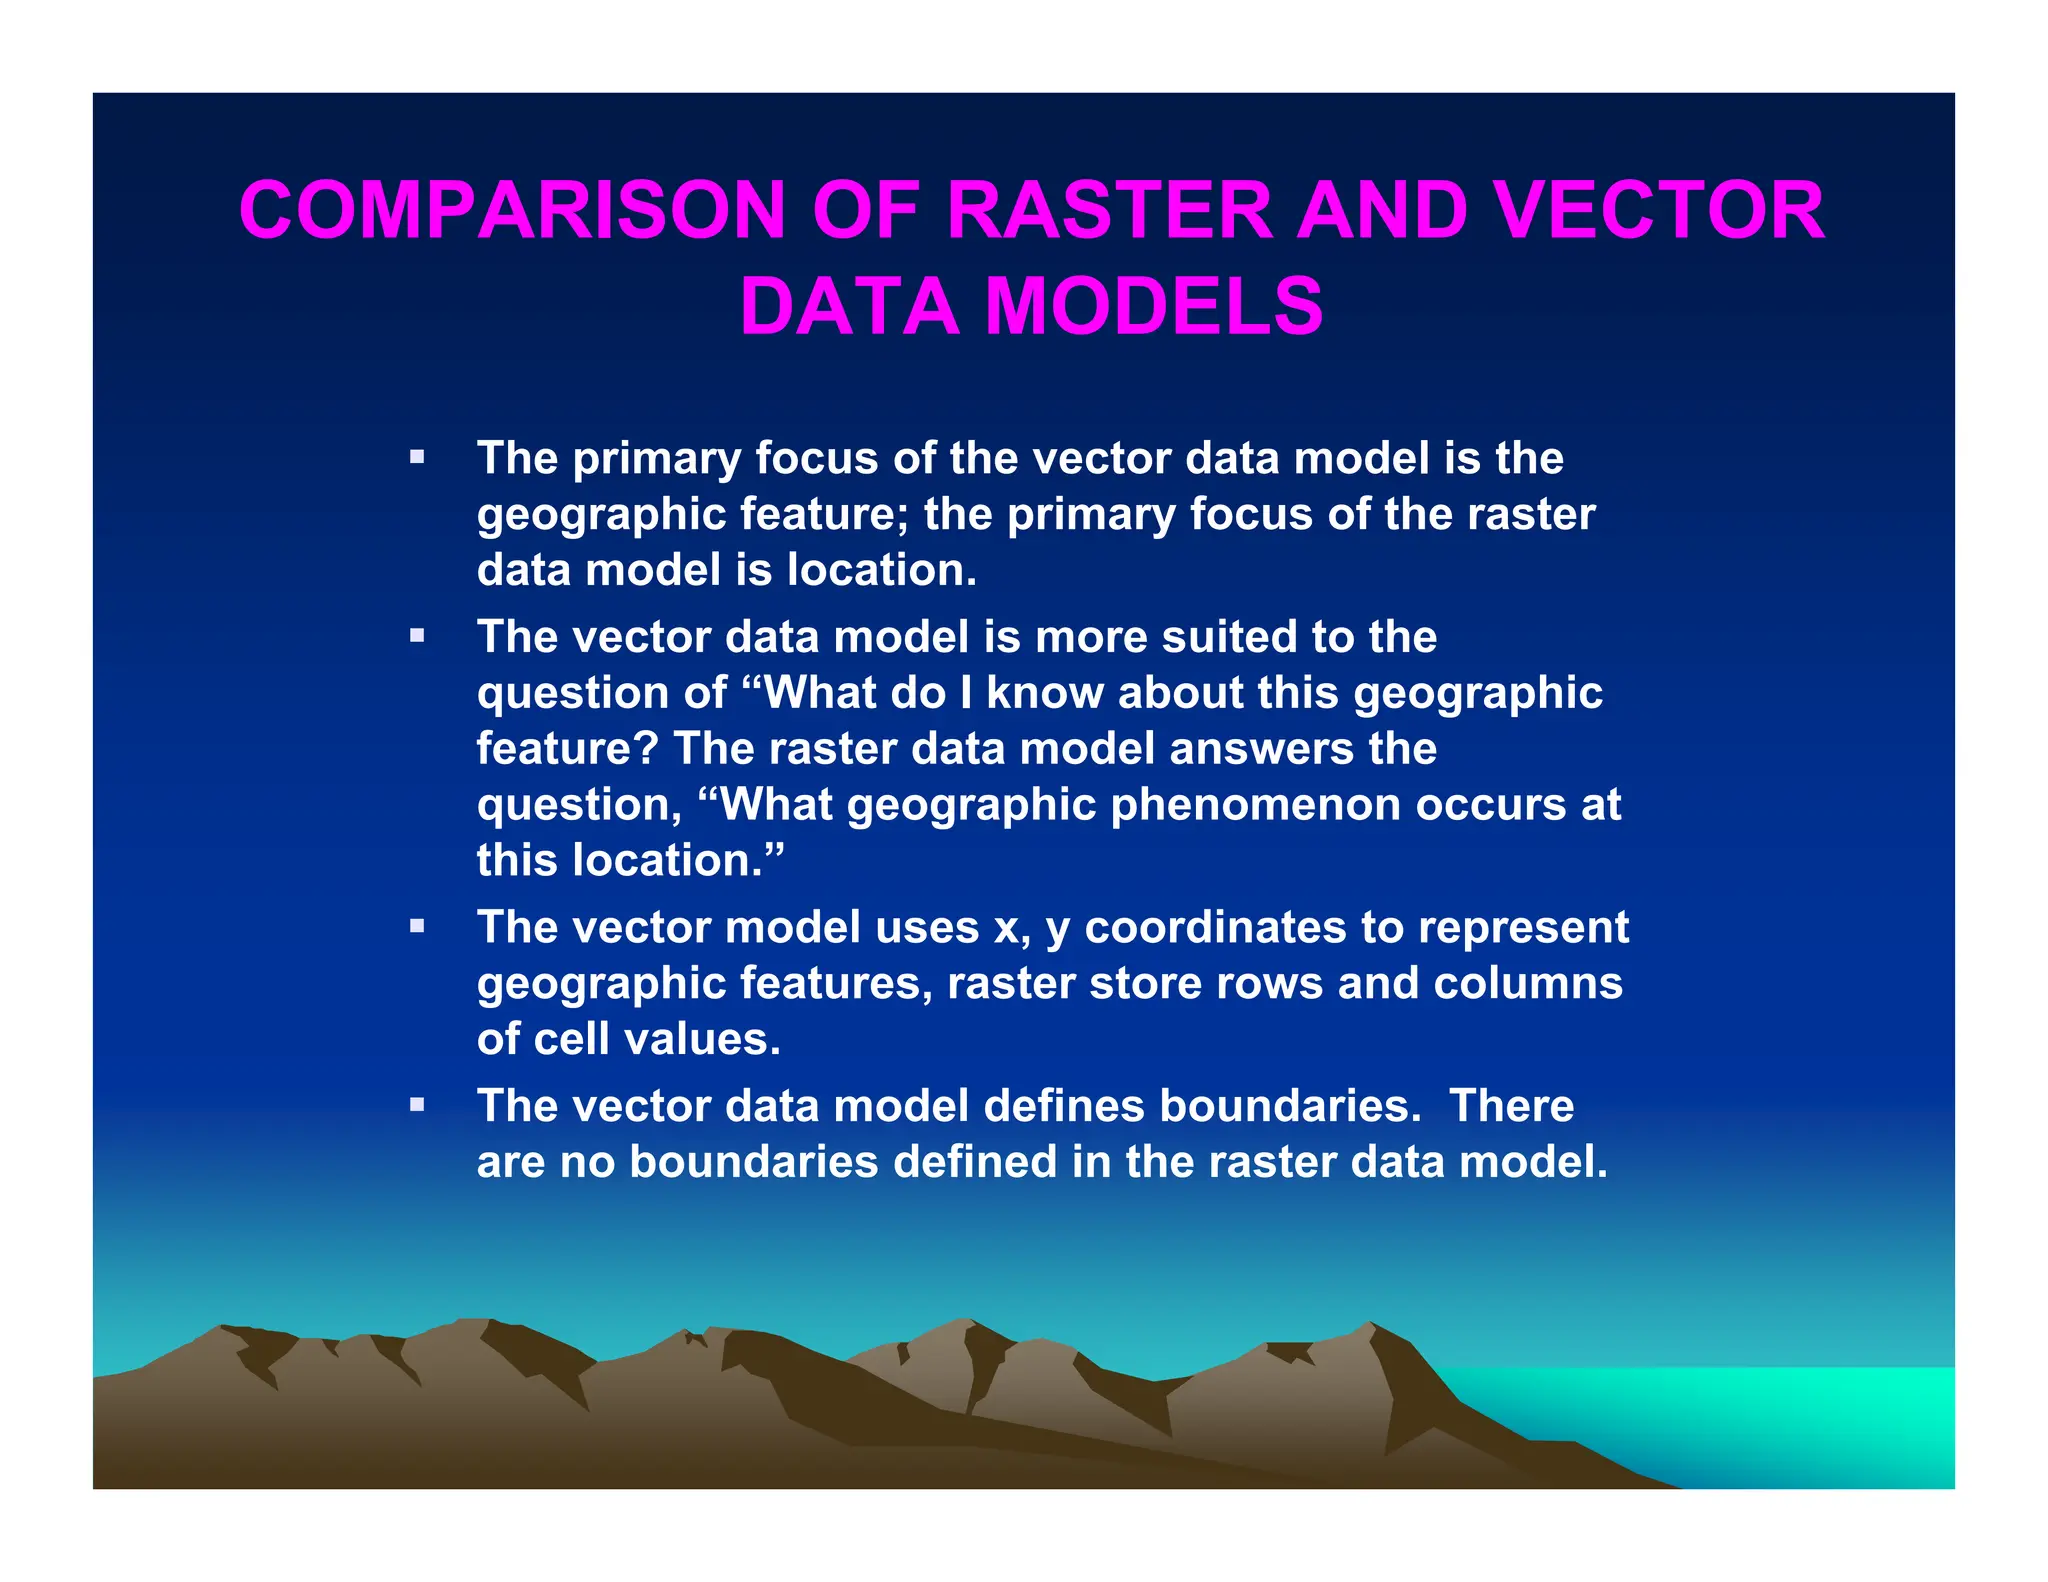
The primary focus of the vector data model is the
geographic feature; the primary focus of the raster
data model is location.
The vector data model is more suited to the
question of “What do I know about this geographic
feature? The raster data model answers the
question, “What geographic phenomenon occurs at
this location.”
The vector model uses x, y coordinates to represent
geographic features, raster store rows and columns
of cell values.
The vector data model defines boundaries. There
are no boundaries defined in the raster data model.
15.
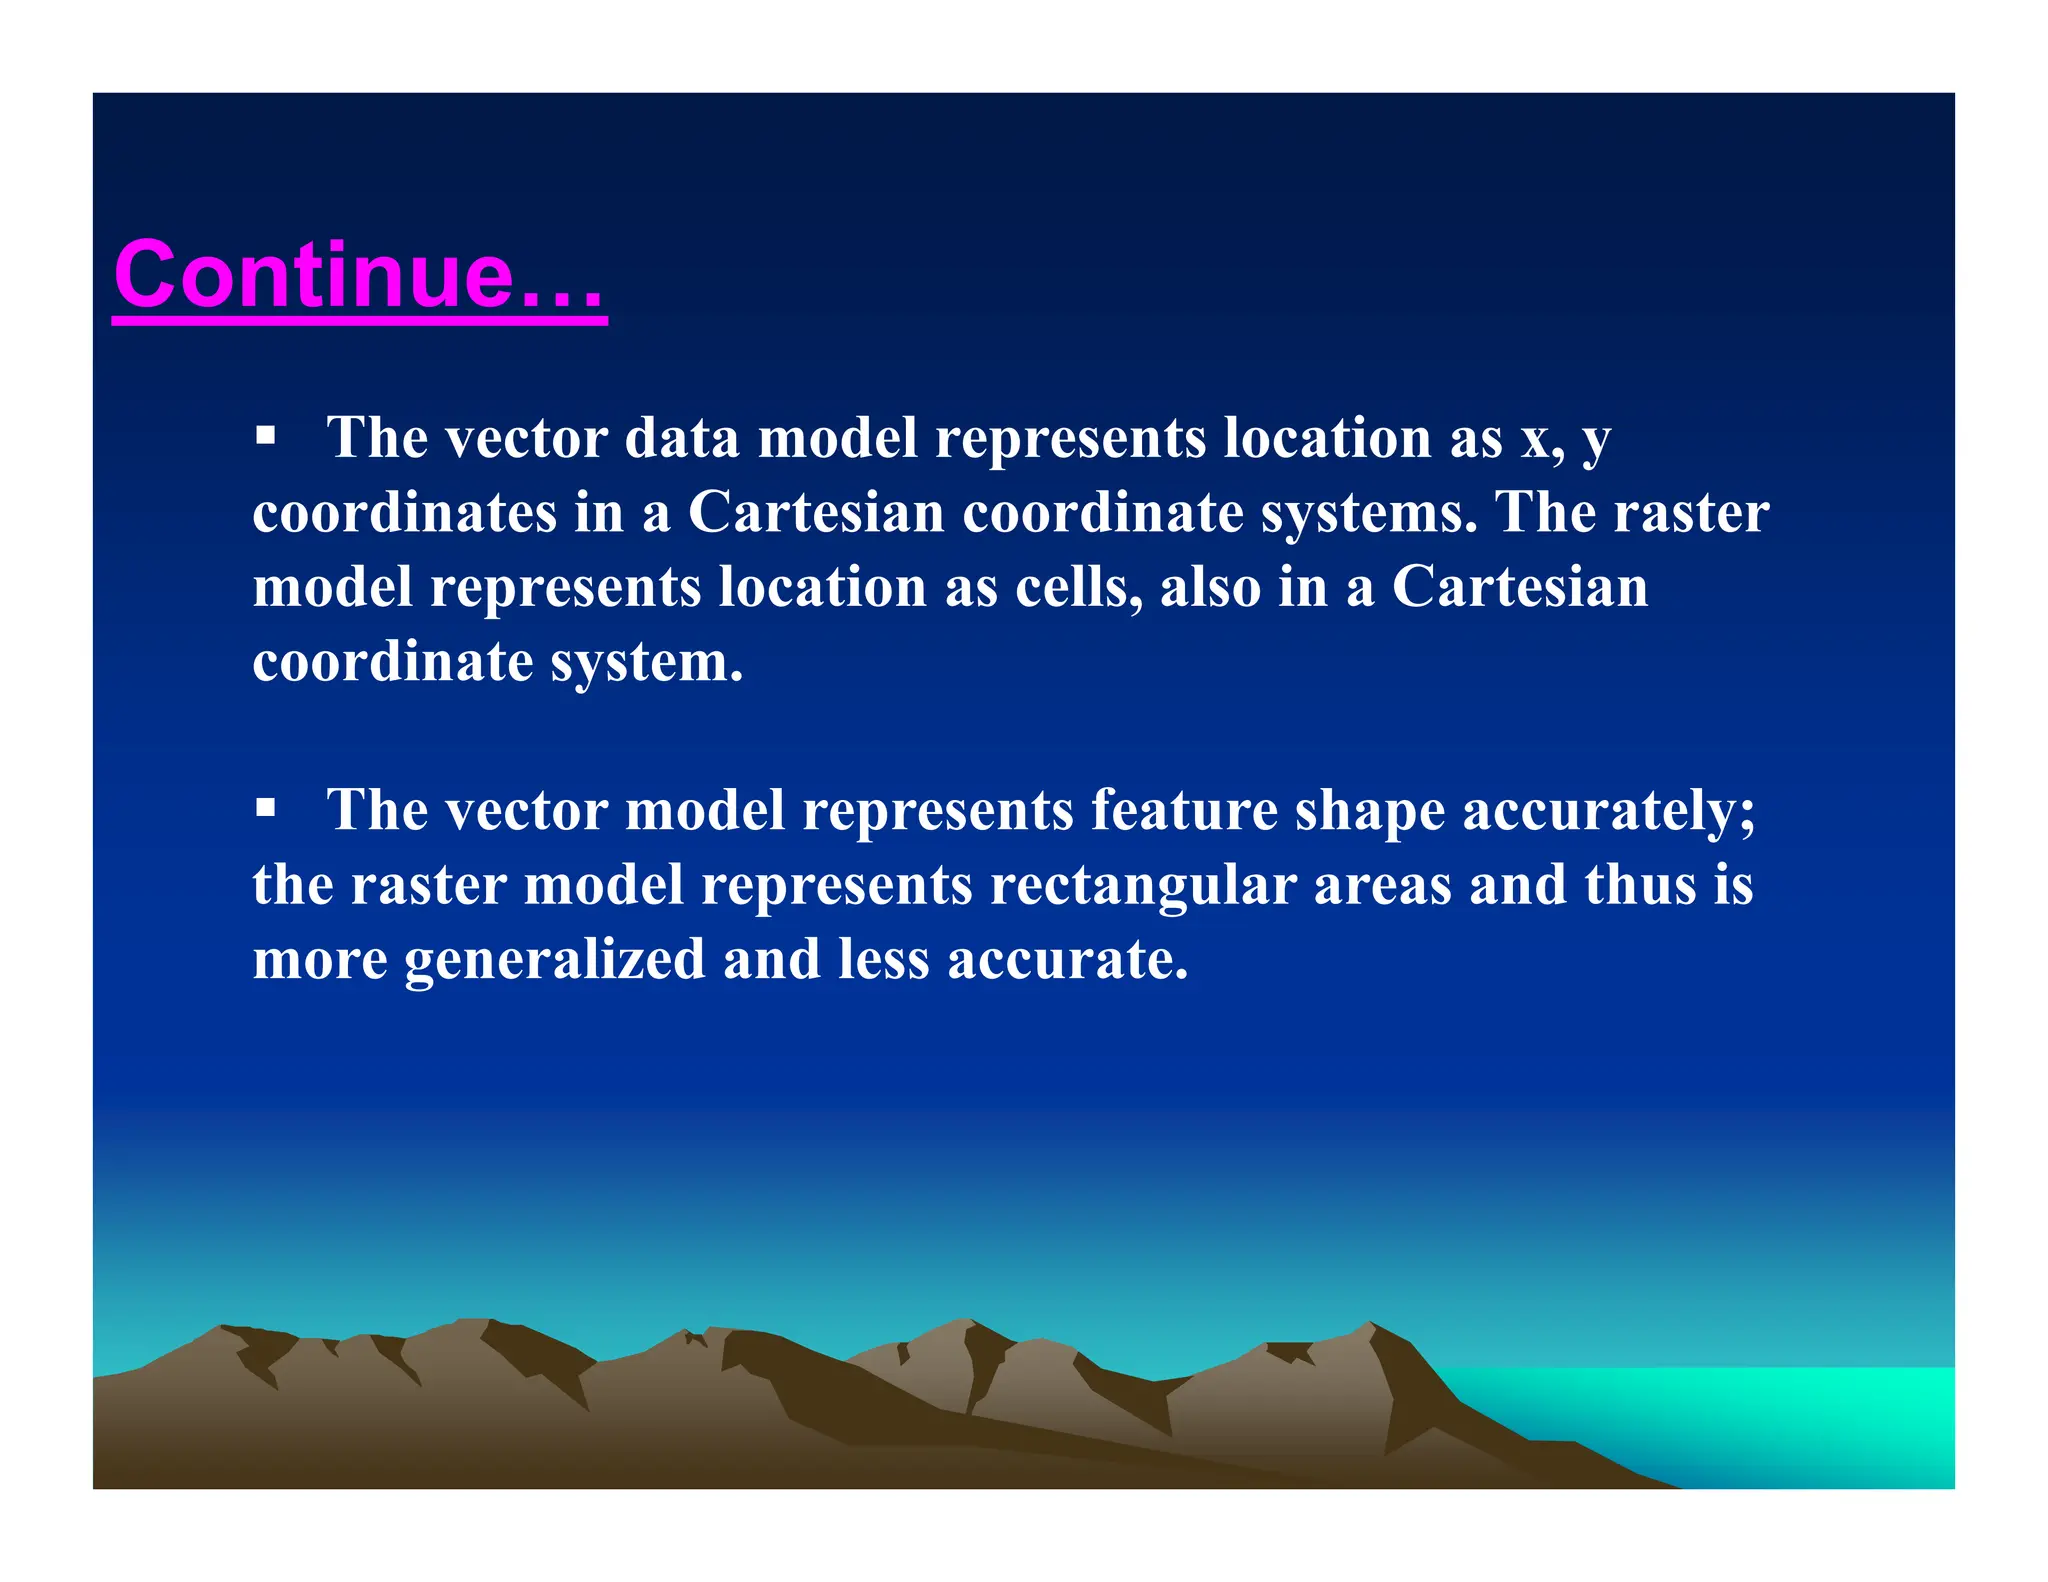
The vectordata model represents location as x, y
coordinates in a Cartesian coordinate systems. The raster
model represents location as cells, also in a Cartesian
coordinate system.
The vector model represents feature shape accurately;
the raster model represents rectangular areas and thus is
more generalized and less accurate.
Continue…
16.
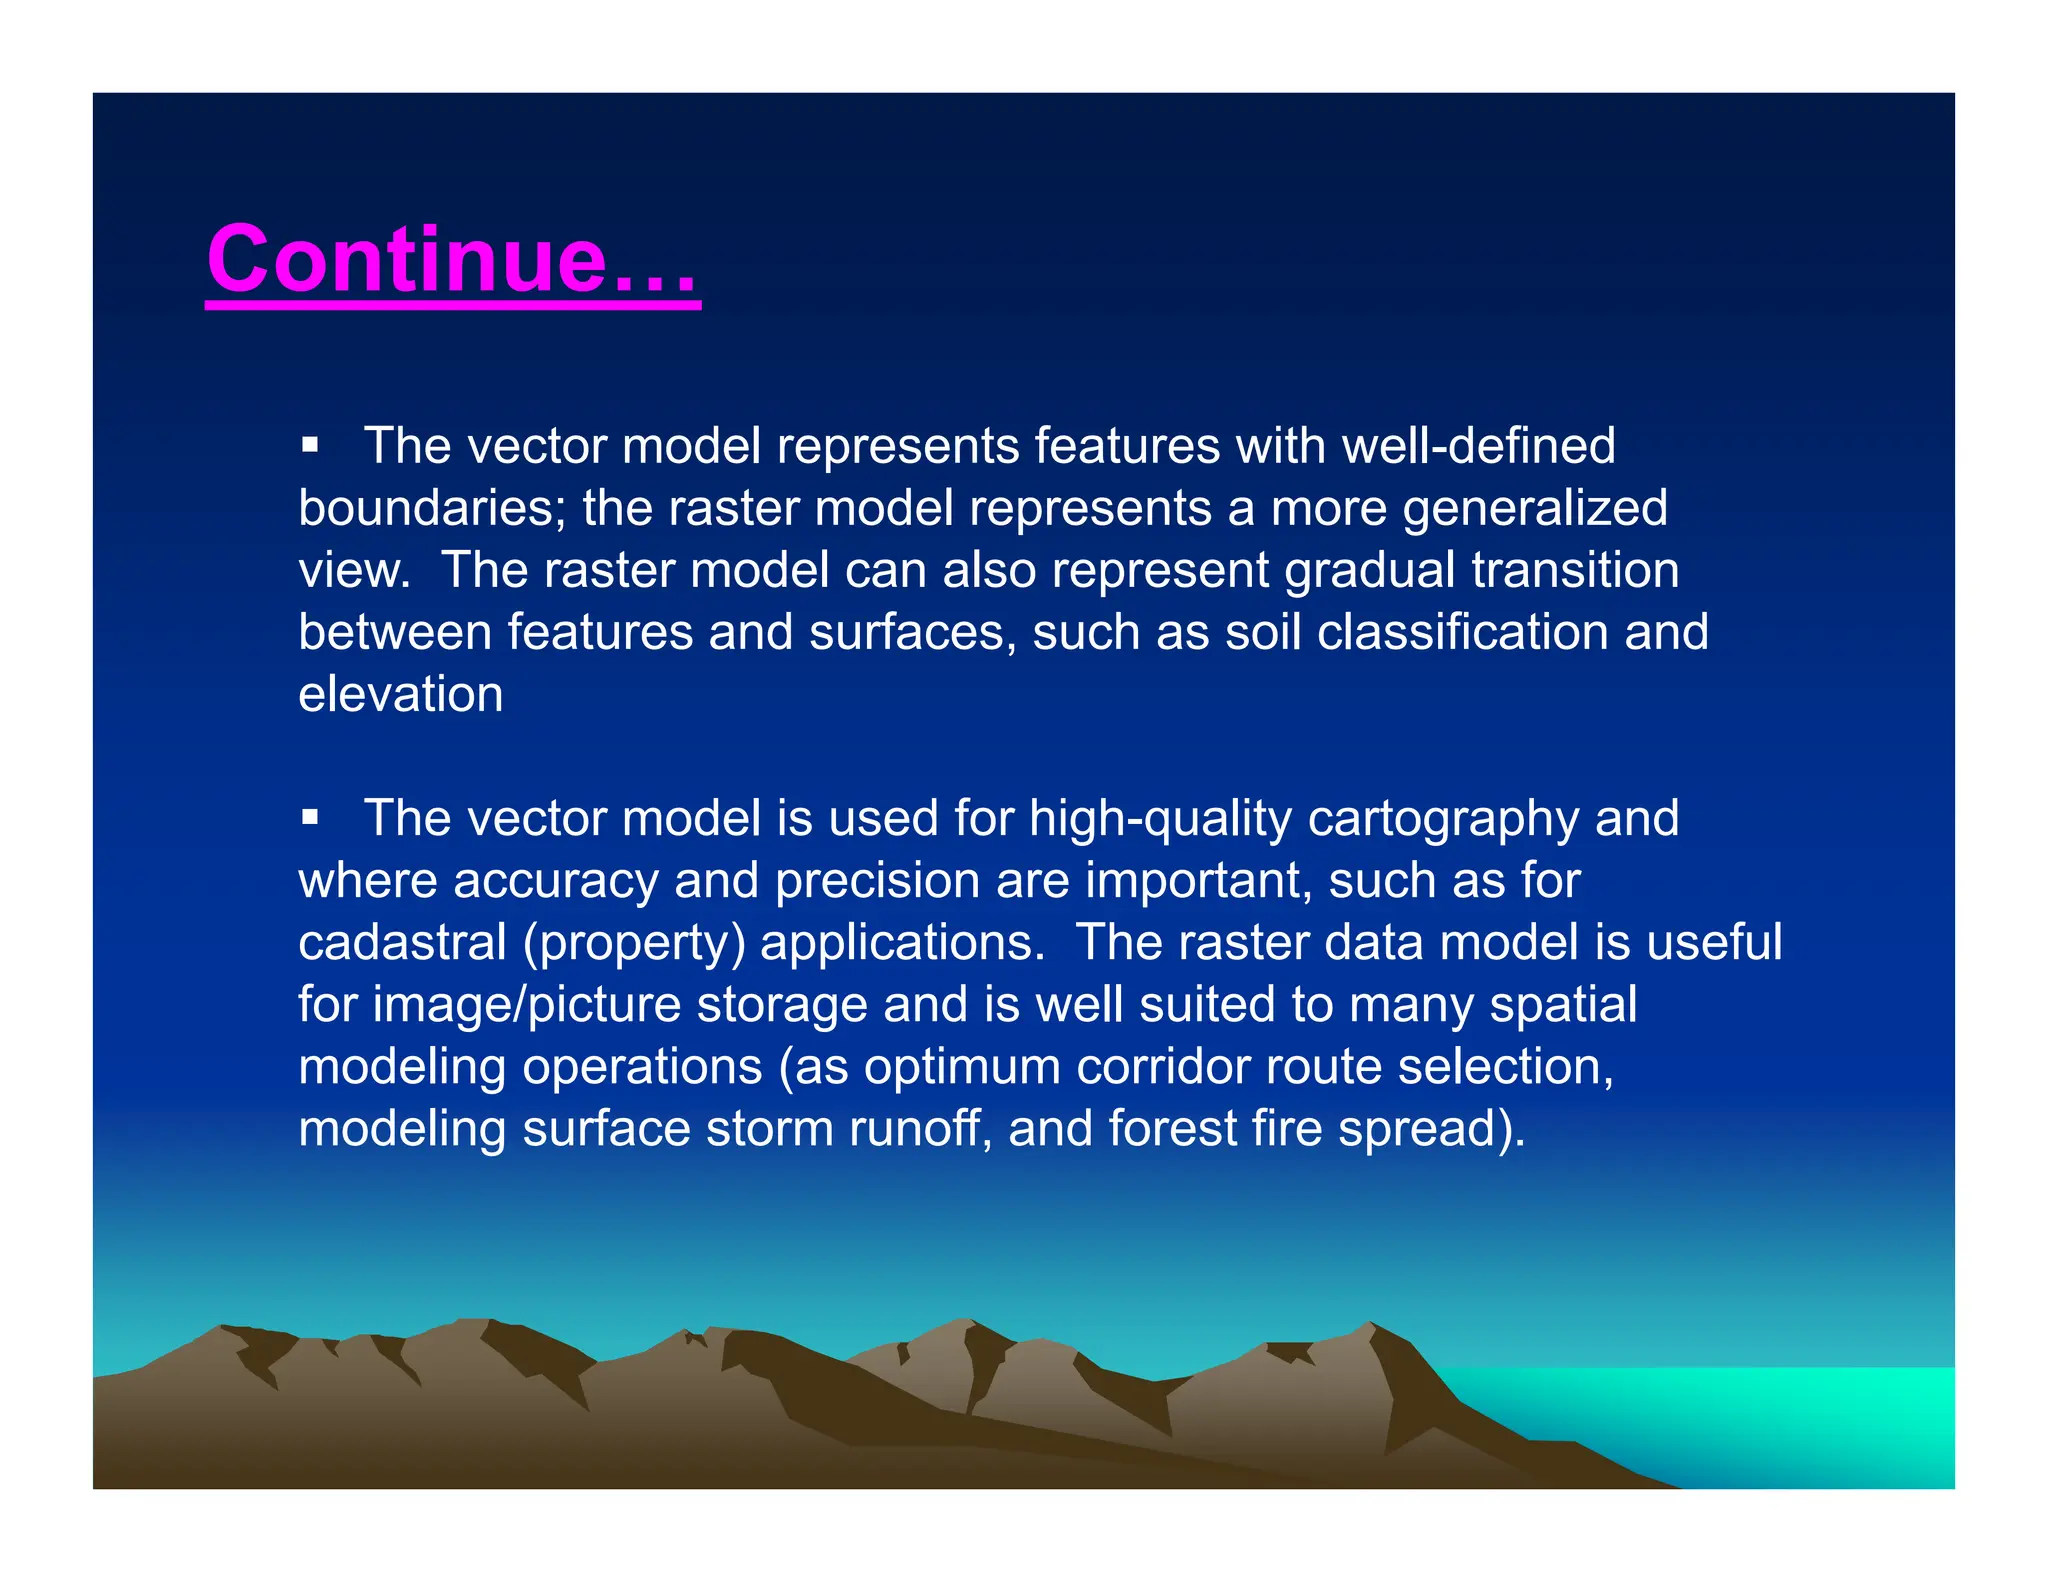
The vectormodel represents features with well-defined
boundaries; the raster model represents a more generalized
view. The raster model can also represent gradual transition
between features and surfaces, such as soil classification and
elevation
The vector model is used for high-quality cartography and
where accuracy and precision are important, such as for
cadastral (property) applications. The raster data model is useful
for image/picture storage and is well suited to many spatial
modeling operations (as optimum corridor route selection,
modeling surface storm runoff, and forest fire spread).
Continue…
17.
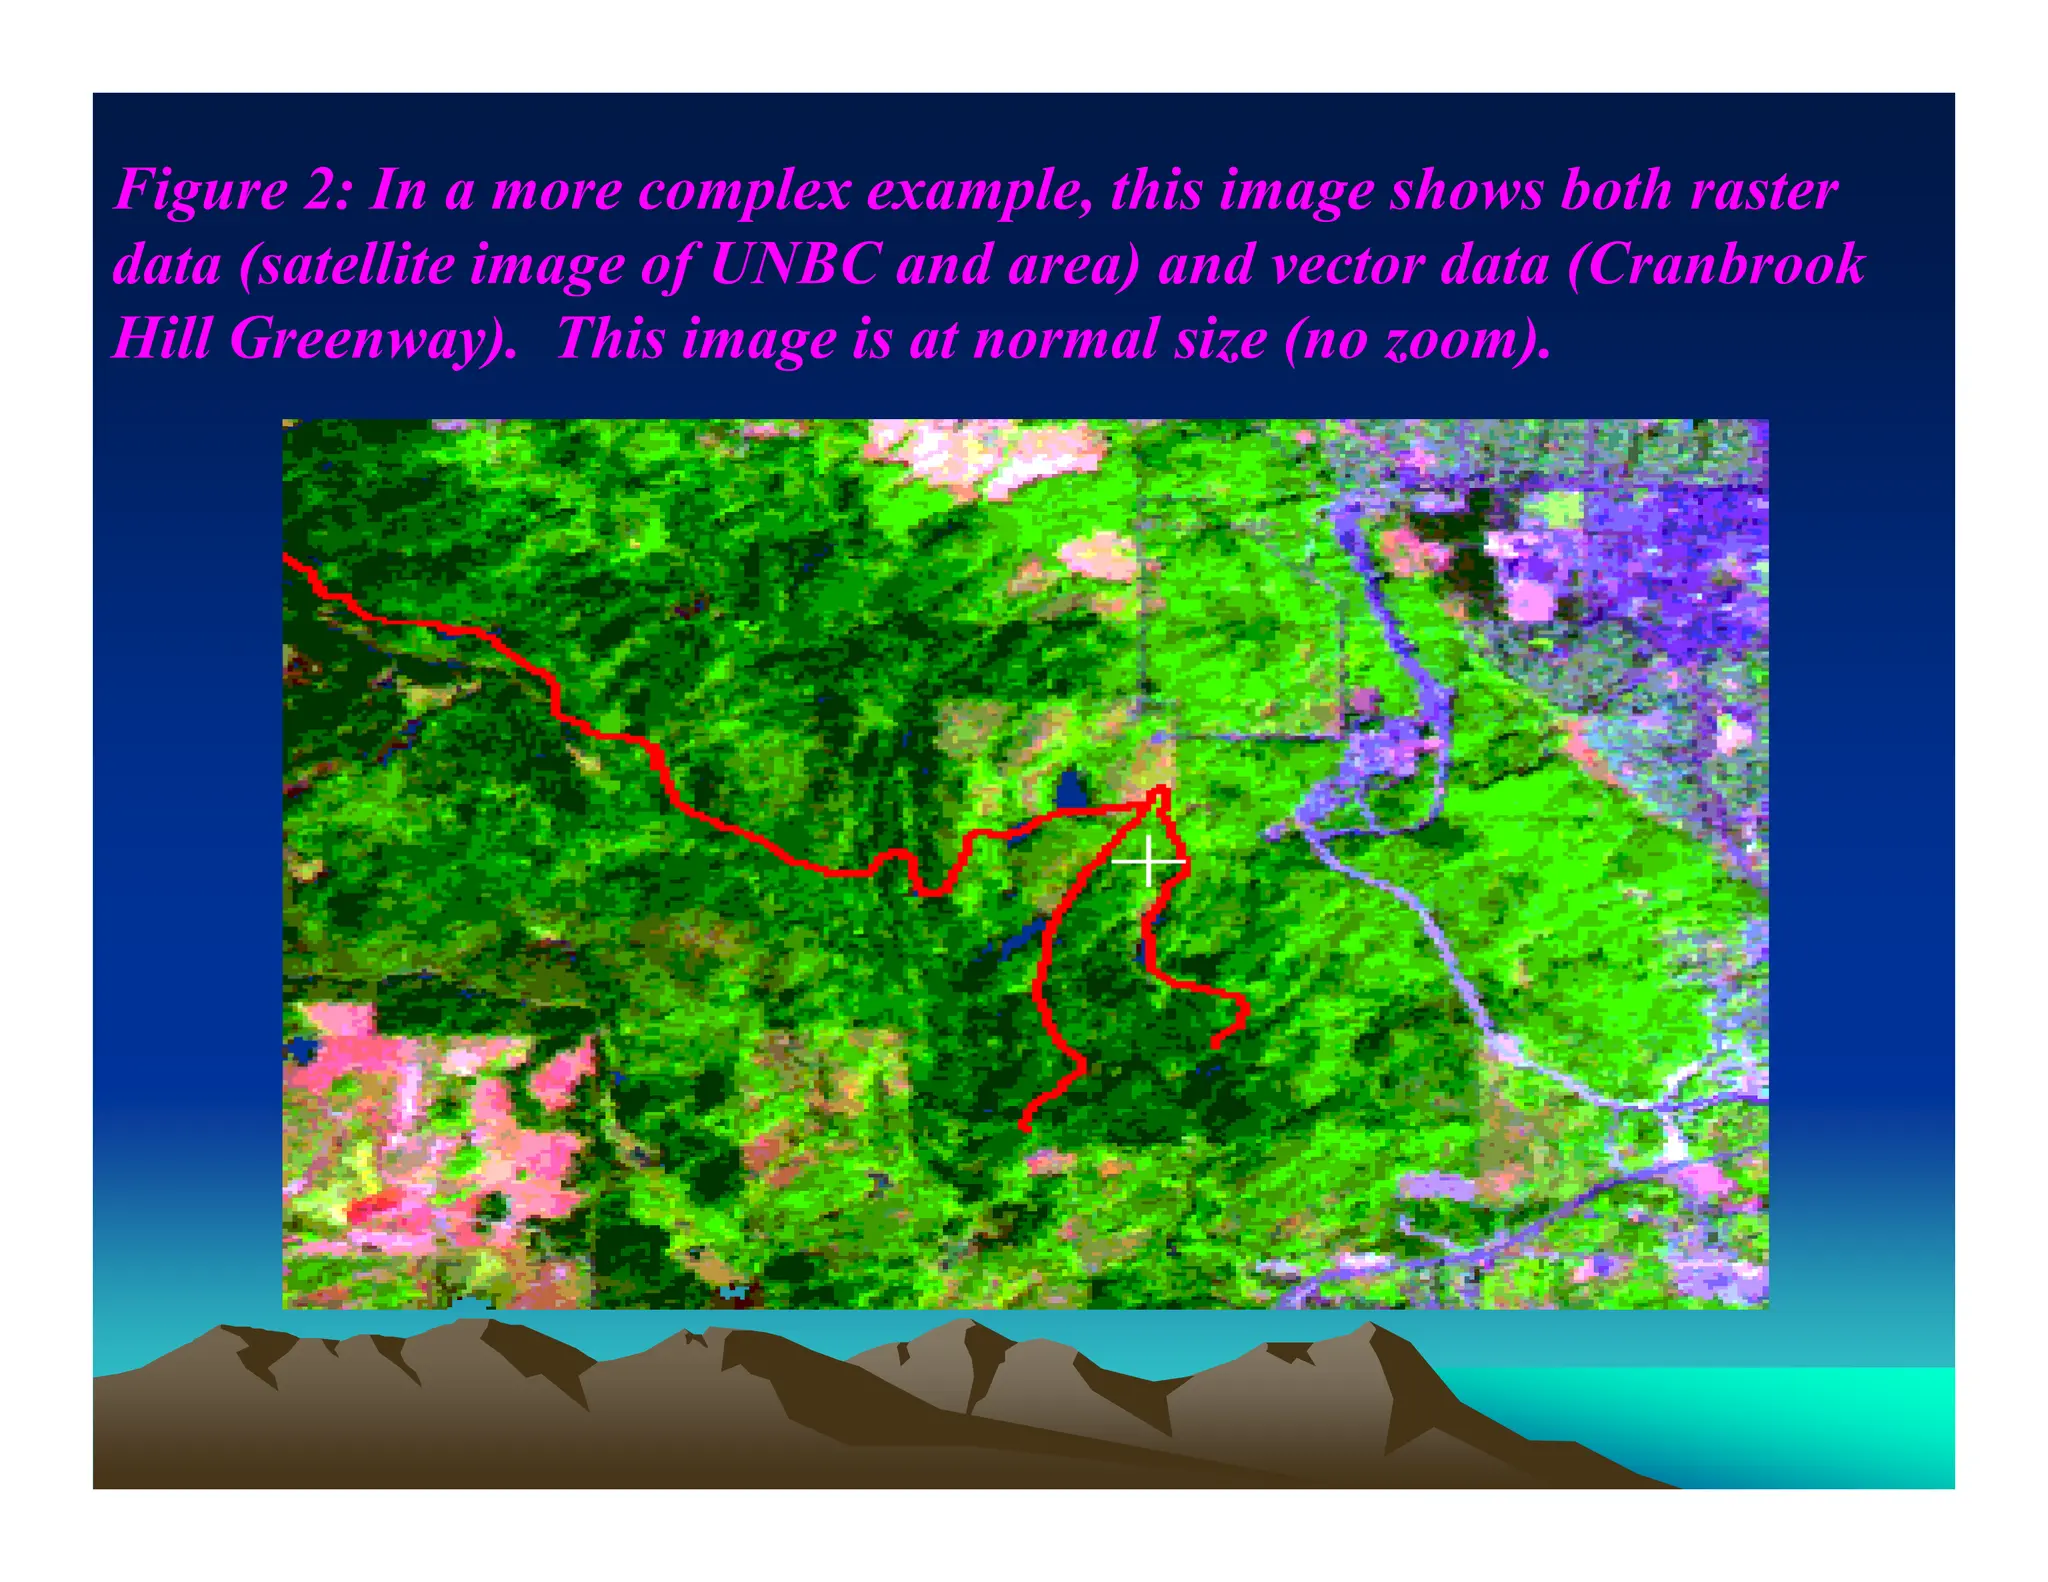
Figure 2: Ina more complex example, this image shows both raster
data (satellite image of UNBC and area) and vector data (Cranbrook
Hill Greenway). This image is at normal size (no zoom).
18.
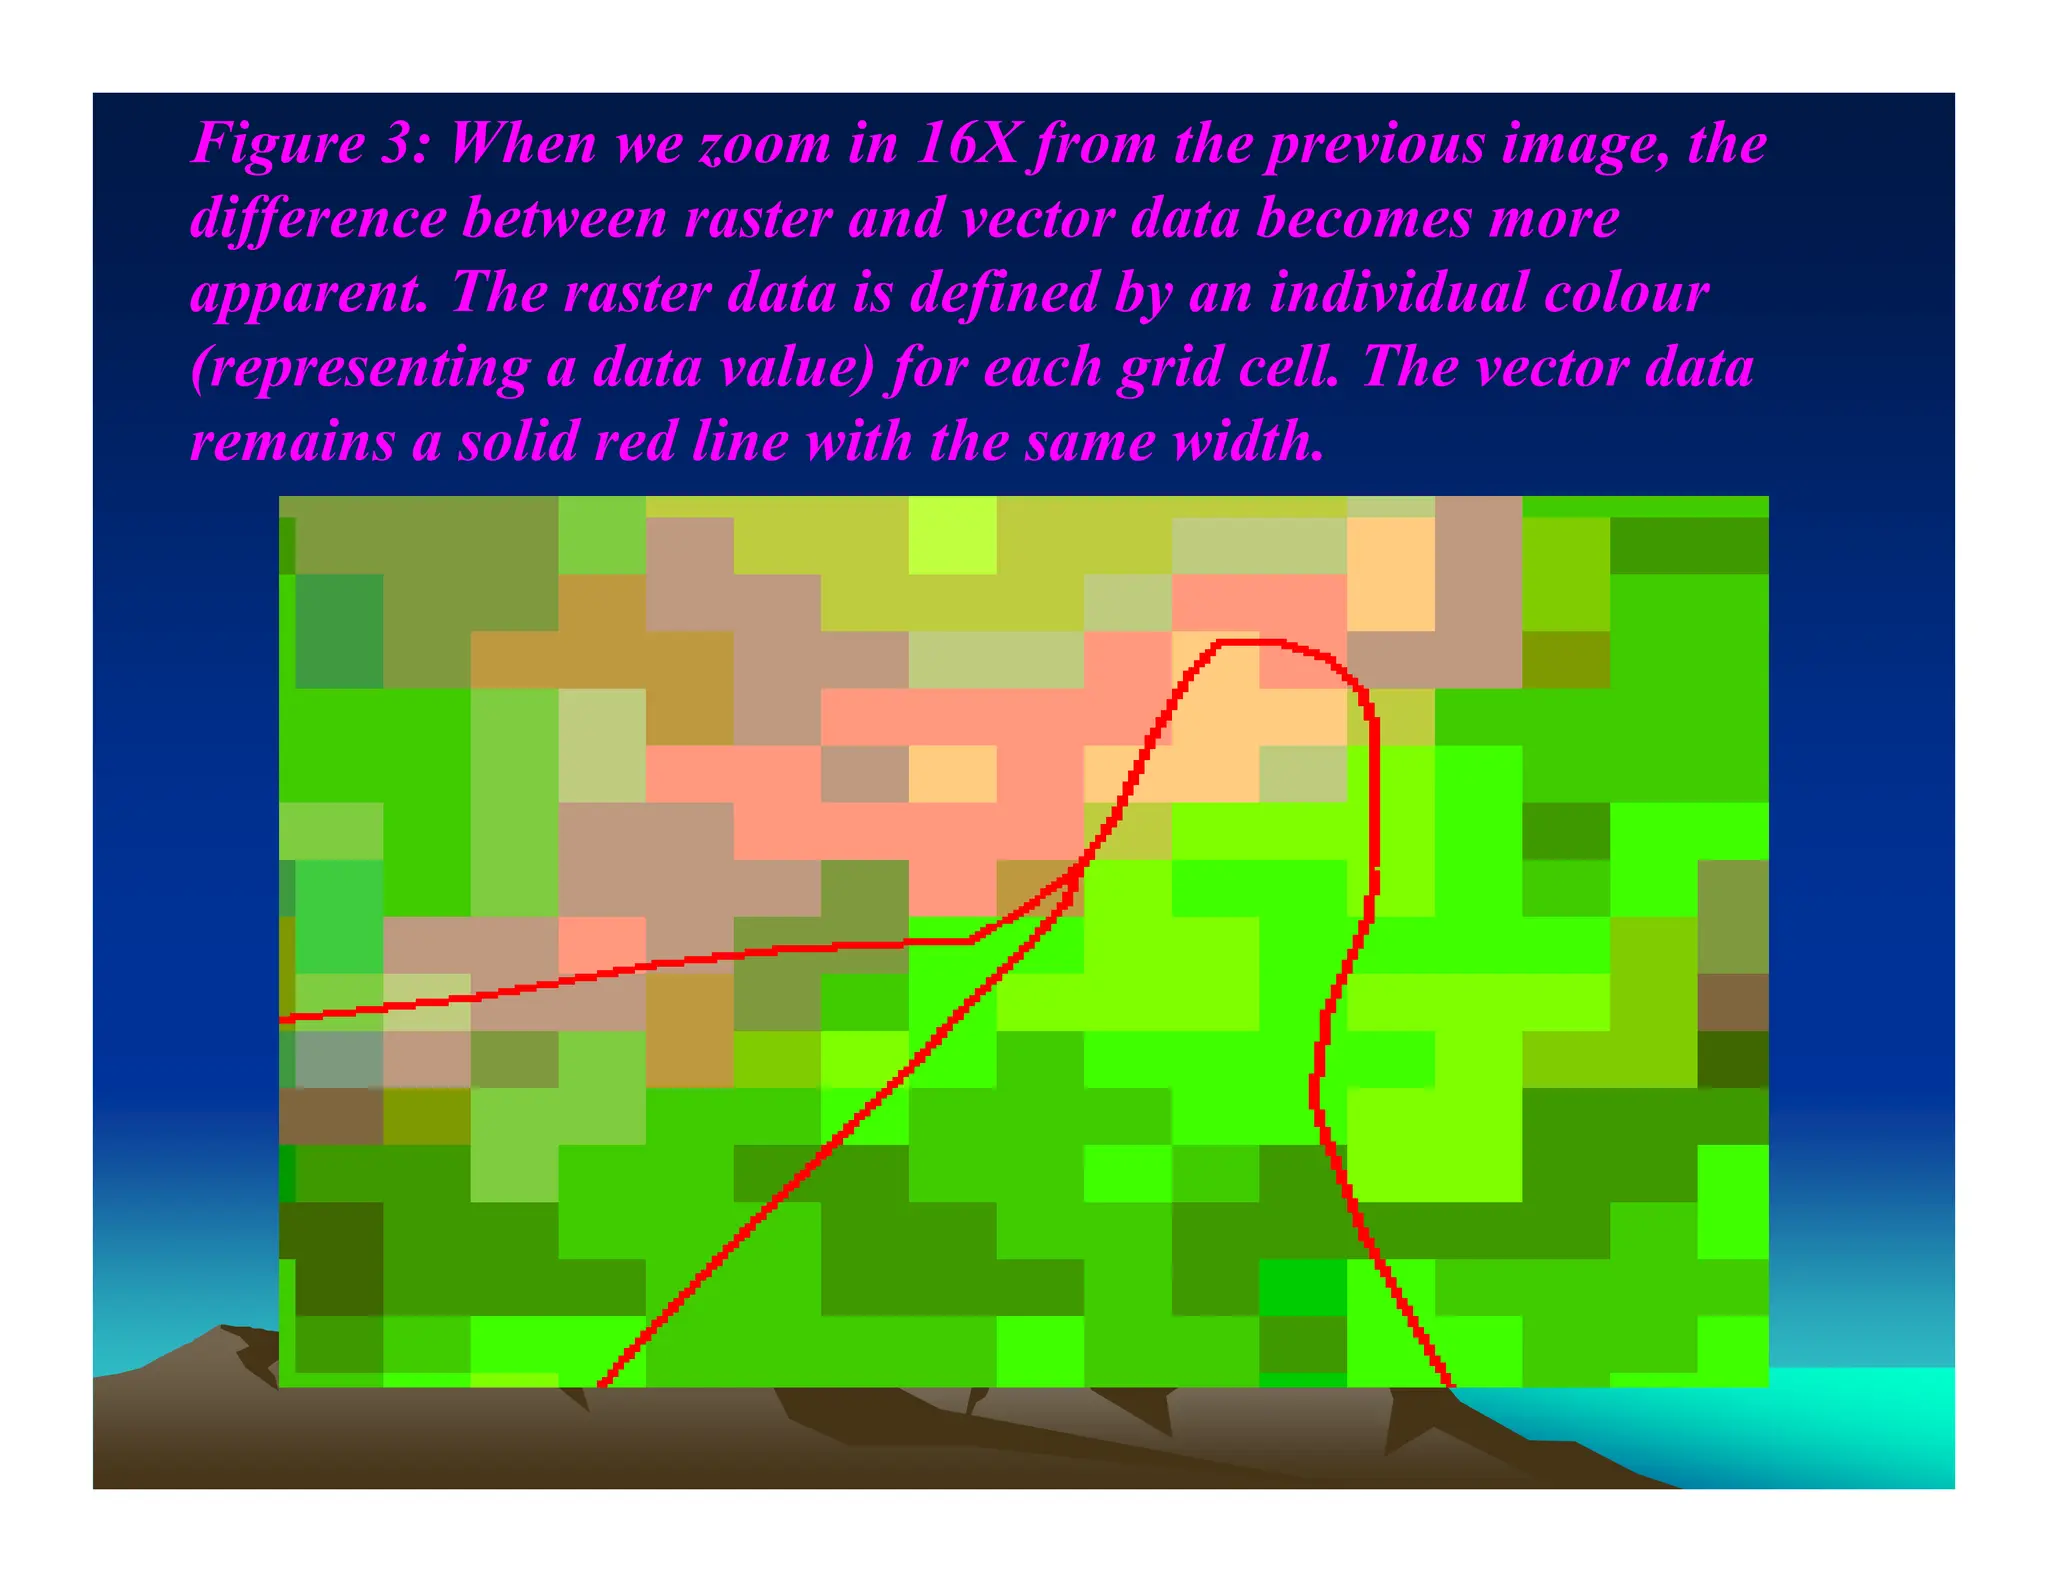
Figure 3: Whenwe zoom in 16X from the previous image, the
difference between raster and vector data becomes more
apparent. The raster data is defined by an individual colour
(representing a data value) for each grid cell. The vector data
remains a solid red line with the same width.
19.
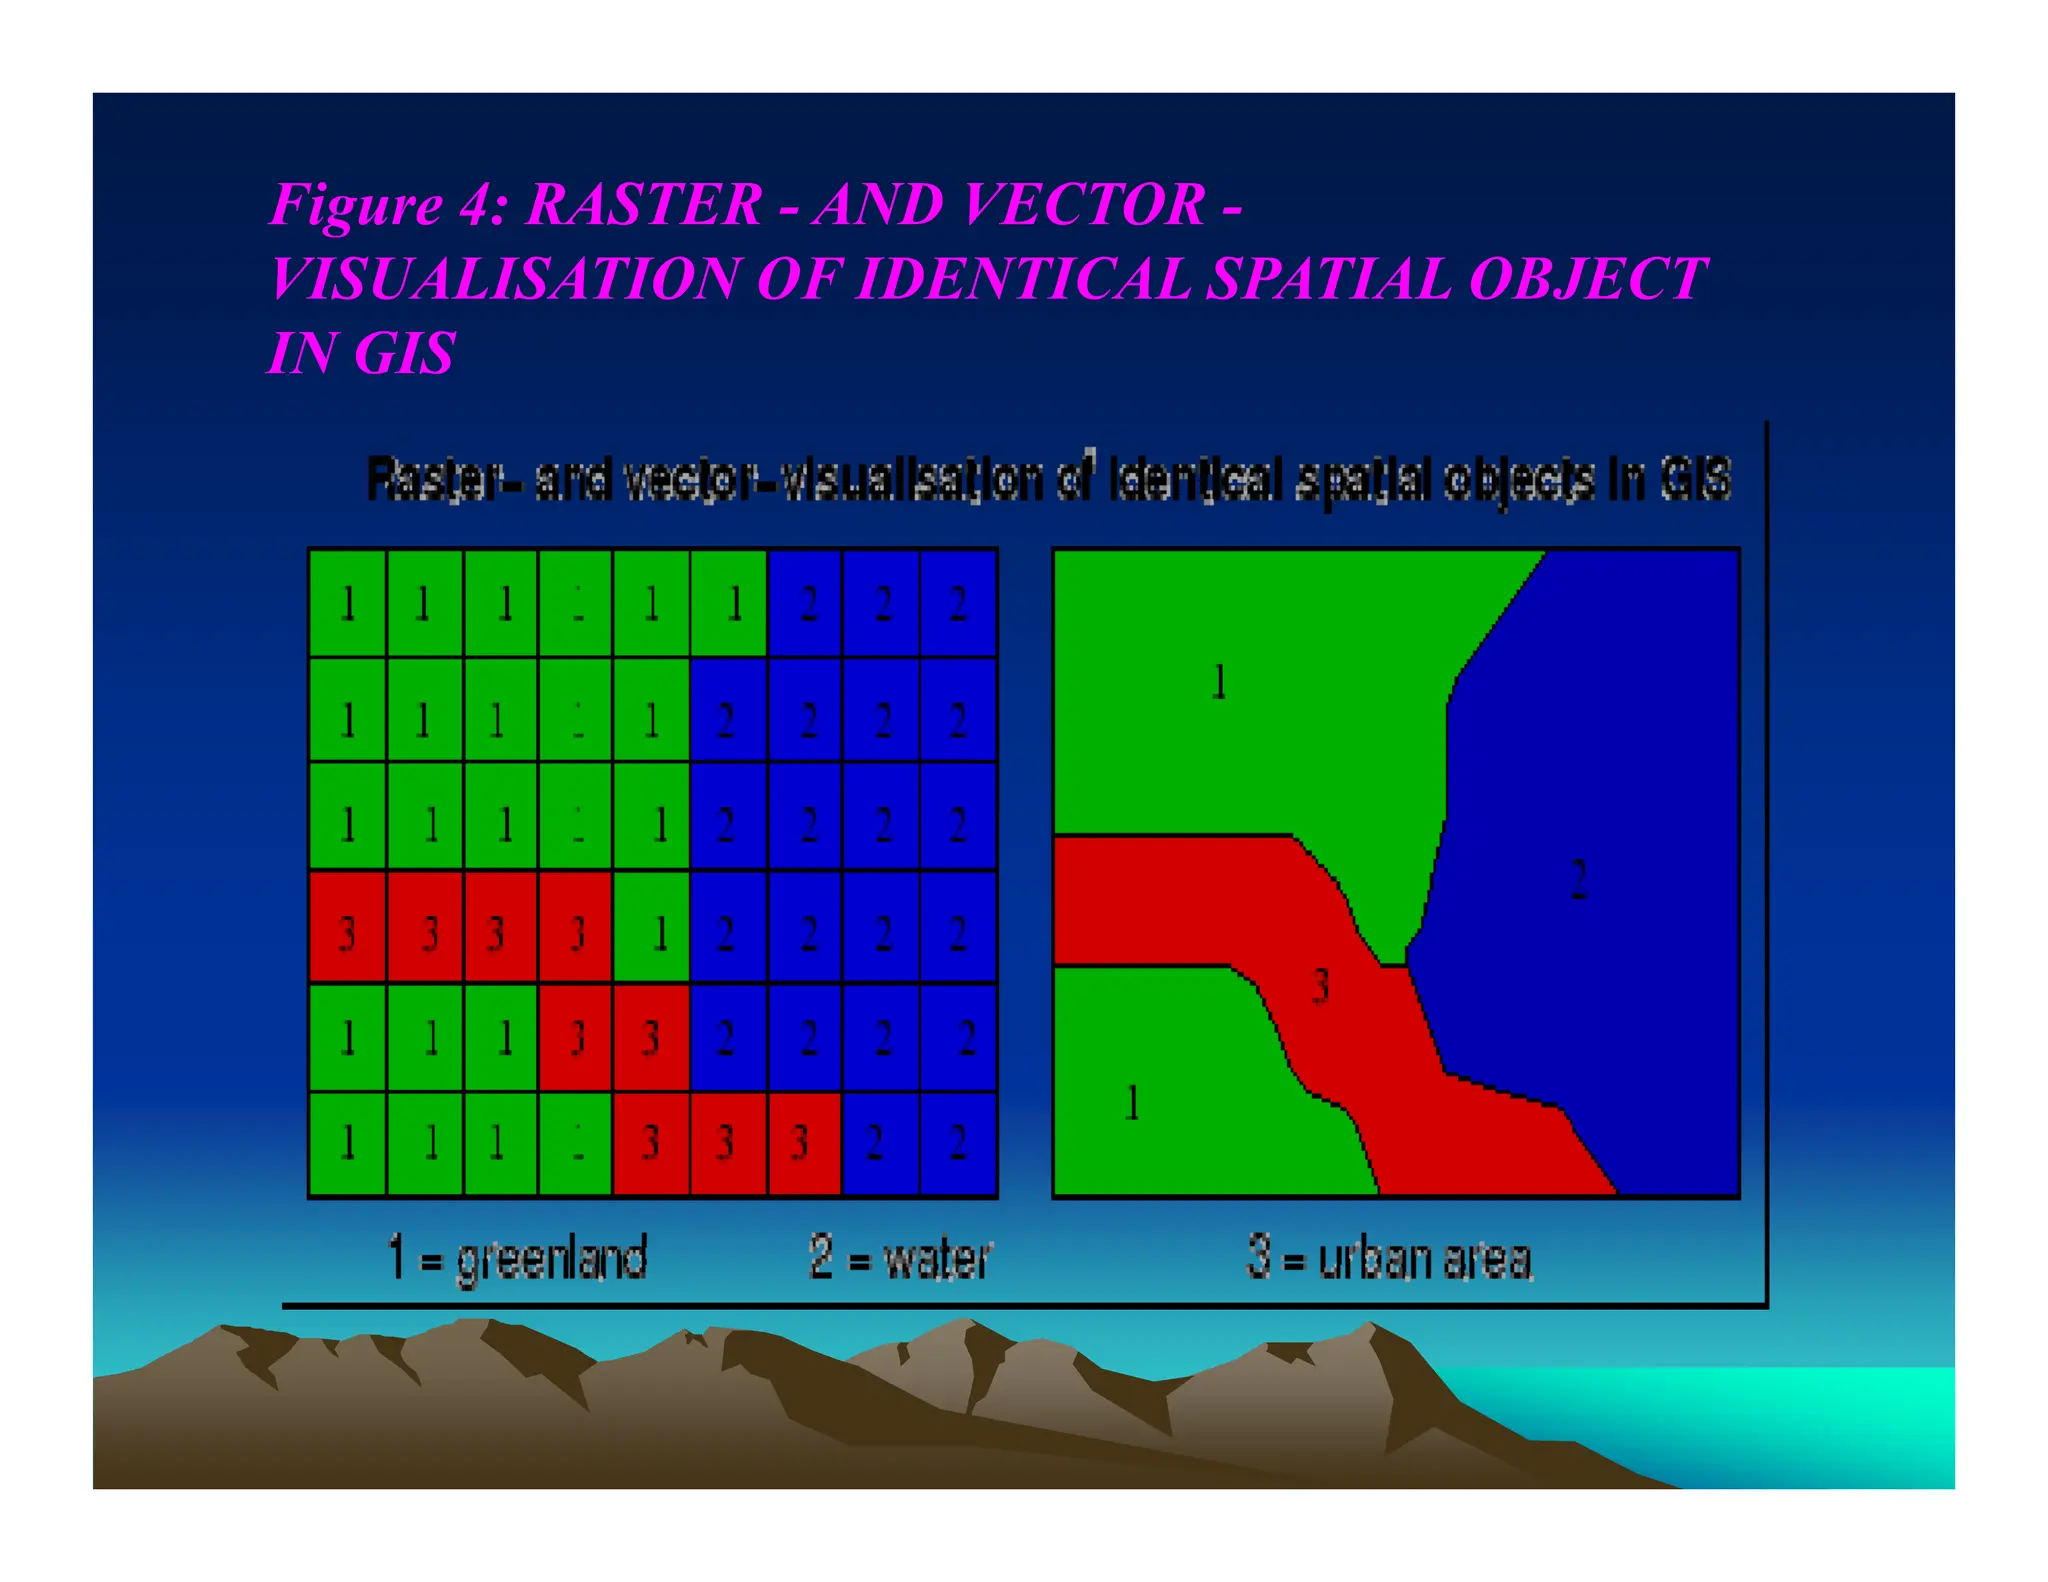
Figure 4: RASTER- AND VECTOR -
VISUALISATION OF IDENTICAL SPATIAL OBJECT
IN GIS
20.
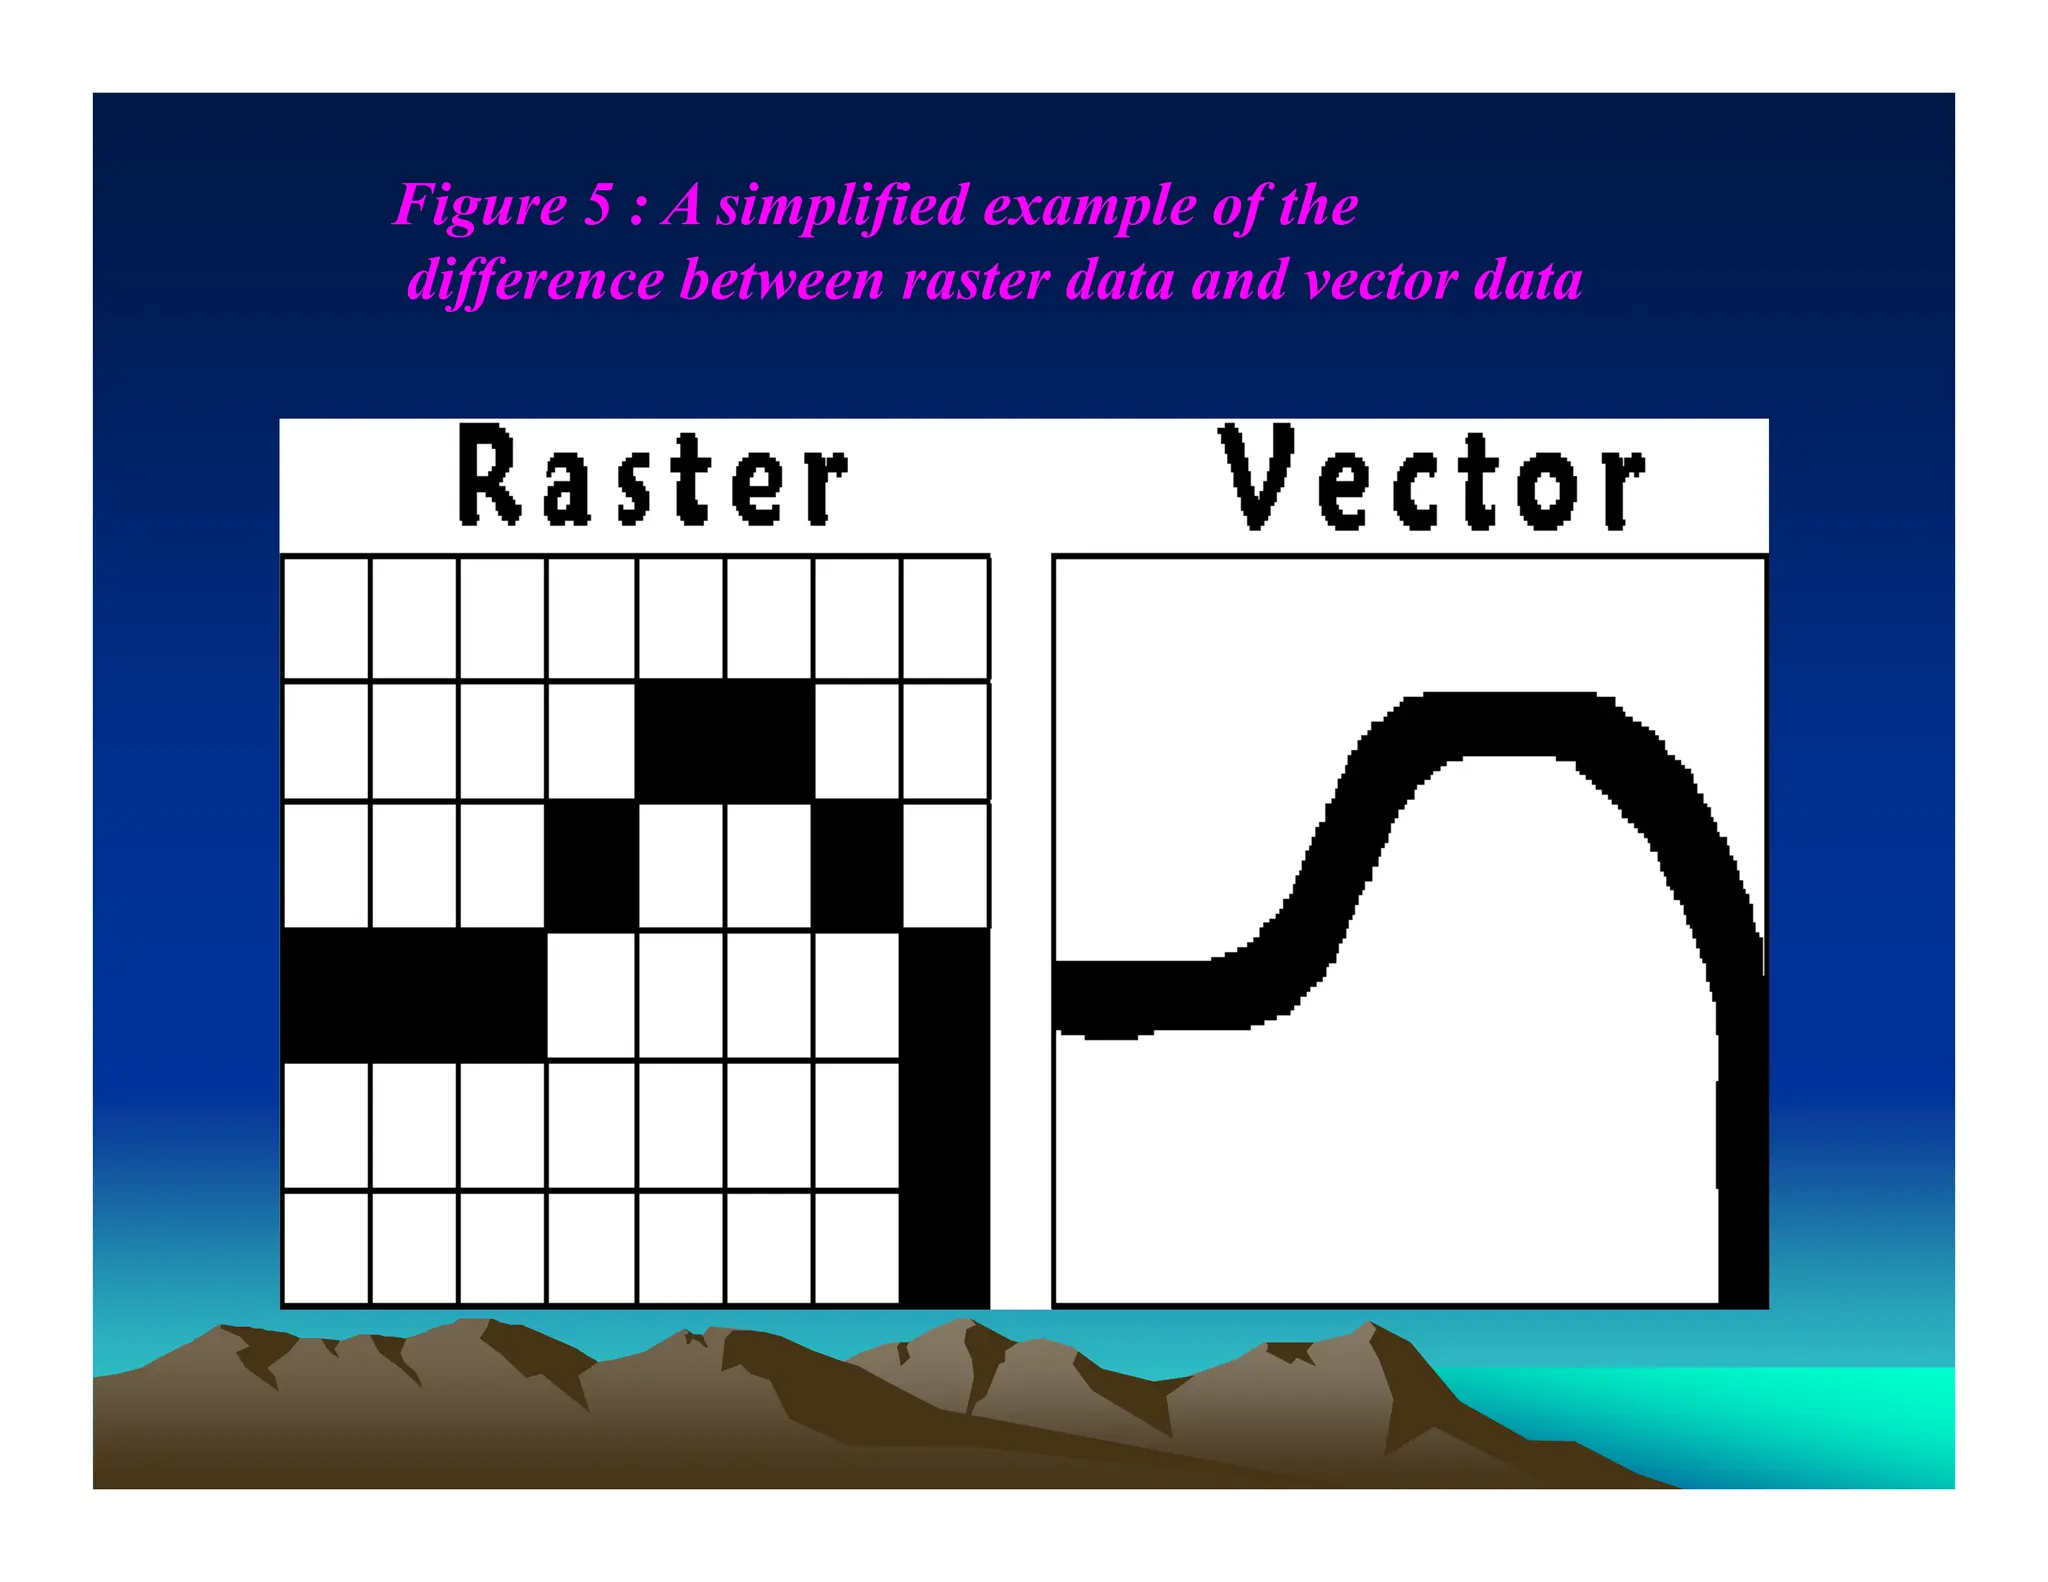
Figure 5 :A simplified example of the
difference between raster data and vector data
21.
Examples of vectorand raster data
• Examples of vector data: DLGs (digital line
graphs), TIGER files (U.S census data)
• Examples of raster data: DRGs, Remotely
sensed data (imagery); DOQs (photos);
DEMs (grids)
22.
CONCLUSION
• Raster dataare data continuously spread in space,
which are structured in a measured matrix of usually
quadratic cells and cells with the same size. Each
cell gets an attribute (property, attribute date), which
represents an appropriate phenomenon.
• Vector data are used for the storage of line
information and/or for the storage of homogeneous
areas at closed lines (polygons). Each vector object
can be assigned with none, one or several attributes
(property).