Download to read offline
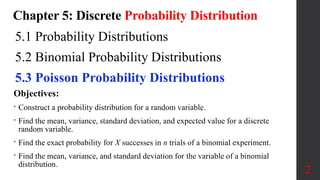
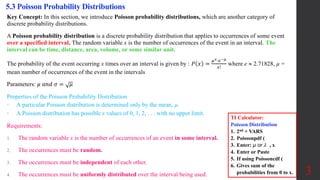
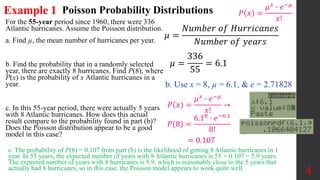
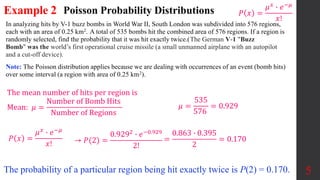
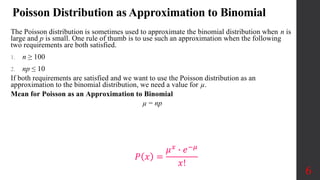
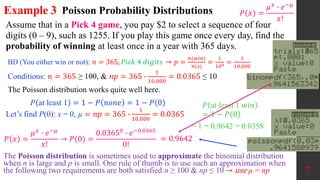

Chapter 5 focuses on discrete probability distributions, specifically the Poisson distribution, which describes the probability of events occurring within a specified interval. Key concepts include constructing probability distributions, calculating mean and variance, and determining probabilities for specific outcomes. The document provides examples and mathematical formulas to illustrate the application of Poisson distributions in real-world scenarios, emphasizing their utility in modeling random, independent events.


