Download to read offline

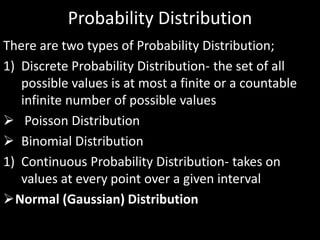
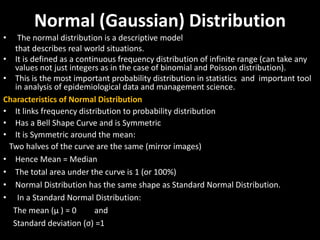
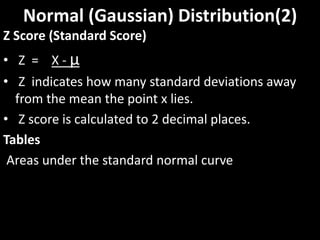
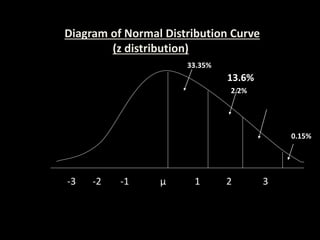
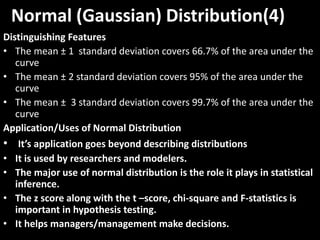
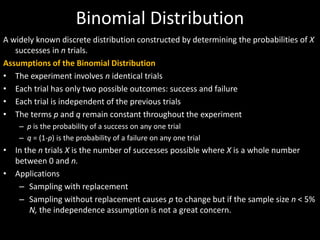
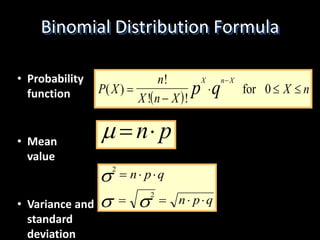


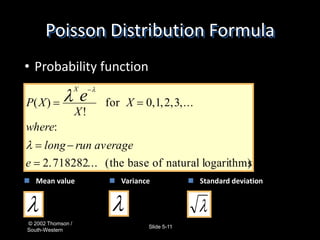

The document outlines two main types of probability distributions: discrete (e.g., binomial, Poisson) and continuous (e.g., normal distribution). It emphasizes the significance of the normal distribution in real-world situations and statistical inference, highlighting its characteristics such as symmetry and specific area coverage under the curve. Additionally, the document describes the binomial and Poisson distributions, detailing their assumptions and applications in various contexts.


