Download to read offline
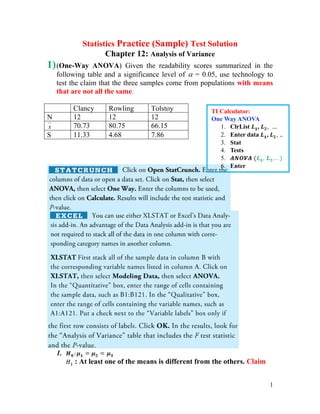

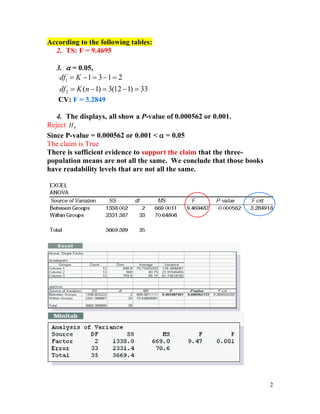

This document summarizes the solutions to three one-way ANOVA problems testing claims about population means. The first problem analyzes readability scores of three books and finds sufficient evidence to reject the claim that the means are all the same. The second problem examines tree weights under different treatments and fails to support the claim that all treatment means are equal. The third problem also looks at tree weights but in a different region, and finds sufficient evidence to fail to reject the claim that all treatment means are the same.