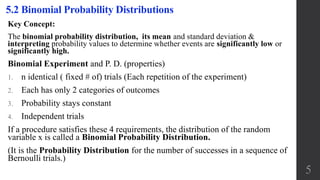
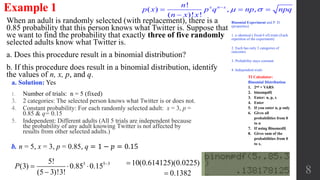
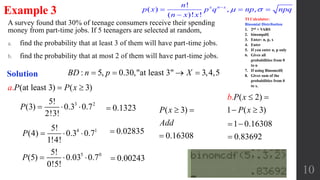
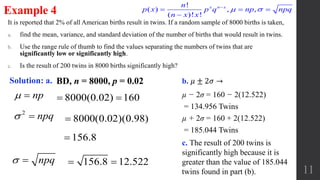
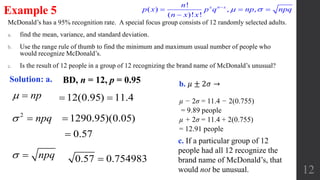
SlideShare a Scribd company logo
1 of 13
Elementary Statistics
Chapter 5:
Discrete Probability
Distribution
5.2 Binomial
Probability
Distributions
1
Chapter 5: Discrete Probability Distribution
5.1 Probability Distributions
5.2 Binomial Probability Distributions
2
Objectives:
• Construct a probability distribution for a random variable.
• Find the mean, variance, standard deviation, and expected value for a discrete
random variable.
• Find the exact probability for X successes in n trials of a binomial experiment.
• Find the mean, variance, and standard deviation for the variable of a binomial
distribution.
Key Concept: Random variable & Probability Distribution.
A probability histogram is a graph that visually depicts a probability distribution.
Find the important parameters of mean, standard deviation, and variance for a probability distribution.
Determine whether outcomes are significant (significantly low or significantly high).
Random Variable: A random variable is a variable (typically represented by x) that has a single
numerical value, determined by chance, for each outcome of a procedure.
Probability Distribution: A probability distribution is a description that gives the probability for each
value of the random variable. It is often expressed in the format of a table, formula, or graph. A discrete
probability distribution consists of the values a random variable can assume and the corresponding
probabilities of the values.
Discrete Random Variable (DRV): A discrete random variable has a collection of values that is finite
or countable. (If there are infinitely many values, the number of values is countable if it is possible to
count them individually, such as the number of tosses of a coin before getting heads.)
Continuous Random Variable: A continuous random variable has infinitely many values, and the
collection of values is not countable. (That is, it is impossible to count the individual items because at
least some of them are on a continuous scale, such as body temperatures.) 3
Recall: 5.1 Probability Distributions
Probability Distribution Requirements (3):
1. There is a numerical (not categorical) random variable (RV) x, and its values are
associated with corresponding probabilities.
2. ∑P(x) = 1 where x assumes all possible values. (The sum of all probabilities must be 1,
but sums such as 0.999 or 1.001 are acceptable because they result from rounding errors.)
3. 0 ≤ P(x) ≤ 1 for every individual value of the random variable x. (That is, each
probability value must be between 0 and 1 inclusive.)
4
Recall: 5.1 Probability Distributions
Mean: ( ) ( )E x x p x   
Parameters of a Probability Distribution
2 2 2
SD: ( ) ( ) ( )x p x x p x      
2 2 2 2
Variance: ( ) ( ) ( )x p x x p x         
Key Concept:
The binomial probability distribution, its mean and standard deviation &
interpreting probability values to determine whether events are significantly low or
significantly high.
Binomial Experiment and P. D. (properties)
1. n identical ( fixed # of) trials (Each repetition of the experiment)
2. Each has only 2 categories of outcomes
3. Probability stays constant
4. Independent trials
If a procedure satisfies these 4 requirements, the distribution of the random
variable x is called a Binomial Probability Distribution.
(It is the Probability Distribution for the number of successes in a sequence of
Bernoulli trials.)
5.2 Binomial Probability Distributions
5
p = probability of success, q = 1 − p = probability of failure
Make sure that the values of p and x refer to the same category called a success (x and p are consistent).
x: A specific number of successes in n trials: 0 ≤ 𝑥(𝑎 𝑤ℎ𝑜𝑙𝑒 #) ≤ 𝑛
P(x): probability of getting exactly x successes among the n trials
The word success as used here is arbitrary and does not necessarily represent something good. Either of the two
possible categories may be called the success S as long as its probability is identified as p.
Parameters: n & p
Binomial Coefficient (# of outcomes containing exactly x successes):
Each trial is known as a Bernoulli trial (named after Swiss mathematician Jacob Bernoulli).
Notes: If the probability of x success in n trials is less than 0.05, it is considered unusual.
5% Guideline for Cumbersome Calculations: When sampling without replacement and the sample size is no
more than 5% of the size of the population, treat the selections as being independent (even though they are
actually dependent).
Warning: If we toss a coin 1000 times, P (H=501), or any specific number of heads is very small, however, we
expect P (at least 501 heads) to be high.
5.2 Binomial Probability Distributions ( ) n x n x
xp x C p q 

n
xC
6
The Probability Histogram is Symmetric if: p = 0.5
The Probability Histogram is Right Skewed: p < 0.5
The Probability Histogram is Left Skewed: p > 0.5
In a binomial experiment, the probability of exactly X successes in n trials is
5.2 Binomial Probability Distributions
( )
(1 )
n x n x
xp x C p q
np
npq
np p






 
!
( )
( )! !
x n xn
P x p q
n x x

  

number of possible probability of a
desired outcomes desired outcome
or
( ) X n X
n xP x C p q 
  
7
2
Variance:  npq
Mean:  np
Standard Deviation:  npq
When an adult is randomly selected (with replacement), there is a
0.85 probability that this person knows what Twitter is. Suppose that
we want to find the probability that exactly three of five randomly
selected adults know what Twitter is.
a. Does this procedure result in a binomial distribution?
b. If this procedure does result in a binomial distribution, identify
the values of n, x, p, and q.
Example 1
a. Solution: Yes
1. Number of trials: n = 5 (fixed)
3. 2 categories: The selected person knows what Twitter is or does not.
4. Constant probability: For each randomly selected adult: x = 3, p =
0.85 & q= 0.15
5. Independent: Different adults (All 5 trials are independent because
the probability of any adult knowing Twitter is not affected by
results from other selected adults.)
8
Binomial Experiment and P. D.
(properties)
1. n identical ( fixed # of) trials (Each
repetition of the experiment)
2. Each has only 2 categories of
outcomes
3. Probability stays constant
4. Independent trials
!
( ) , ,
( )! !
x n xn
p x p q np npq
n x x
 
  

b. n = 5, x = 3, p = 0.85, q = 1 − 𝑝 = 0.15
3 5 35!
(3) 0.85 0.15
(5 3)!3!
P 
  

10(0.614125)(0.0225)
0.1382
TI Calculator:
Binomial Distribution
1. 2nd + VARS
2. binompdf(
3. Enter: n, p, x
4. Enter
5. If you enter n, p only
6. Gives all
probabilities from 0
to n
7. If using Binomcdf(
8. Gives sum of the
probabilities from 0
to x.
Assume one out of five people has visited a doctor in any given month. If 10
people are selected at random,
a. find the probability that exactly 3 have visited a doctor last month.
b. find the probability that at most 2 have visited a doctor last month. (at Home)
c. find the probability that at least 3 have visited a doctor last month. (at Home)
9
Example 2
Solution
1
5: 10, , 3BD n p x  
3 7
10! 1 4
(3)
7!3! 5 5
P
   
    
   
0.20133
!
( )
( )! !
x n xn
P x p q
n x x

  

1010!
( ) (1/5) (4/5)
!(10 )!
x x
P x
x x

  

q = 1 − 𝑝 =
4
5
!
( ) , ,
( )! !
x n xn
p x p q np npq
n x x
 
  

TI Calculator:
Binomial Distribution
1. 2nd + VARS
2. binompdf(
3. Enter: n, p, x
4. Enter
5. If you enter n, p only
6. Gives all
probabilities from 0
to n
7. If using Binomcdf(
8. Gives sum of the
probabilities from 0
to x.
A survey found that 30% of teenage consumers receive their spending
money from part-time jobs. If 5 teenagers are selected at random,
a. find the probability that at least 3 of them will have part-time jobs.
b. find the probability that at most 2 of them will have part-time jobs.
10
Example 3
Solution : 5, 0.30,"at least 3" 3,4,5BD n p X   
3 25!
(3) 0.3 0.7
2!3!
P   
4 15!
(4) 0.3 0.7
1!4!
P   
0.1323 ( 3)
0.16308
P x
Add
 

0.02835
5 05!
(5) 0.03 0.7
0!5!
P    0.00243
(at least 3) ). ( 3a P P x 
( 2)
1 ( )
.
3
b P x
P x
 
 
1 0.16308
0.83692
 

!
( ) , ,
( )! !
x n xn
p x p q np npq
n x x
 
  

TI Calculator:
Binomial Distribution
1. 2nd + VARS
2. binompdf(
3. Enter: n, p, x
4. Enter
5. If you enter n, p only
6. Gives all
probabilities from 0
to n
7. If using Binomcdf(
8. Gives sum of the
probabilities from 0
to x.
It is reported that 2% of all American births result in twins. If a random sample of 8000 births is taken,
a. find the mean, variance, and standard deviation of the number of births that would result in twins.
b. Use the range rule of thumb to find the values separating the numbers of twins that are
significantly low or significantly high.
c. Is the result of 200 twins in 8000 births significantly high?
11
Example 4
BD, n = 8000, p = 0.02Solution: a.
np 
2
npq 
npq 
8000(0.02) 160 
8000(0.02)(0.98)
156.8 12.522 
156.8
b. 𝜇 ± 2𝜎 →
c. The result of 200 twins is
significantly high because it is
greater than the value of 185.044
twins found in part (b).
!
( ) , ,
( )! !
x n xn
p x p q np npq
n x x
 
  

µ − 2σ = 160 − 2(12.522)
= 134.956 Twins
µ + 2σ = 160 + 2(12.522)
= 185.044 Twins
McDonald’s has a 95% recognition rate. A special focus group consists of 12 randomly selected adults.
a. find the mean, variance, and standard deviation.
b. Use the range rule of thumb to find the minimum and maximum usual number of people who
would recognize McDonald’s.
c. Is the result of 12 people in a group of 12 recognizing the brand name of McDonald’s unusual?
12
Example 5
Solution: a.
np 
2
npq 
npq 
12(0.95) 11.4 
1290.95)(0.05)
0.57 0.754983
0.57
µ − 2σ = 11.4 − 2(0.755)
= 9.89 people
µ + 2σ = 11.4 + 2(0.755)
= 12.91 people
c. If a particular group of 12
people had all 12 recognize the
brand name of McDonald’s, that
would not be unusual.
BD, n = 12, p = 0.95
!
( ) , ,
( )! !
x n xn
p x p q np npq
n x x
 
  

b. 𝜇 ± 2𝜎 →
Range Rule of Thumb
Significantly low values ≤ (µ − 2σ)
Significantly high values ≥ (µ + 2σ)
Values not significant: Between (µ − 2σ) and (µ + 2σ)
13

More Related Content

What's hot

Statistical inference
Statistical inferenceStatistical inference
Statistical inferenceJags Jagdish
 
Binomial distribution
Binomial distributionBinomial distribution
Binomial distributionSonamWadhwa3
 
Point and Interval Estimation
Point and Interval EstimationPoint and Interval Estimation
Point and Interval EstimationShubham Mehta
 
Discrete probability distribution (complete)
Discrete probability distribution (complete)Discrete probability distribution (complete)
Discrete probability distribution (complete)ISYousafzai
 
Binomial probability distributions ppt
Binomial probability distributions pptBinomial probability distributions ppt
Binomial probability distributions pptTayab Ali
 
Chap06 sampling and sampling distributions
Chap06 sampling and sampling distributionsChap06 sampling and sampling distributions
Chap06 sampling and sampling distributionsJudianto Nugroho
 
Normal and standard normal distribution
Normal and standard normal distributionNormal and standard normal distribution
Normal and standard normal distributionAvjinder (Avi) Kaler
 
Hypergeometric probability distribution
Hypergeometric probability distributionHypergeometric probability distribution
Hypergeometric probability distributionNadeem Uddin
 
Negative binomial distribution
Negative binomial distributionNegative binomial distribution
Negative binomial distributionNadeem Uddin
 
Normal Probabilty Distribution and its Problems
Normal Probabilty Distribution and its ProblemsNormal Probabilty Distribution and its Problems
Normal Probabilty Distribution and its ProblemsAli Raza
 
Normal Distribution – Introduction and Properties
Normal Distribution – Introduction and PropertiesNormal Distribution – Introduction and Properties
Normal Distribution – Introduction and PropertiesSundar B N
 
Discrete probability distributions
Discrete probability distributionsDiscrete probability distributions
Discrete probability distributionsNadeem Uddin
 
Discrete Probability Distributions
Discrete Probability DistributionsDiscrete Probability Distributions
Discrete Probability Distributionsmandalina landy
 
Discrete and continuous probability distributions ppt @ bec doms
Discrete and continuous probability distributions ppt @ bec domsDiscrete and continuous probability distributions ppt @ bec doms
Discrete and continuous probability distributions ppt @ bec domsBabasab Patil
 

What's hot (20)

Statistical inference
Statistical inferenceStatistical inference
Statistical inference
 
Basic concepts of probability
Basic concepts of probabilityBasic concepts of probability
Basic concepts of probability
 
Binomial distribution
Binomial distributionBinomial distribution
Binomial distribution
 
Binomial distribution
Binomial distributionBinomial distribution
Binomial distribution
 
Point and Interval Estimation
Point and Interval EstimationPoint and Interval Estimation
Point and Interval Estimation
 
Discrete probability distribution (complete)
Discrete probability distribution (complete)Discrete probability distribution (complete)
Discrete probability distribution (complete)
 
Binomial probability distributions ppt
Binomial probability distributions pptBinomial probability distributions ppt
Binomial probability distributions ppt
 
Chap06 sampling and sampling distributions
Chap06 sampling and sampling distributionsChap06 sampling and sampling distributions
Chap06 sampling and sampling distributions
 
Normal and standard normal distribution
Normal and standard normal distributionNormal and standard normal distribution
Normal and standard normal distribution
 
Hypergeometric probability distribution
Hypergeometric probability distributionHypergeometric probability distribution
Hypergeometric probability distribution
 
Negative binomial distribution
Negative binomial distributionNegative binomial distribution
Negative binomial distribution
 
Bernoulli distribution
Bernoulli distributionBernoulli distribution
Bernoulli distribution
 
Normal Probabilty Distribution and its Problems
Normal Probabilty Distribution and its ProblemsNormal Probabilty Distribution and its Problems
Normal Probabilty Distribution and its Problems
 
Normal Distribution – Introduction and Properties
Normal Distribution – Introduction and PropertiesNormal Distribution – Introduction and Properties
Normal Distribution – Introduction and Properties
 
Discrete probability distributions
Discrete probability distributionsDiscrete probability distributions
Discrete probability distributions
 
Discrete Probability Distributions
Discrete Probability DistributionsDiscrete Probability Distributions
Discrete Probability Distributions
 
Probability Distribution
Probability DistributionProbability Distribution
Probability Distribution
 
The Central Limit Theorem
The Central Limit TheoremThe Central Limit Theorem
The Central Limit Theorem
 
Binomial distribution
Binomial distributionBinomial distribution
Binomial distribution
 
Discrete and continuous probability distributions ppt @ bec doms
Discrete and continuous probability distributions ppt @ bec domsDiscrete and continuous probability distributions ppt @ bec doms
Discrete and continuous probability distributions ppt @ bec doms
 

Similar to Binomial probability distributions

Statistical computing2
Statistical computing2Statistical computing2
Statistical computing2Padma Metta
 
Statistik Chapter 5 (1)
Statistik Chapter 5 (1)Statistik Chapter 5 (1)
Statistik Chapter 5 (1)WanBK Leo
 
discrete and continuous probability distributions pptbecdoms-120223034321-php...
discrete and continuous probability distributions pptbecdoms-120223034321-php...discrete and continuous probability distributions pptbecdoms-120223034321-php...
discrete and continuous probability distributions pptbecdoms-120223034321-php...novrain1
 
Module 5 Lecture Notes
Module 5 Lecture NotesModule 5 Lecture Notes
Module 5 Lecture NotesLumen Learning
 
Sqqs1013 ch5-a122
Sqqs1013 ch5-a122Sqqs1013 ch5-a122
Sqqs1013 ch5-a122kim rae KI
 
Statistik Chapter 5
Statistik Chapter 5Statistik Chapter 5
Statistik Chapter 5WanBK Leo
 
2 Review of Statistics. 2 Review of Statistics.
2 Review of Statistics. 2 Review of Statistics.2 Review of Statistics. 2 Review of Statistics.
2 Review of Statistics. 2 Review of Statistics.WeihanKhor2
 
5-Propability-2-87.pdf
5-Propability-2-87.pdf5-Propability-2-87.pdf
5-Propability-2-87.pdfelenashahriari
 
04 random-variables-probability-distributionsrv
04 random-variables-probability-distributionsrv04 random-variables-probability-distributionsrv
04 random-variables-probability-distributionsrvPooja Sakhla
 
Binomial and Poission Probablity distribution
Binomial and Poission Probablity distributionBinomial and Poission Probablity distribution
Binomial and Poission Probablity distributionPrateek Singla
 
raghu veera stats.ppt
raghu veera stats.pptraghu veera stats.ppt
raghu veera stats.pptDevarajuBn
 
Descriptive Statistics Formula Sheet Sample Populatio.docx
Descriptive Statistics Formula Sheet    Sample Populatio.docxDescriptive Statistics Formula Sheet    Sample Populatio.docx
Descriptive Statistics Formula Sheet Sample Populatio.docxsimonithomas47935
 
Binomial distribution for mathematics pre u
Binomial distribution for mathematics pre uBinomial distribution for mathematics pre u
Binomial distribution for mathematics pre uDanielMukhriz2
 
Biostatistics-Week 6.pptx_ Binominal Distribution
Biostatistics-Week 6.pptx_ Binominal DistributionBiostatistics-Week 6.pptx_ Binominal Distribution
Biostatistics-Week 6.pptx_ Binominal DistributionMahmudHasan154
 
Probability and Statistics : Binomial Distribution notes ppt.pdf
Probability and Statistics : Binomial Distribution notes ppt.pdfProbability and Statistics : Binomial Distribution notes ppt.pdf
Probability and Statistics : Binomial Distribution notes ppt.pdfnomovi6416
 
Probability Distributions.pdf
Probability Distributions.pdfProbability Distributions.pdf
Probability Distributions.pdfShivakumar B N
 

Similar to Binomial probability distributions (20)

Binomial Probability Distributions
Binomial Probability DistributionsBinomial Probability Distributions
Binomial Probability Distributions
 
Normal as Approximation to Binomial
Normal as Approximation to Binomial  Normal as Approximation to Binomial
Normal as Approximation to Binomial
 
Statistical computing2
Statistical computing2Statistical computing2
Statistical computing2
 
Statistik Chapter 5 (1)
Statistik Chapter 5 (1)Statistik Chapter 5 (1)
Statistik Chapter 5 (1)
 
discrete and continuous probability distributions pptbecdoms-120223034321-php...
discrete and continuous probability distributions pptbecdoms-120223034321-php...discrete and continuous probability distributions pptbecdoms-120223034321-php...
discrete and continuous probability distributions pptbecdoms-120223034321-php...
 
Module 5 Lecture Notes
Module 5 Lecture NotesModule 5 Lecture Notes
Module 5 Lecture Notes
 
Sqqs1013 ch5-a122
Sqqs1013 ch5-a122Sqqs1013 ch5-a122
Sqqs1013 ch5-a122
 
Chapter 5.pptx
Chapter 5.pptxChapter 5.pptx
Chapter 5.pptx
 
Statistik Chapter 5
Statistik Chapter 5Statistik Chapter 5
Statistik Chapter 5
 
2 Review of Statistics. 2 Review of Statistics.
2 Review of Statistics. 2 Review of Statistics.2 Review of Statistics. 2 Review of Statistics.
2 Review of Statistics. 2 Review of Statistics.
 
5-Propability-2-87.pdf
5-Propability-2-87.pdf5-Propability-2-87.pdf
5-Propability-2-87.pdf
 
04 random-variables-probability-distributionsrv
04 random-variables-probability-distributionsrv04 random-variables-probability-distributionsrv
04 random-variables-probability-distributionsrv
 
Binomial and Poission Probablity distribution
Binomial and Poission Probablity distributionBinomial and Poission Probablity distribution
Binomial and Poission Probablity distribution
 
raghu veera stats.ppt
raghu veera stats.pptraghu veera stats.ppt
raghu veera stats.ppt
 
Descriptive Statistics Formula Sheet Sample Populatio.docx
Descriptive Statistics Formula Sheet    Sample Populatio.docxDescriptive Statistics Formula Sheet    Sample Populatio.docx
Descriptive Statistics Formula Sheet Sample Populatio.docx
 
Discrete and Continuous Random Variables
Discrete and Continuous Random VariablesDiscrete and Continuous Random Variables
Discrete and Continuous Random Variables
 
Binomial distribution for mathematics pre u
Binomial distribution for mathematics pre uBinomial distribution for mathematics pre u
Binomial distribution for mathematics pre u
 
Biostatistics-Week 6.pptx_ Binominal Distribution
Biostatistics-Week 6.pptx_ Binominal DistributionBiostatistics-Week 6.pptx_ Binominal Distribution
Biostatistics-Week 6.pptx_ Binominal Distribution
 
Probability and Statistics : Binomial Distribution notes ppt.pdf
Probability and Statistics : Binomial Distribution notes ppt.pdfProbability and Statistics : Binomial Distribution notes ppt.pdf
Probability and Statistics : Binomial Distribution notes ppt.pdf
 
Probability Distributions.pdf
Probability Distributions.pdfProbability Distributions.pdf
Probability Distributions.pdf
 

More from Long Beach City College

Practice test ch 9 inferences from two samples
Practice test ch 9 inferences from two samplesPractice test ch 9 inferences from two samples
Practice test ch 9 inferences from two samplesLong Beach City College
 
Solution to the practice test ch 10 correlation reg ch 11 gof ch12 anova
Solution to the practice test ch 10 correlation reg ch 11 gof ch12 anovaSolution to the practice test ch 10 correlation reg ch 11 gof ch12 anova
Solution to the practice test ch 10 correlation reg ch 11 gof ch12 anovaLong Beach City College
 
Practice test ch 10 correlation reg ch 11 gof ch12 anova
Practice test ch 10 correlation reg ch 11 gof ch12 anovaPractice test ch 10 correlation reg ch 11 gof ch12 anova
Practice test ch 10 correlation reg ch 11 gof ch12 anovaLong Beach City College
 
Practice test ch 8 hypothesis testing ch 9 two populations
Practice test ch 8 hypothesis testing ch 9 two populationsPractice test ch 8 hypothesis testing ch 9 two populations
Practice test ch 8 hypothesis testing ch 9 two populationsLong Beach City College
 
Solution to the practice test ch 8 hypothesis testing ch 9 two populations
Solution to the practice test ch 8 hypothesis testing ch 9 two populationsSolution to the practice test ch 8 hypothesis testing ch 9 two populations
Solution to the practice test ch 8 hypothesis testing ch 9 two populationsLong Beach City College
 
Solution to the Practice Test 3A, Chapter 6 Normal Probability Distribution
Solution to the Practice Test 3A, Chapter 6 Normal Probability DistributionSolution to the Practice Test 3A, Chapter 6 Normal Probability Distribution
Solution to the Practice Test 3A, Chapter 6 Normal Probability DistributionLong Beach City College
 
Practice Test Chapter 6 (Normal Probability Distributions)
Practice Test Chapter 6 (Normal Probability Distributions)Practice Test Chapter 6 (Normal Probability Distributions)
Practice Test Chapter 6 (Normal Probability Distributions)Long Beach City College
 

More from Long Beach City College (20)

Practice test ch 9 inferences from two samples
Practice test ch 9 inferences from two samplesPractice test ch 9 inferences from two samples
Practice test ch 9 inferences from two samples
 
Practice Test Ch 8 Hypothesis Testing
Practice Test Ch 8 Hypothesis TestingPractice Test Ch 8 Hypothesis Testing
Practice Test Ch 8 Hypothesis Testing
 
Solution to the practice test ch 10 correlation reg ch 11 gof ch12 anova
Solution to the practice test ch 10 correlation reg ch 11 gof ch12 anovaSolution to the practice test ch 10 correlation reg ch 11 gof ch12 anova
Solution to the practice test ch 10 correlation reg ch 11 gof ch12 anova
 
Practice test ch 10 correlation reg ch 11 gof ch12 anova
Practice test ch 10 correlation reg ch 11 gof ch12 anovaPractice test ch 10 correlation reg ch 11 gof ch12 anova
Practice test ch 10 correlation reg ch 11 gof ch12 anova
 
Practice test ch 8 hypothesis testing ch 9 two populations
Practice test ch 8 hypothesis testing ch 9 two populationsPractice test ch 8 hypothesis testing ch 9 two populations
Practice test ch 8 hypothesis testing ch 9 two populations
 
Solution to the practice test ch 8 hypothesis testing ch 9 two populations
Solution to the practice test ch 8 hypothesis testing ch 9 two populationsSolution to the practice test ch 8 hypothesis testing ch 9 two populations
Solution to the practice test ch 8 hypothesis testing ch 9 two populations
 
Solution to the Practice Test 3A, Chapter 6 Normal Probability Distribution
Solution to the Practice Test 3A, Chapter 6 Normal Probability DistributionSolution to the Practice Test 3A, Chapter 6 Normal Probability Distribution
Solution to the Practice Test 3A, Chapter 6 Normal Probability Distribution
 
Practice Test Chapter 6 (Normal Probability Distributions)
Practice Test Chapter 6 (Normal Probability Distributions)Practice Test Chapter 6 (Normal Probability Distributions)
Practice Test Chapter 6 (Normal Probability Distributions)
 
Practice Test 2 Solutions
Practice Test 2  SolutionsPractice Test 2  Solutions
Practice Test 2 Solutions
 
Practice Test 2 Probability
Practice Test 2 ProbabilityPractice Test 2 Probability
Practice Test 2 Probability
 
Practice Test 1 solutions
Practice Test 1 solutions  Practice Test 1 solutions
Practice Test 1 solutions
 
Practice Test 1
Practice Test 1Practice Test 1
Practice Test 1
 
Stat sample test ch 12 solution
Stat sample test ch 12 solutionStat sample test ch 12 solution
Stat sample test ch 12 solution
 
Stat sample test ch 12
Stat sample test ch 12Stat sample test ch 12
Stat sample test ch 12
 
Stat sample test ch 11
Stat sample test ch 11Stat sample test ch 11
Stat sample test ch 11
 
Stat sample test ch 10
Stat sample test ch 10Stat sample test ch 10
Stat sample test ch 10
 
Two-Way ANOVA
Two-Way ANOVATwo-Way ANOVA
Two-Way ANOVA
 
One-Way ANOVA
One-Way ANOVAOne-Way ANOVA
One-Way ANOVA
 
Contingency Tables
Contingency TablesContingency Tables
Contingency Tables
 
Goodness of Fit Notation
Goodness of Fit NotationGoodness of Fit Notation
Goodness of Fit Notation
 

Recently uploaded

REMIFENTANIL: An Ultra short acting opioid.pptx
REMIFENTANIL: An Ultra short acting opioid.pptxREMIFENTANIL: An Ultra short acting opioid.pptx
REMIFENTANIL: An Ultra short acting opioid.pptxDr. Ravikiran H M Gowda
 
Exploring_the_Narrative_Style_of_Amitav_Ghoshs_Gun_Island.pptx
Exploring_the_Narrative_Style_of_Amitav_Ghoshs_Gun_Island.pptxExploring_the_Narrative_Style_of_Amitav_Ghoshs_Gun_Island.pptx
Exploring_the_Narrative_Style_of_Amitav_Ghoshs_Gun_Island.pptxPooja Bhuva
 
What is 3 Way Matching Process in Odoo 17.pptx
What is 3 Way Matching Process in Odoo 17.pptxWhat is 3 Way Matching Process in Odoo 17.pptx
What is 3 Way Matching Process in Odoo 17.pptxCeline George
 
FSB Advising Checklist - Orientation 2024
FSB Advising Checklist - Orientation 2024FSB Advising Checklist - Orientation 2024
FSB Advising Checklist - Orientation 2024Elizabeth Walsh
 
Wellbeing inclusion and digital dystopias.pptx
Wellbeing inclusion and digital dystopias.pptxWellbeing inclusion and digital dystopias.pptx
Wellbeing inclusion and digital dystopias.pptxJisc
 
Python Notes for mca i year students osmania university.docx
Python Notes for mca i year students osmania university.docxPython Notes for mca i year students osmania university.docx
Python Notes for mca i year students osmania university.docxRamakrishna Reddy Bijjam
 
Tatlong Kwento ni Lola basyang-1.pdf arts
Tatlong Kwento ni Lola basyang-1.pdf artsTatlong Kwento ni Lola basyang-1.pdf arts
Tatlong Kwento ni Lola basyang-1.pdf artsNbelano25
 
Details on CBSE Compartment Exam.pptx1111
Details on CBSE Compartment Exam.pptx1111Details on CBSE Compartment Exam.pptx1111
Details on CBSE Compartment Exam.pptx1111GangaMaiya1
 
Introduction to TechSoup’s Digital Marketing Services and Use Cases
Introduction to TechSoup’s Digital Marketing  Services and Use CasesIntroduction to TechSoup’s Digital Marketing  Services and Use Cases
Introduction to TechSoup’s Digital Marketing Services and Use CasesTechSoup
 
Spellings Wk 4 and Wk 5 for Grade 4 at CAPS
Spellings Wk 4 and Wk 5 for Grade 4 at CAPSSpellings Wk 4 and Wk 5 for Grade 4 at CAPS
Spellings Wk 4 and Wk 5 for Grade 4 at CAPSAnaAcapella
 
HMCS Max Bernays Pre-Deployment Brief (May 2024).pptx
HMCS Max Bernays Pre-Deployment Brief (May 2024).pptxHMCS Max Bernays Pre-Deployment Brief (May 2024).pptx
HMCS Max Bernays Pre-Deployment Brief (May 2024).pptxEsquimalt MFRC
 
How to Add New Custom Addons Path in Odoo 17
How to Add New Custom Addons Path in Odoo 17How to Add New Custom Addons Path in Odoo 17
How to Add New Custom Addons Path in Odoo 17Celine George
 
How to Create and Manage Wizard in Odoo 17
How to Create and Manage Wizard in Odoo 17How to Create and Manage Wizard in Odoo 17
How to Create and Manage Wizard in Odoo 17Celine George
 
TỔNG ÔN TẬP THI VÀO LỚP 10 MÔN TIẾNG ANH NĂM HỌC 2023 - 2024 CÓ ĐÁP ÁN (NGỮ Â...
TỔNG ÔN TẬP THI VÀO LỚP 10 MÔN TIẾNG ANH NĂM HỌC 2023 - 2024 CÓ ĐÁP ÁN (NGỮ Â...TỔNG ÔN TẬP THI VÀO LỚP 10 MÔN TIẾNG ANH NĂM HỌC 2023 - 2024 CÓ ĐÁP ÁN (NGỮ Â...
TỔNG ÔN TẬP THI VÀO LỚP 10 MÔN TIẾNG ANH NĂM HỌC 2023 - 2024 CÓ ĐÁP ÁN (NGỮ Â...Nguyen Thanh Tu Collection
 
HMCS Vancouver Pre-Deployment Brief - May 2024 (Web Version).pptx
HMCS Vancouver Pre-Deployment Brief - May 2024 (Web Version).pptxHMCS Vancouver Pre-Deployment Brief - May 2024 (Web Version).pptx
HMCS Vancouver Pre-Deployment Brief - May 2024 (Web Version).pptxmarlenawright1
 
How to Manage Global Discount in Odoo 17 POS
How to Manage Global Discount in Odoo 17 POSHow to Manage Global Discount in Odoo 17 POS
How to Manage Global Discount in Odoo 17 POSCeline George
 
AIM of Education-Teachers Training-2024.ppt
AIM of Education-Teachers Training-2024.pptAIM of Education-Teachers Training-2024.ppt
AIM of Education-Teachers Training-2024.pptNishitharanjan Rout
 

Recently uploaded (20)

REMIFENTANIL: An Ultra short acting opioid.pptx
REMIFENTANIL: An Ultra short acting opioid.pptxREMIFENTANIL: An Ultra short acting opioid.pptx
REMIFENTANIL: An Ultra short acting opioid.pptx
 
Exploring_the_Narrative_Style_of_Amitav_Ghoshs_Gun_Island.pptx
Exploring_the_Narrative_Style_of_Amitav_Ghoshs_Gun_Island.pptxExploring_the_Narrative_Style_of_Amitav_Ghoshs_Gun_Island.pptx
Exploring_the_Narrative_Style_of_Amitav_Ghoshs_Gun_Island.pptx
 
What is 3 Way Matching Process in Odoo 17.pptx
What is 3 Way Matching Process in Odoo 17.pptxWhat is 3 Way Matching Process in Odoo 17.pptx
What is 3 Way Matching Process in Odoo 17.pptx
 
FSB Advising Checklist - Orientation 2024
FSB Advising Checklist - Orientation 2024FSB Advising Checklist - Orientation 2024
FSB Advising Checklist - Orientation 2024
 
VAMOS CUIDAR DO NOSSO PLANETA! .
VAMOS CUIDAR DO NOSSO PLANETA!                    .VAMOS CUIDAR DO NOSSO PLANETA!                    .
VAMOS CUIDAR DO NOSSO PLANETA! .
 
Wellbeing inclusion and digital dystopias.pptx
Wellbeing inclusion and digital dystopias.pptxWellbeing inclusion and digital dystopias.pptx
Wellbeing inclusion and digital dystopias.pptx
 
Python Notes for mca i year students osmania university.docx
Python Notes for mca i year students osmania university.docxPython Notes for mca i year students osmania university.docx
Python Notes for mca i year students osmania university.docx
 
OS-operating systems- ch05 (CPU Scheduling) ...
OS-operating systems- ch05 (CPU Scheduling) ...OS-operating systems- ch05 (CPU Scheduling) ...
OS-operating systems- ch05 (CPU Scheduling) ...
 
Tatlong Kwento ni Lola basyang-1.pdf arts
Tatlong Kwento ni Lola basyang-1.pdf artsTatlong Kwento ni Lola basyang-1.pdf arts
Tatlong Kwento ni Lola basyang-1.pdf arts
 
Details on CBSE Compartment Exam.pptx1111
Details on CBSE Compartment Exam.pptx1111Details on CBSE Compartment Exam.pptx1111
Details on CBSE Compartment Exam.pptx1111
 
Our Environment Class 10 Science Notes pdf
Our Environment Class 10 Science Notes pdfOur Environment Class 10 Science Notes pdf
Our Environment Class 10 Science Notes pdf
 
Introduction to TechSoup’s Digital Marketing Services and Use Cases
Introduction to TechSoup’s Digital Marketing  Services and Use CasesIntroduction to TechSoup’s Digital Marketing  Services and Use Cases
Introduction to TechSoup’s Digital Marketing Services and Use Cases
 
Spellings Wk 4 and Wk 5 for Grade 4 at CAPS
Spellings Wk 4 and Wk 5 for Grade 4 at CAPSSpellings Wk 4 and Wk 5 for Grade 4 at CAPS
Spellings Wk 4 and Wk 5 for Grade 4 at CAPS
 
HMCS Max Bernays Pre-Deployment Brief (May 2024).pptx
HMCS Max Bernays Pre-Deployment Brief (May 2024).pptxHMCS Max Bernays Pre-Deployment Brief (May 2024).pptx
HMCS Max Bernays Pre-Deployment Brief (May 2024).pptx
 
How to Add New Custom Addons Path in Odoo 17
How to Add New Custom Addons Path in Odoo 17How to Add New Custom Addons Path in Odoo 17
How to Add New Custom Addons Path in Odoo 17
 
How to Create and Manage Wizard in Odoo 17
How to Create and Manage Wizard in Odoo 17How to Create and Manage Wizard in Odoo 17
How to Create and Manage Wizard in Odoo 17
 
TỔNG ÔN TẬP THI VÀO LỚP 10 MÔN TIẾNG ANH NĂM HỌC 2023 - 2024 CÓ ĐÁP ÁN (NGỮ Â...
TỔNG ÔN TẬP THI VÀO LỚP 10 MÔN TIẾNG ANH NĂM HỌC 2023 - 2024 CÓ ĐÁP ÁN (NGỮ Â...TỔNG ÔN TẬP THI VÀO LỚP 10 MÔN TIẾNG ANH NĂM HỌC 2023 - 2024 CÓ ĐÁP ÁN (NGỮ Â...
TỔNG ÔN TẬP THI VÀO LỚP 10 MÔN TIẾNG ANH NĂM HỌC 2023 - 2024 CÓ ĐÁP ÁN (NGỮ Â...
 
HMCS Vancouver Pre-Deployment Brief - May 2024 (Web Version).pptx
HMCS Vancouver Pre-Deployment Brief - May 2024 (Web Version).pptxHMCS Vancouver Pre-Deployment Brief - May 2024 (Web Version).pptx
HMCS Vancouver Pre-Deployment Brief - May 2024 (Web Version).pptx
 
How to Manage Global Discount in Odoo 17 POS
How to Manage Global Discount in Odoo 17 POSHow to Manage Global Discount in Odoo 17 POS
How to Manage Global Discount in Odoo 17 POS
 
AIM of Education-Teachers Training-2024.ppt
AIM of Education-Teachers Training-2024.pptAIM of Education-Teachers Training-2024.ppt
AIM of Education-Teachers Training-2024.ppt
 

Binomial probability distributions

  • 1. Elementary Statistics Chapter 5: Discrete Probability Distribution 5.2 Binomial Probability Distributions 1
  • 2. Chapter 5: Discrete Probability Distribution 5.1 Probability Distributions 5.2 Binomial Probability Distributions 2 Objectives: • Construct a probability distribution for a random variable. • Find the mean, variance, standard deviation, and expected value for a discrete random variable. • Find the exact probability for X successes in n trials of a binomial experiment. • Find the mean, variance, and standard deviation for the variable of a binomial distribution.
  • 3. Key Concept: Random variable & Probability Distribution. A probability histogram is a graph that visually depicts a probability distribution. Find the important parameters of mean, standard deviation, and variance for a probability distribution. Determine whether outcomes are significant (significantly low or significantly high). Random Variable: A random variable is a variable (typically represented by x) that has a single numerical value, determined by chance, for each outcome of a procedure. Probability Distribution: A probability distribution is a description that gives the probability for each value of the random variable. It is often expressed in the format of a table, formula, or graph. A discrete probability distribution consists of the values a random variable can assume and the corresponding probabilities of the values. Discrete Random Variable (DRV): A discrete random variable has a collection of values that is finite or countable. (If there are infinitely many values, the number of values is countable if it is possible to count them individually, such as the number of tosses of a coin before getting heads.) Continuous Random Variable: A continuous random variable has infinitely many values, and the collection of values is not countable. (That is, it is impossible to count the individual items because at least some of them are on a continuous scale, such as body temperatures.) 3 Recall: 5.1 Probability Distributions
  • 4. Probability Distribution Requirements (3): 1. There is a numerical (not categorical) random variable (RV) x, and its values are associated with corresponding probabilities. 2. ∑P(x) = 1 where x assumes all possible values. (The sum of all probabilities must be 1, but sums such as 0.999 or 1.001 are acceptable because they result from rounding errors.) 3. 0 ≤ P(x) ≤ 1 for every individual value of the random variable x. (That is, each probability value must be between 0 and 1 inclusive.) 4 Recall: 5.1 Probability Distributions Mean: ( ) ( )E x x p x    Parameters of a Probability Distribution 2 2 2 SD: ( ) ( ) ( )x p x x p x       2 2 2 2 Variance: ( ) ( ) ( )x p x x p x         
  • 5. Key Concept: The binomial probability distribution, its mean and standard deviation & interpreting probability values to determine whether events are significantly low or significantly high. Binomial Experiment and P. D. (properties) 1. n identical ( fixed # of) trials (Each repetition of the experiment) 2. Each has only 2 categories of outcomes 3. Probability stays constant 4. Independent trials If a procedure satisfies these 4 requirements, the distribution of the random variable x is called a Binomial Probability Distribution. (It is the Probability Distribution for the number of successes in a sequence of Bernoulli trials.) 5.2 Binomial Probability Distributions 5
  • 6. p = probability of success, q = 1 − p = probability of failure Make sure that the values of p and x refer to the same category called a success (x and p are consistent). x: A specific number of successes in n trials: 0 ≤ 𝑥(𝑎 𝑤ℎ𝑜𝑙𝑒 #) ≤ 𝑛 P(x): probability of getting exactly x successes among the n trials The word success as used here is arbitrary and does not necessarily represent something good. Either of the two possible categories may be called the success S as long as its probability is identified as p. Parameters: n & p Binomial Coefficient (# of outcomes containing exactly x successes): Each trial is known as a Bernoulli trial (named after Swiss mathematician Jacob Bernoulli). Notes: If the probability of x success in n trials is less than 0.05, it is considered unusual. 5% Guideline for Cumbersome Calculations: When sampling without replacement and the sample size is no more than 5% of the size of the population, treat the selections as being independent (even though they are actually dependent). Warning: If we toss a coin 1000 times, P (H=501), or any specific number of heads is very small, however, we expect P (at least 501 heads) to be high. 5.2 Binomial Probability Distributions ( ) n x n x xp x C p q   n xC 6
  • 7. The Probability Histogram is Symmetric if: p = 0.5 The Probability Histogram is Right Skewed: p < 0.5 The Probability Histogram is Left Skewed: p > 0.5 In a binomial experiment, the probability of exactly X successes in n trials is 5.2 Binomial Probability Distributions ( ) (1 ) n x n x xp x C p q np npq np p         ! ( ) ( )! ! x n xn P x p q n x x      number of possible probability of a desired outcomes desired outcome or ( ) X n X n xP x C p q     7 2 Variance:  npq Mean:  np Standard Deviation:  npq
  • 8. When an adult is randomly selected (with replacement), there is a 0.85 probability that this person knows what Twitter is. Suppose that we want to find the probability that exactly three of five randomly selected adults know what Twitter is. a. Does this procedure result in a binomial distribution? b. If this procedure does result in a binomial distribution, identify the values of n, x, p, and q. Example 1 a. Solution: Yes 1. Number of trials: n = 5 (fixed) 3. 2 categories: The selected person knows what Twitter is or does not. 4. Constant probability: For each randomly selected adult: x = 3, p = 0.85 & q= 0.15 5. Independent: Different adults (All 5 trials are independent because the probability of any adult knowing Twitter is not affected by results from other selected adults.) 8 Binomial Experiment and P. D. (properties) 1. n identical ( fixed # of) trials (Each repetition of the experiment) 2. Each has only 2 categories of outcomes 3. Probability stays constant 4. Independent trials ! ( ) , , ( )! ! x n xn p x p q np npq n x x       b. n = 5, x = 3, p = 0.85, q = 1 − 𝑝 = 0.15 3 5 35! (3) 0.85 0.15 (5 3)!3! P      10(0.614125)(0.0225) 0.1382 TI Calculator: Binomial Distribution 1. 2nd + VARS 2. binompdf( 3. Enter: n, p, x 4. Enter 5. If you enter n, p only 6. Gives all probabilities from 0 to n 7. If using Binomcdf( 8. Gives sum of the probabilities from 0 to x.
  • 9. Assume one out of five people has visited a doctor in any given month. If 10 people are selected at random, a. find the probability that exactly 3 have visited a doctor last month. b. find the probability that at most 2 have visited a doctor last month. (at Home) c. find the probability that at least 3 have visited a doctor last month. (at Home) 9 Example 2 Solution 1 5: 10, , 3BD n p x   3 7 10! 1 4 (3) 7!3! 5 5 P              0.20133 ! ( ) ( )! ! x n xn P x p q n x x      1010! ( ) (1/5) (4/5) !(10 )! x x P x x x      q = 1 − 𝑝 = 4 5 ! ( ) , , ( )! ! x n xn p x p q np npq n x x       TI Calculator: Binomial Distribution 1. 2nd + VARS 2. binompdf( 3. Enter: n, p, x 4. Enter 5. If you enter n, p only 6. Gives all probabilities from 0 to n 7. If using Binomcdf( 8. Gives sum of the probabilities from 0 to x.
  • 10. A survey found that 30% of teenage consumers receive their spending money from part-time jobs. If 5 teenagers are selected at random, a. find the probability that at least 3 of them will have part-time jobs. b. find the probability that at most 2 of them will have part-time jobs. 10 Example 3 Solution : 5, 0.30,"at least 3" 3,4,5BD n p X    3 25! (3) 0.3 0.7 2!3! P    4 15! (4) 0.3 0.7 1!4! P    0.1323 ( 3) 0.16308 P x Add    0.02835 5 05! (5) 0.03 0.7 0!5! P    0.00243 (at least 3) ). ( 3a P P x  ( 2) 1 ( ) . 3 b P x P x     1 0.16308 0.83692    ! ( ) , , ( )! ! x n xn p x p q np npq n x x       TI Calculator: Binomial Distribution 1. 2nd + VARS 2. binompdf( 3. Enter: n, p, x 4. Enter 5. If you enter n, p only 6. Gives all probabilities from 0 to n 7. If using Binomcdf( 8. Gives sum of the probabilities from 0 to x.
  • 11. It is reported that 2% of all American births result in twins. If a random sample of 8000 births is taken, a. find the mean, variance, and standard deviation of the number of births that would result in twins. b. Use the range rule of thumb to find the values separating the numbers of twins that are significantly low or significantly high. c. Is the result of 200 twins in 8000 births significantly high? 11 Example 4 BD, n = 8000, p = 0.02Solution: a. np  2 npq  npq  8000(0.02) 160  8000(0.02)(0.98) 156.8 12.522  156.8 b. 𝜇 ± 2𝜎 → c. The result of 200 twins is significantly high because it is greater than the value of 185.044 twins found in part (b). ! ( ) , , ( )! ! x n xn p x p q np npq n x x       µ − 2σ = 160 − 2(12.522) = 134.956 Twins µ + 2σ = 160 + 2(12.522) = 185.044 Twins
  • 12. McDonald’s has a 95% recognition rate. A special focus group consists of 12 randomly selected adults. a. find the mean, variance, and standard deviation. b. Use the range rule of thumb to find the minimum and maximum usual number of people who would recognize McDonald’s. c. Is the result of 12 people in a group of 12 recognizing the brand name of McDonald’s unusual? 12 Example 5 Solution: a. np  2 npq  npq  12(0.95) 11.4  1290.95)(0.05) 0.57 0.754983 0.57 µ − 2σ = 11.4 − 2(0.755) = 9.89 people µ + 2σ = 11.4 + 2(0.755) = 12.91 people c. If a particular group of 12 people had all 12 recognize the brand name of McDonald’s, that would not be unusual. BD, n = 12, p = 0.95 ! ( ) , , ( )! ! x n xn p x p q np npq n x x       b. 𝜇 ± 2𝜎 →
  • 13. Range Rule of Thumb Significantly low values ≤ (µ − 2σ) Significantly high values ≥ (µ + 2σ) Values not significant: Between (µ − 2σ) and (µ + 2σ) 13