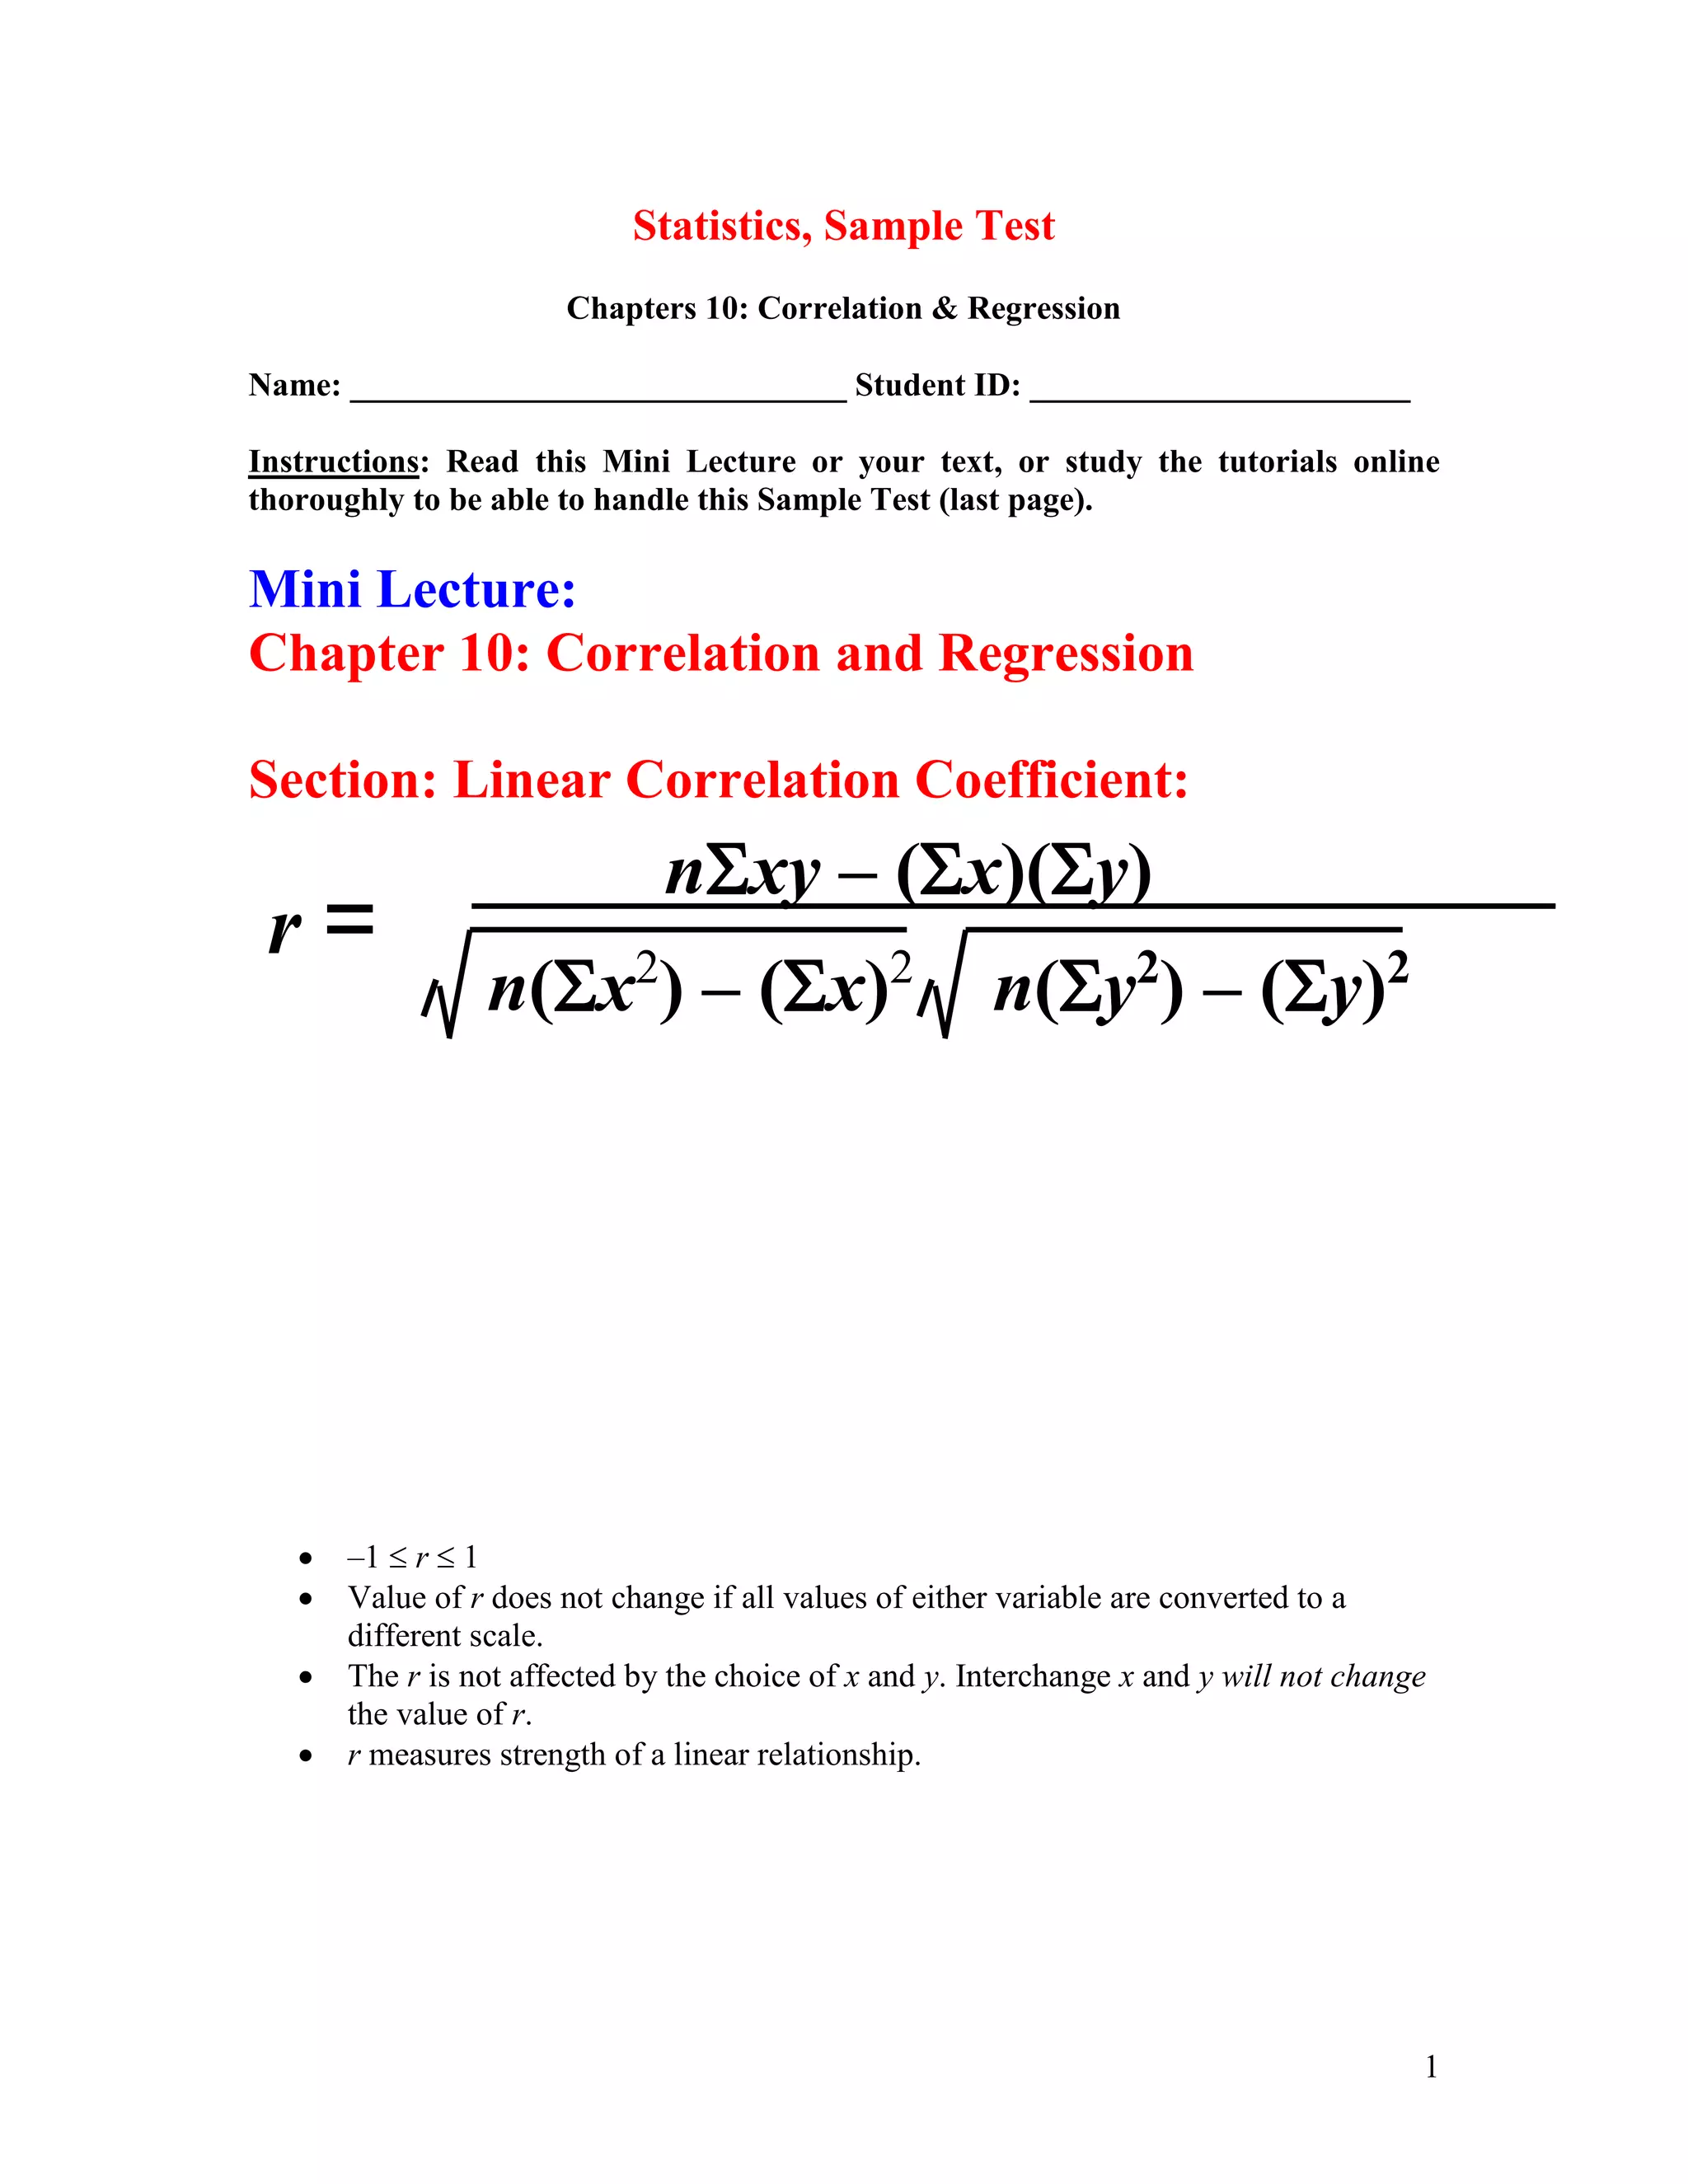
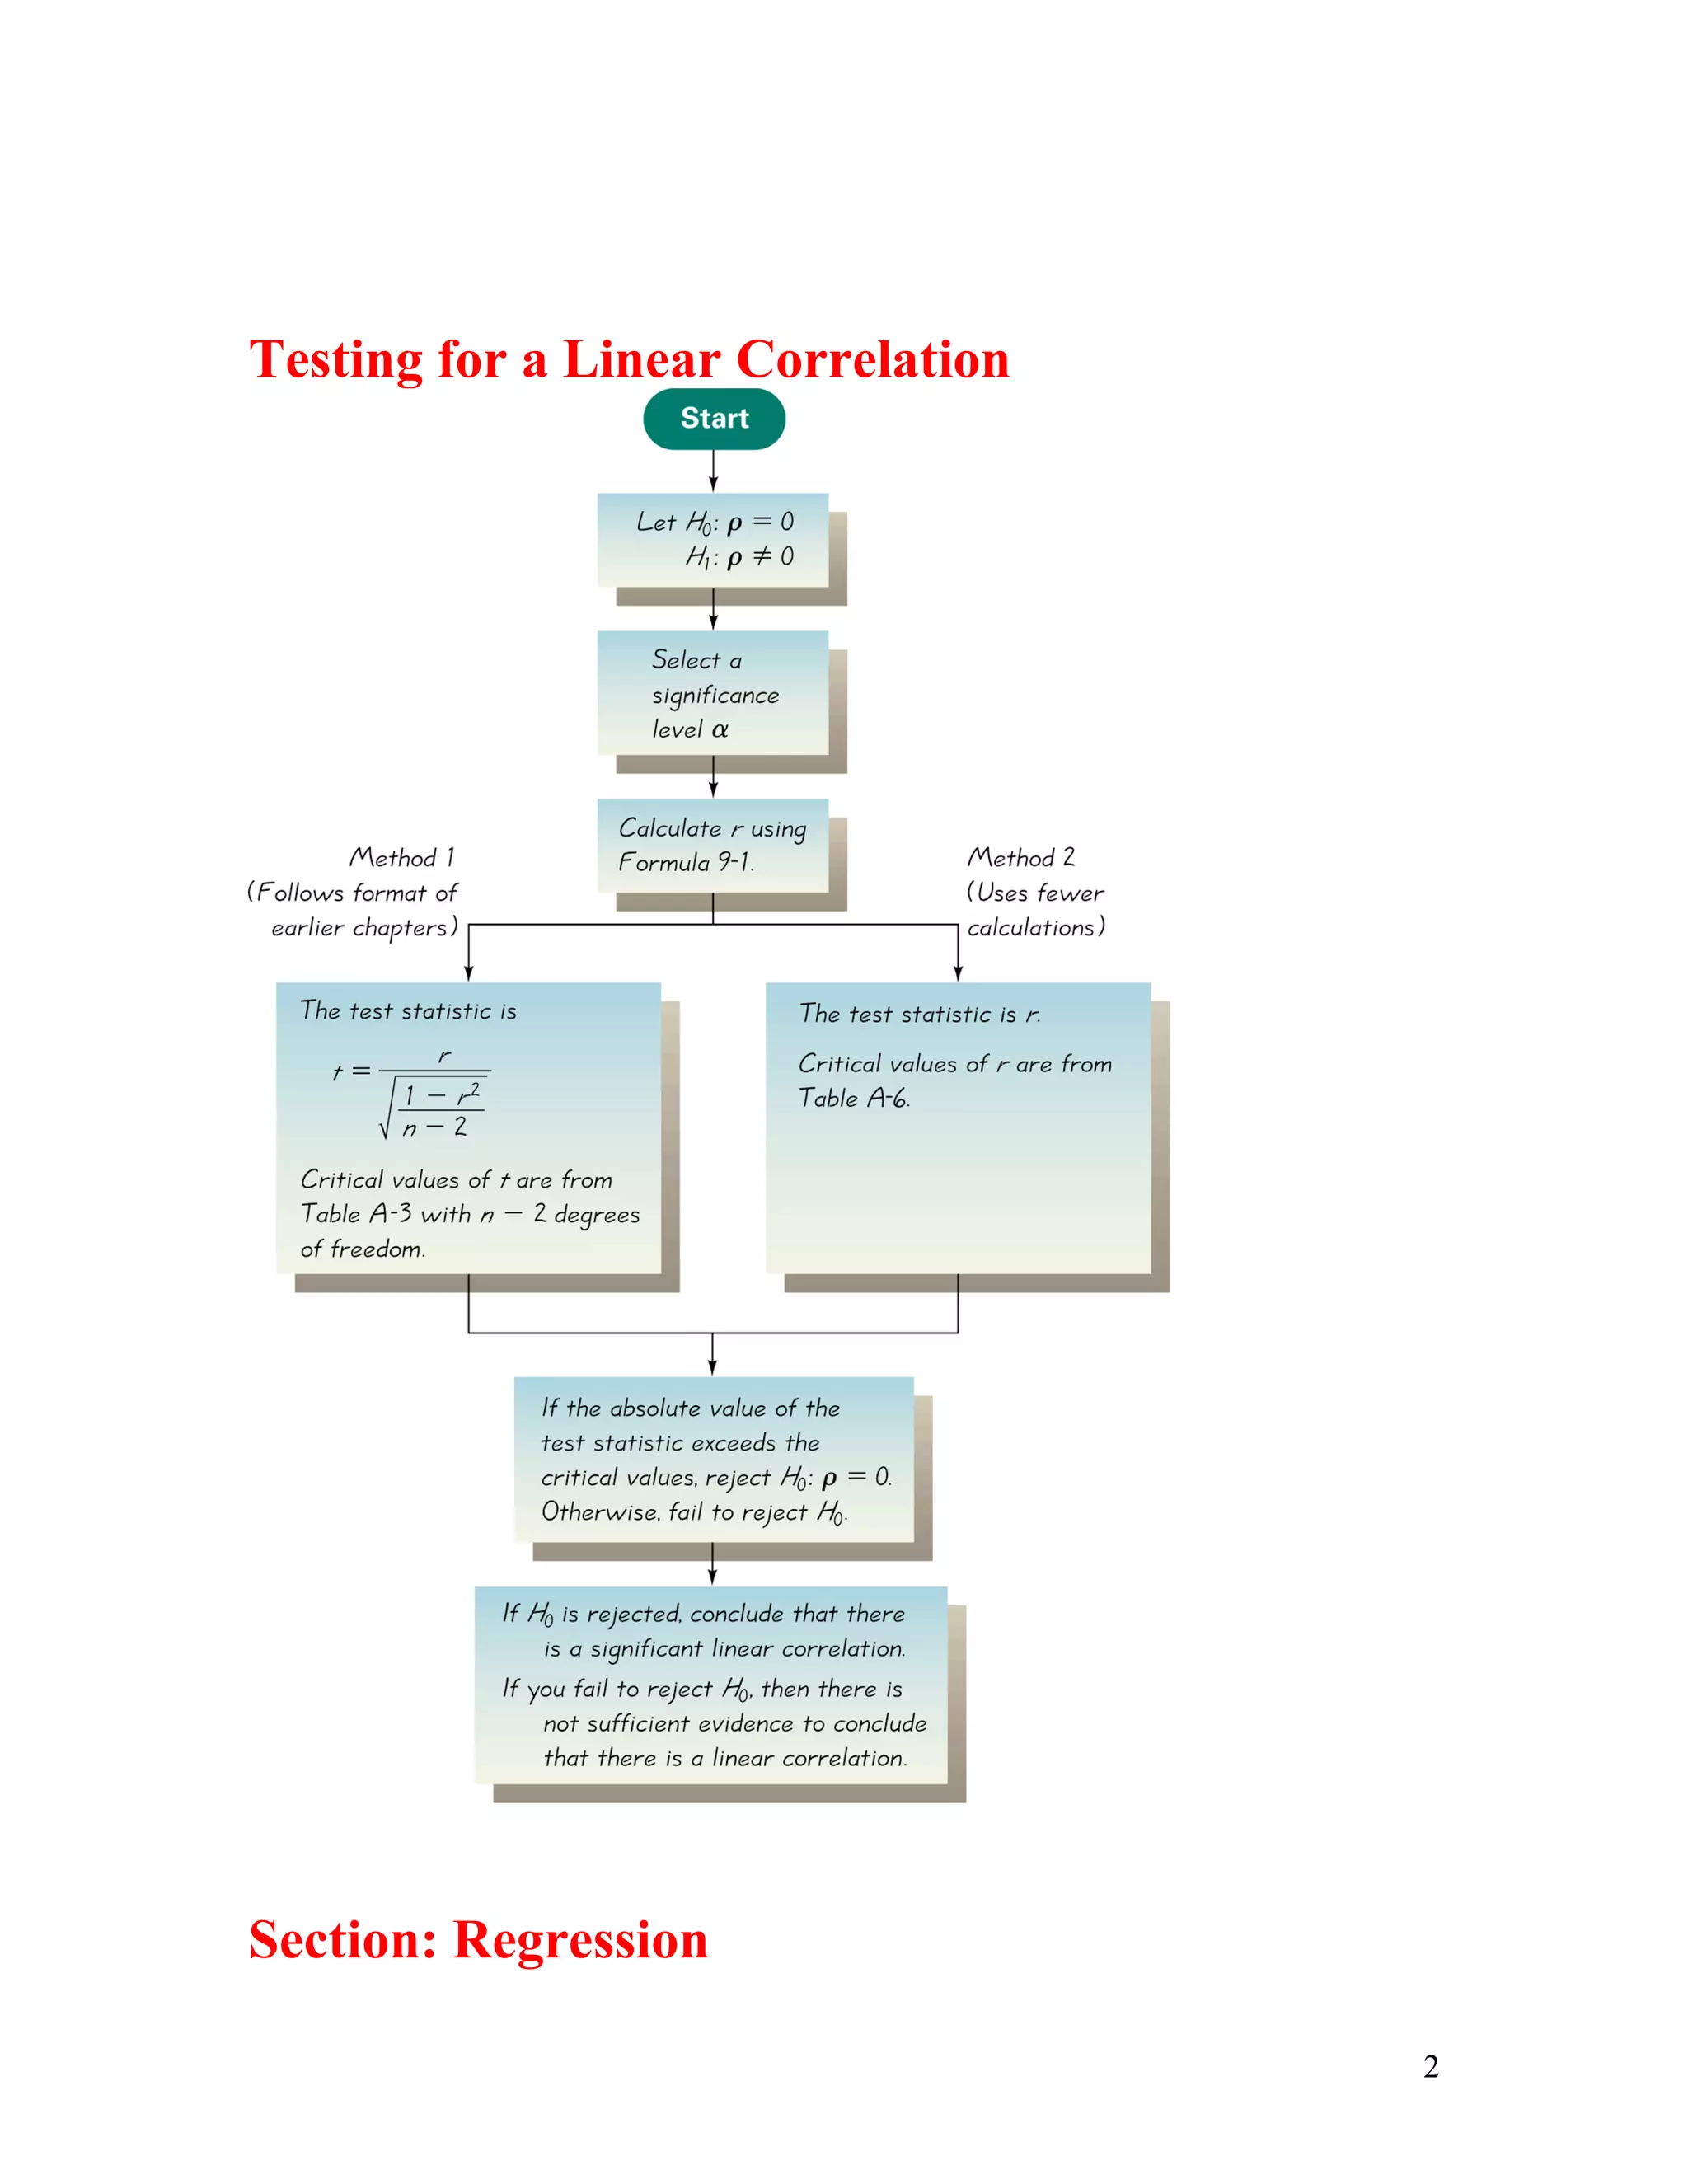
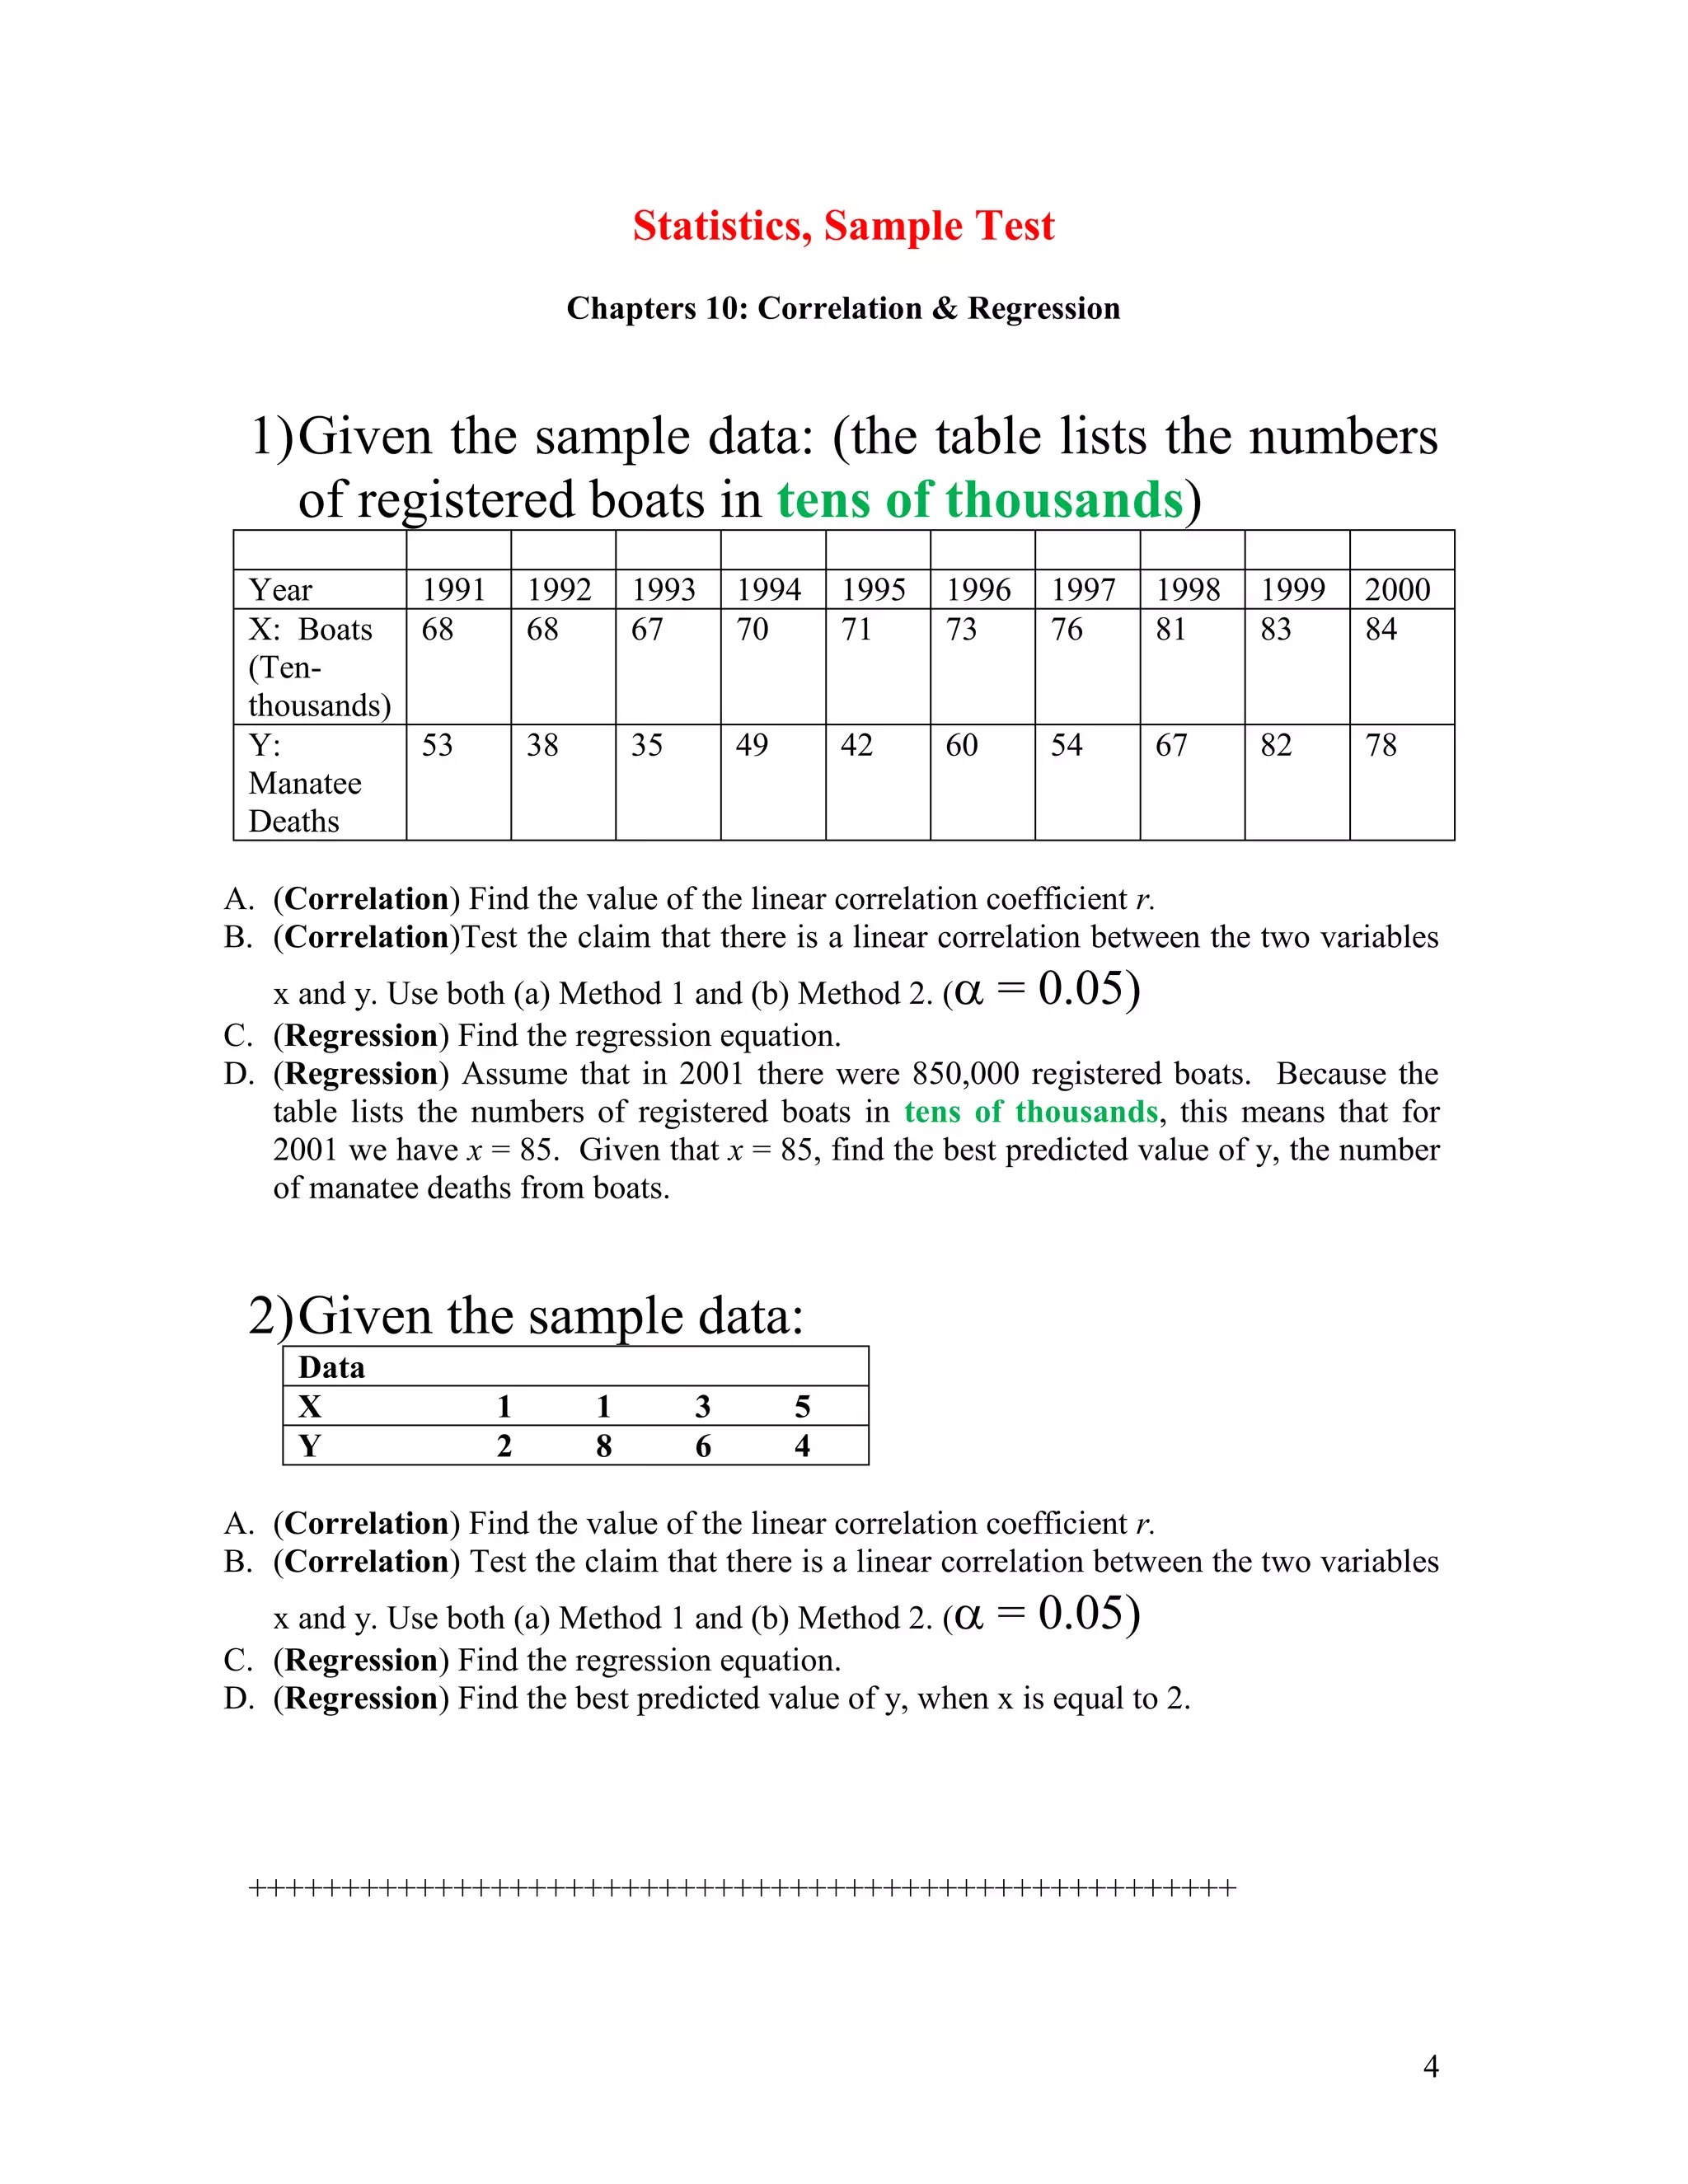
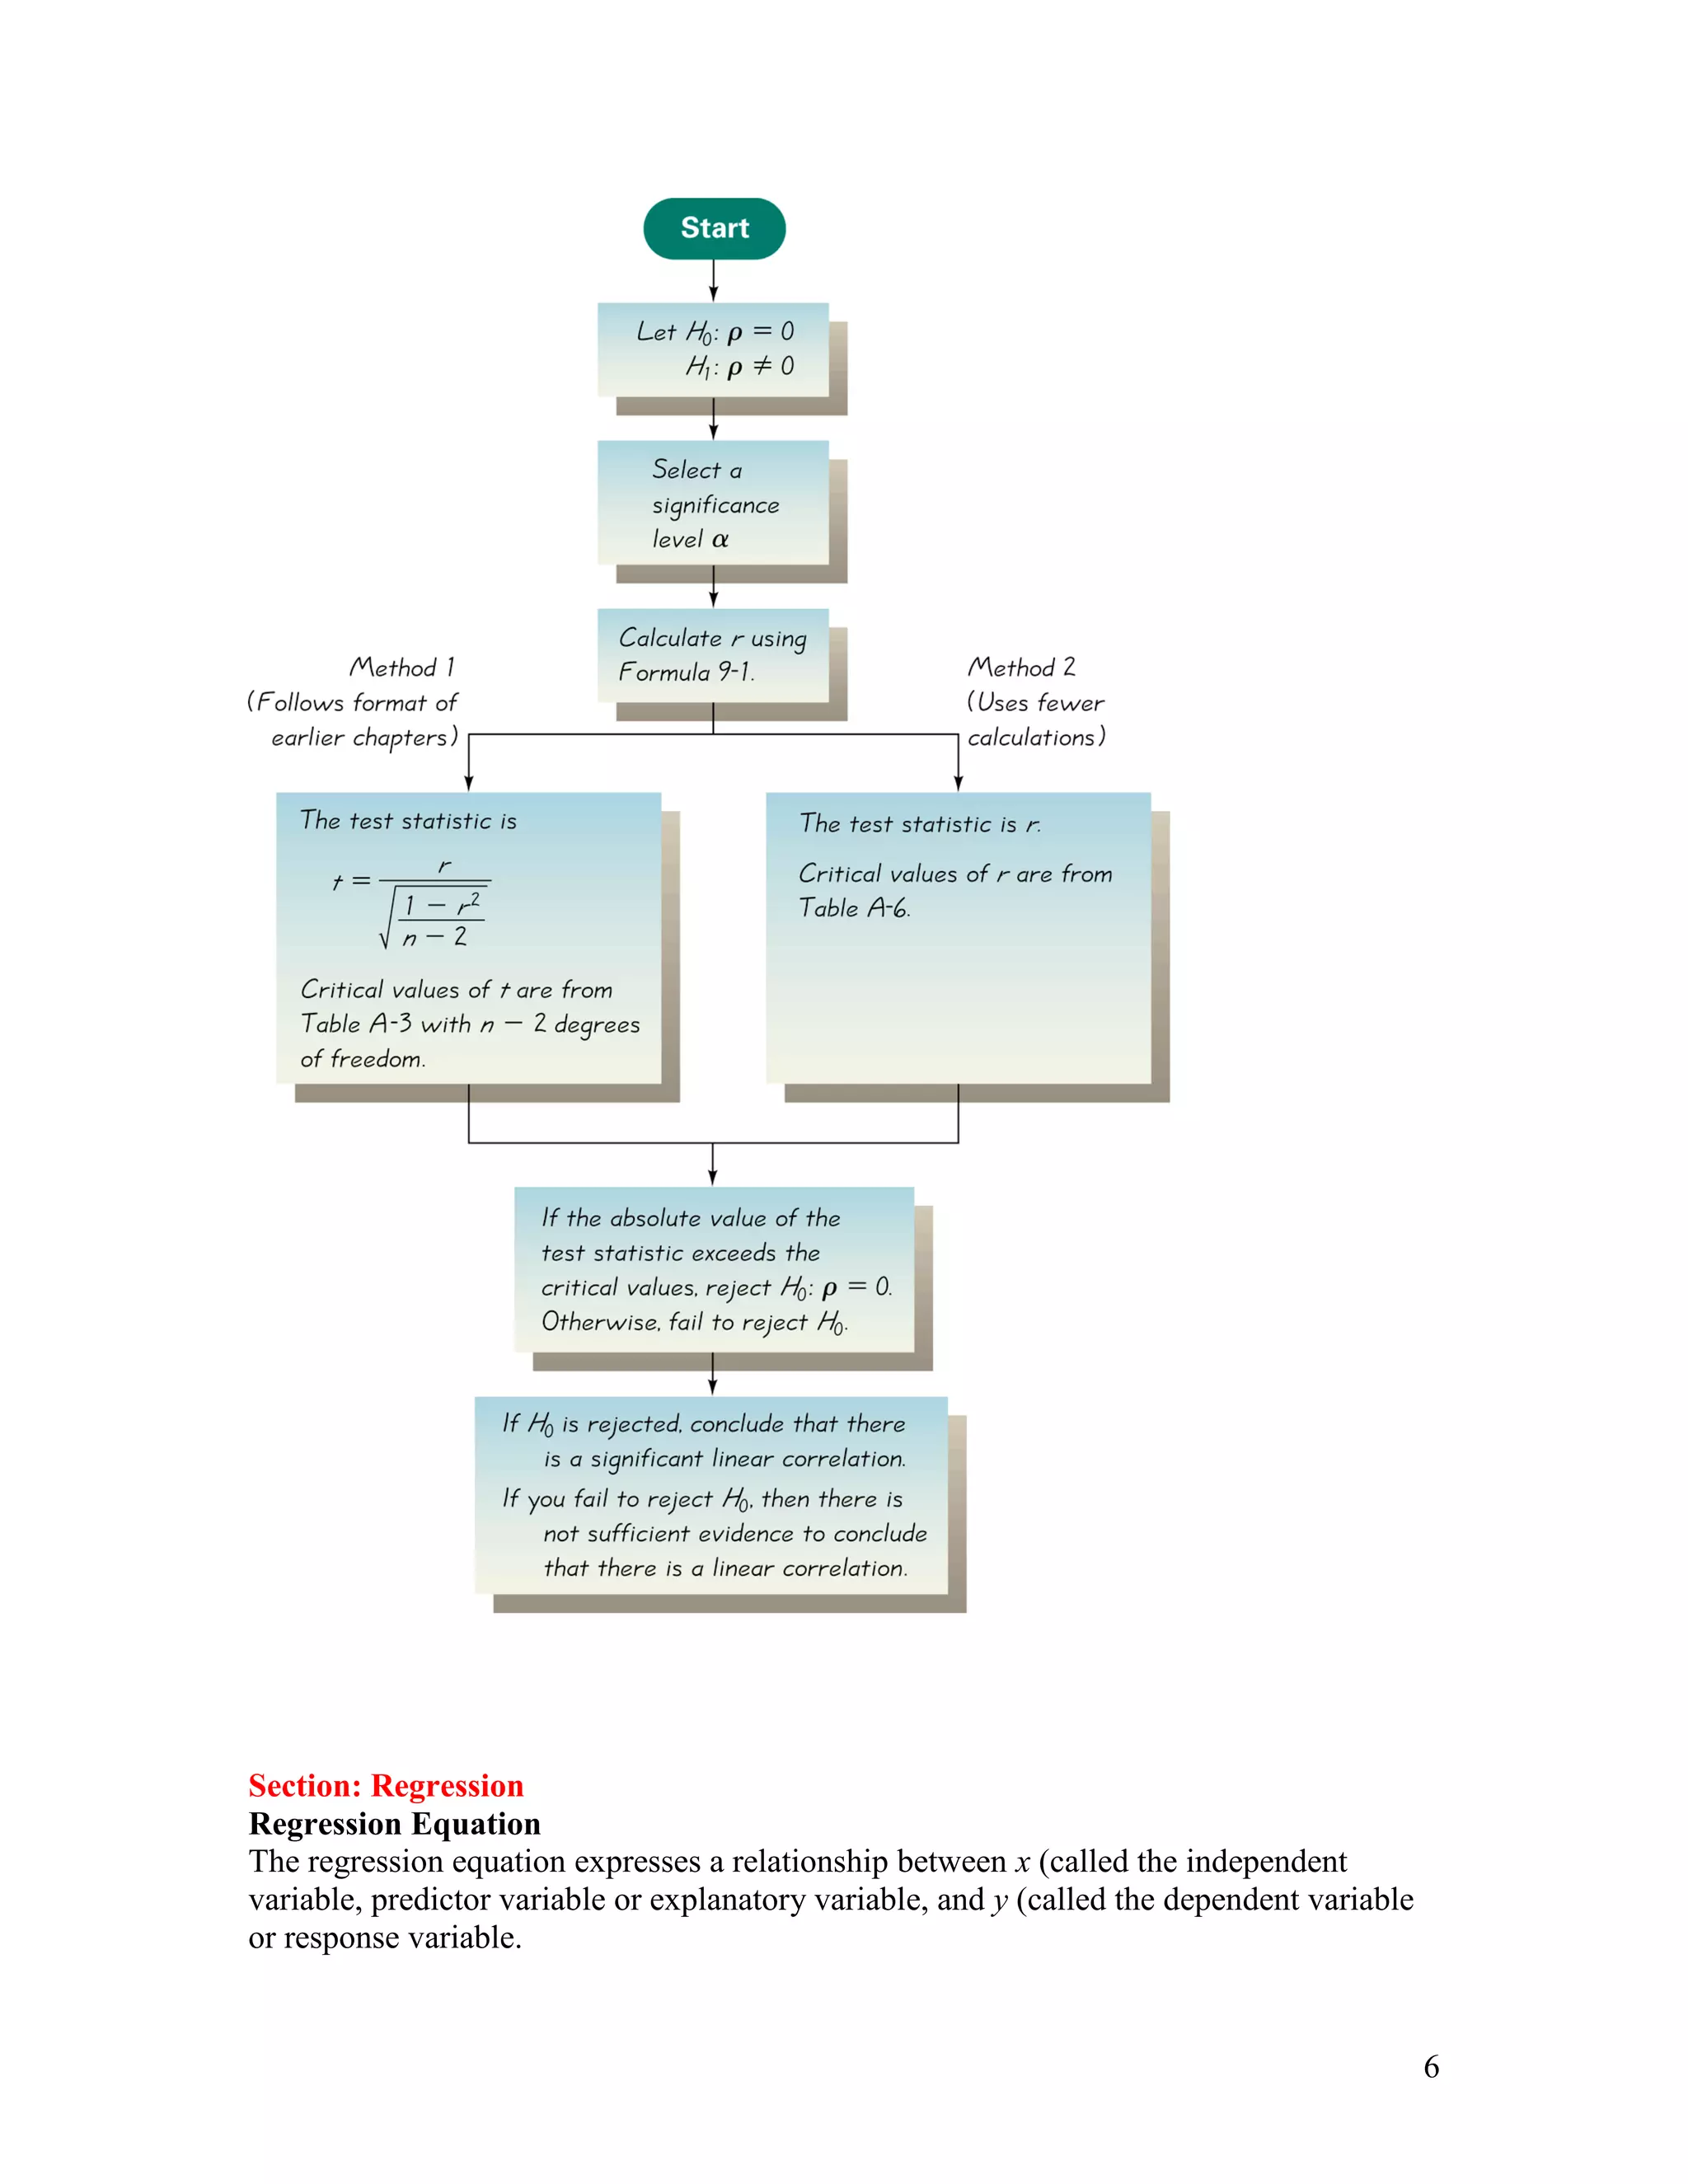
1. The document discusses correlation and regression analysis. It defines the linear correlation coefficient r and how it measures the strength of a linear relationship between two variables.
2. It presents the formula for calculating r and describes how to test for a linear correlation between two variables.
3. It also defines the regression equation y=mx+b, where m is the slope and b is the y-intercept. It describes how to use a regression equation to predict values of the dependent variable y given values of the independent variable x.
This powerpoint presentation discusses or talks about the topic or lesson Direct Variations. It also discusses and explains the rules, concepts, steps and examples of Direct Variations.
First post of a Data Science blog about Linear Regression using Matlab.
For more information, please visit:
http://datascienceinsights.blogspot.com.br/
https://github.com/tadeuferreirajr/MachineLearning
The work is done as part of graduate coursework at University of Florida. The author studied master's in environmental engineering sciences during the making of the presentation.
To get a copy of the slides for free Email me at: japhethmuthama@gmail.com
You can also support my PhD studies by donating a 1 dollar to my PayPal.
PayPal ID is japhethmuthama@gmail.com
Please Subscribe to this Channel for more solutions and lectures
http://www.youtube.com/onlineteaching
Elementary Statistics Practice Test 5
Module 5
Chapter 10: Correlation and Regression
Chapter 11: Goodness of Fit and Contingency Tables
Chapter 12: Analysis of Variance
IJERA (International journal of Engineering Research and Applications) is International online, ... peer reviewed journal. For more detail or submit your article, please visit www.ijera.com
Topic: Regression
Student Name: Nayab
Class: B.Ed. 2.5
Project Name: “Young Teachers' Professional Development (TPD)"
"Project Founder: Prof. Dr. Amjad Ali Arain
Faculty of Education, University of Sindh, Pakistan
Stuck with your Regression Assignment? Get 24/7 help from tutors with Phd in the subject. Email us at support@helpwithassignment.com
Reach us at http://www.HelpWithAssignment.com
Please Subscribe to this Channel for more solutions and lectures
http://www.youtube.com/onlineteaching
Elementary Statistics Practice Test 4
Chapter 9: Inferences about Two Samples
Please Subscribe to this Channel for more solutions and lectures
http://www.youtube.com/onlineteaching
Elementary Statistics Practice Test 4
Chapter 8: Hypothesis Testing
Solution to the practice test ch 10 correlation reg ch 11 gof ch12 anovaLong Beach City College
Please Subscribe to this Channel for more solutions and lectures
http://www.youtube.com/onlineteaching
Elementary Statistics Practice Test 5
Module 5
Chapter 10: Correlation and Regression
Chapter 11: Goodness of Fit and Contingency Tables
Chapter 12: Analysis of Variance
Please Subscribe to this Channel for more solutions and lectures
http://www.youtube.com/onlineteaching
Elementary Statistics Practice Test 4
Module 4:
Chapter 8, Hypothesis Testing
Chapter 9: Two Populations
Solution to the practice test ch 8 hypothesis testing ch 9 two populationsLong Beach City College
Please Subscribe to this Channel for more solutions and lectures
http://www.youtube.com/onlineteaching
Elementary Statistics Practice Test 4
Module 4:
Chapter 8, Hypothesis Testing
Chapter 9: Two Populations
Solution to the Practice Test 3A, Chapter 6 Normal Probability DistributionLong Beach City College
Please Subscribe to this Channel for more solutions and lectures
http://www.youtube.com/onlineteaching
Elementary Statistics Practice Test 3
Practice Test Chapter 6 (Normal Probability Distributions)
Chapter 6: Normal Probability Distributions
Please Subscribe to this Channel for more solutions and lectures
http://www.youtube.com/onlineteaching
Elementary Statistics Practice Test 3
Practice Test Chapter 6 (Normal Probability Distributions)
Chapter 6: Normal Probability Distributions
Please Subscribe to this Channel for more solutions and lectures
http://www.youtube.com/onlineteaching
Elementary Statistics Practice Test 2 Solutions
Chapter 4: Probability
Please Subscribe to this Channel for more solutions and lectures
http://www.youtube.com/onlineteaching
Elementary Statistics Practice Test 2
Chapter 4: Probability
Please Subscribe to this Channel for more solutions and lectures
http://www.youtube.com/onlineteaching
Elementary Statistics Practice Test 1
Module 1: Chapters 1-3
Chapter 1: Introduction to Statistics.
Chapter 2: Exploring Data with Tables and Graphs.
Chapter 3: Describing, Exploring, and Comparing Data.
Please Subscribe to this Channel for more solutions and lectures
http://www.youtube.com/onlineteaching
Chapter 12: Analysis of Variance
12.2: Two-Way ANOVA
Please Subscribe to this Channel for more solutions and lectures
http://www.youtube.com/onlineteaching
Chapter 12: Analysis of Variance
12.1: One-Way ANOVA
Please Subscribe to this Channel for more solutions and lectures
http://www.youtube.com/onlineteaching
Chapter 11: Goodness-of-Fit and Contingency Tables
11.2: Contingency Tables
Please Subscribe to this Channel for more solutions and lectures
http://www.youtube.com/onlineteaching
Chapter 11: Goodness-of-Fit and Contingency Tables
11.1: Goodness of Fit Notation
Please Subscribe to this Channel for more solutions and lectures
http://www.youtube.com/onlineteaching
Chapter 10: Correlation and Regression
10.2: Regression
Please Subscribe to this Channel for more solutions and lectures
http://www.youtube.com/onlineteaching
Chapter 10: Correlation and Regression
10.1: Correlation
Students, digital devices and success - Andreas Schleicher - 27 May 2024..pptxEduSkills OECD
Andreas Schleicher presents at the OECD webinar ‘Digital devices in schools: detrimental distraction or secret to success?’ on 27 May 2024. The presentation was based on findings from PISA 2022 results and the webinar helped launch the PISA in Focus ‘Managing screen time: How to protect and equip students against distraction’ https://www.oecd-ilibrary.org/education/managing-screen-time_7c225af4-en and the OECD Education Policy Perspective ‘Students, digital devices and success’ can be found here - https://oe.cd/il/5yV
How to Split Bills in the Odoo 17 POS ModuleCeline George
Bills have a main role in point of sale procedure. It will help to track sales, handling payments and giving receipts to customers. Bill splitting also has an important role in POS. For example, If some friends come together for dinner and if they want to divide the bill then it is possible by POS bill splitting. This slide will show how to split bills in odoo 17 POS.
Welcome to TechSoup New Member Orientation and Q&A (May 2024).pdfTechSoup
In this webinar you will learn how your organization can access TechSoup's wide variety of product discount and donation programs. From hardware to software, we'll give you a tour of the tools available to help your nonprofit with productivity, collaboration, financial management, donor tracking, security, and more.
Model Attribute Check Company Auto PropertyCeline George
In Odoo, the multi-company feature allows you to manage multiple companies within a single Odoo database instance. Each company can have its own configurations while still sharing common resources such as products, customers, and suppliers.
How to Make a Field invisible in Odoo 17Celine George
It is possible to hide or invisible some fields in odoo. Commonly using “invisible” attribute in the field definition to invisible the fields. This slide will show how to make a field invisible in odoo 17.
The Art Pastor's Guide to Sabbath | Steve ThomasonSteve Thomason
What is the purpose of the Sabbath Law in the Torah. It is interesting to compare how the context of the law shifts from Exodus to Deuteronomy. Who gets to rest, and why?
We all have good and bad thoughts from time to time and situation to situation. We are bombarded daily with spiraling thoughts(both negative and positive) creating all-consuming feel , making us difficult to manage with associated suffering. Good thoughts are like our Mob Signal (Positive thought) amidst noise(negative thought) in the atmosphere. Negative thoughts like noise outweigh positive thoughts. These thoughts often create unwanted confusion, trouble, stress and frustration in our mind as well as chaos in our physical world. Negative thoughts are also known as “distorted thinking”.
The Indian economy is classified into different sectors to simplify the analysis and understanding of economic activities. For Class 10, it's essential to grasp the sectors of the Indian economy, understand their characteristics, and recognize their importance. This guide will provide detailed notes on the Sectors of the Indian Economy Class 10, using specific long-tail keywords to enhance comprehension.
For more information, visit-www.vavaclasses.com
Sectors of the Indian Economy - Class 10 Study Notes pdf
Stat sample test ch 10
1. 1
Statistics, Sample Test
Chapters 10: Correlation & Regression
Name: ______________________________ Student ID: _______________________
Instructions: Read this Mini Lecture or your text, or study the tutorials online
thoroughly to be able to handle this Sample Test (last page).
Mini Lecture:
Chapter 10: Correlation and Regression
Section: Linear Correlation Coefficient:
–1 r 1
Value of r does not change if all values of either variable are converted to a
different scale.
The r is not affected by the choice of x and y. Interchange x and y will not change
the value of r.
r measures strength of a linear relationship.
nxy – (x)(y)
n(x2
) – (x)2
n(y2
) – (y)2
r =
3. 3
Regression Equation
The regression equation expresses a relationship between x (called the independent
variable, predictor variable or explanatory variable, and y (called the dependent variable
or response variable.
The typical equation of a straight line is expressed in the form of y = mx + b, where b is
the y-intercept and m is the slope.
(Given a collection of paired data, the regression equation, algebraically describes the
relationship between the two variables)
Note:
Population Parameter 0 1
y x
Sample Statistic 0 1
y b b x
Formulas
1 2
2
0 1
:
int : , ,
n xy x y
Slope b
n x x
y x
Y ercept b y b x y x
n n
Regression Line
The graph of the regression equation is called the regression line (or line of best fit, or
least squares line).
If there is not a significant linear correlation, the best predicted y-value is y .
If there is a significant linear correlation, the best predicted y-value is found
by substituting the x-value into the regression equation.
4. 4
Statistics, Sample Test
Chapters 10: Correlation & Regression
1)Given the sample data: (the table lists the numbers
of registered boats in tens of thousands)
Year 1991 1992 1993 1994 1995 1996 1997 1998 1999 2000
X: Boats
(Ten-
thousands)
68 68 67 70 71 73 76 81 83 84
Y:
Manatee
Deaths
53 38 35 49 42 60 54 67 82 78
A. (Correlation) Find the value of the linear correlation coefficient r.
B. (Correlation)Test the claim that there is a linear correlation between the two variables
x and y. Use both (a) Method 1 and (b) Method 2. ( = 0.05)
C. (Regression) Find the regression equation.
D. (Regression) Assume that in 2001 there were 850,000 registered boats. Because the
table lists the numbers of registered boats in tens of thousands, this means that for
2001 we have x = 85. Given that x = 85, find the best predicted value of y, the number
of manatee deaths from boats.
2)Given the sample data:
Data
X 1 1 3 5
Y 2 8 6 4
A. (Correlation) Find the value of the linear correlation coefficient r.
B. (Correlation) Test the claim that there is a linear correlation between the two variables
x and y. Use both (a) Method 1 and (b) Method 2. ( = 0.05)
C. (Regression) Find the regression equation.
D. (Regression) Find the best predicted value of y, when x is equal to 2.
+++++++++++++++++++++++++++++++++++++++++++++++++++++
5. 5
Statistics, Sample Test
Chapters 10: Correlation & Regression
Name: ______________________________ Student ID: _______________________
Instructions: Read this Mini Lecture or your text, or study the tutorials online
thoroughly to be able to handle this Sample Test (last page).
Mini Lecture:
Chapter 10: Correlation and Regression
Section: Linear Correlation Coefficient:
2 2
2 2
n xy x y
r
n x x n y y
–1 r 1
Value of r does not change if all values of either variable are converted to a
different scale.
The r is not affected by the choice of x and y. Interchange x and y will not change
the value of r.
r measures strength of a linear relationship.
Testing for a Linear Correlation
6. 6
Section: Regression
Regression Equation
The regression equation expresses a relationship between x (called the independent
variable, predictor variable or explanatory variable, and y (called the dependent variable
or response variable.
7. 7
The typical equation of a straight line is expressed in the form of y = mx + b, where b is
the y-intercept and m is the slope.
(Given a collection of paired data, the regression equation, algebraically describes the
relationship between the two variables)
Note:
Population Parameter: 0 1
y x
Sample Statistic:
Formulas
1 2
2
0 1
:
int : , ,
n xy x y
Slope b
n x x
y x
Y ercept b y b x y x
n n
Regression Line
The graph of the regression equation is called the regression line (or line of best fit, or
least squares line).
If there is not a significant linear correlation, the best predicted y-value is y .
If there is a significant linear correlation, the best predicted y-value is found
by substituting the x-value into the regression equation.
Statistics, Sample Test
Chapters 10: Correlation & Regression
3) Given the sample data: (the table lists the numbers of registered boats in tens of
thousands)
Year 1991 1992 1993 1994 1995 1996 1997 1998 1999 2000
X: Boats
(Ten-
thousands)
68 68 67 70 71 73 76 81 83 84
Y:
Manatee
Deaths
53 38 35 49 42 60 54 67 82 78
A. (Correlation) Find the value of the linear correlation coefficient r.
8. 8
B. (Correlation)Test the claim that there is a linear correlation between the two variables
x and y. Use both (a) Method 1 and (b) Method 2. ( = 0.05)
C. (Regression) Find the regression equation.
D. (Regression) Assume that in 2001 there were 850,000 registered boats. Because the
table lists the numbers of registered boats in tens of thousands, this means that for
2001 we have x = 85. Given that x = 85, find the best predicted value of y, the number
of manatee deaths from boats.
4) Given the sample data:
Data
X 1 1 3 5
Y 2 8 6 4
A. (Correlation) Find the value of the linear correlation coefficient r.
B. (Correlation) Test the claim that there is a linear correlation between the two variables
x and y. Use both (a) Method 1 and (b) Method 2. ( = 0.05)
C. (Regression) Find the regression equation.
D. (Regression) Find the best predicted value of y, when x is equal to 2.