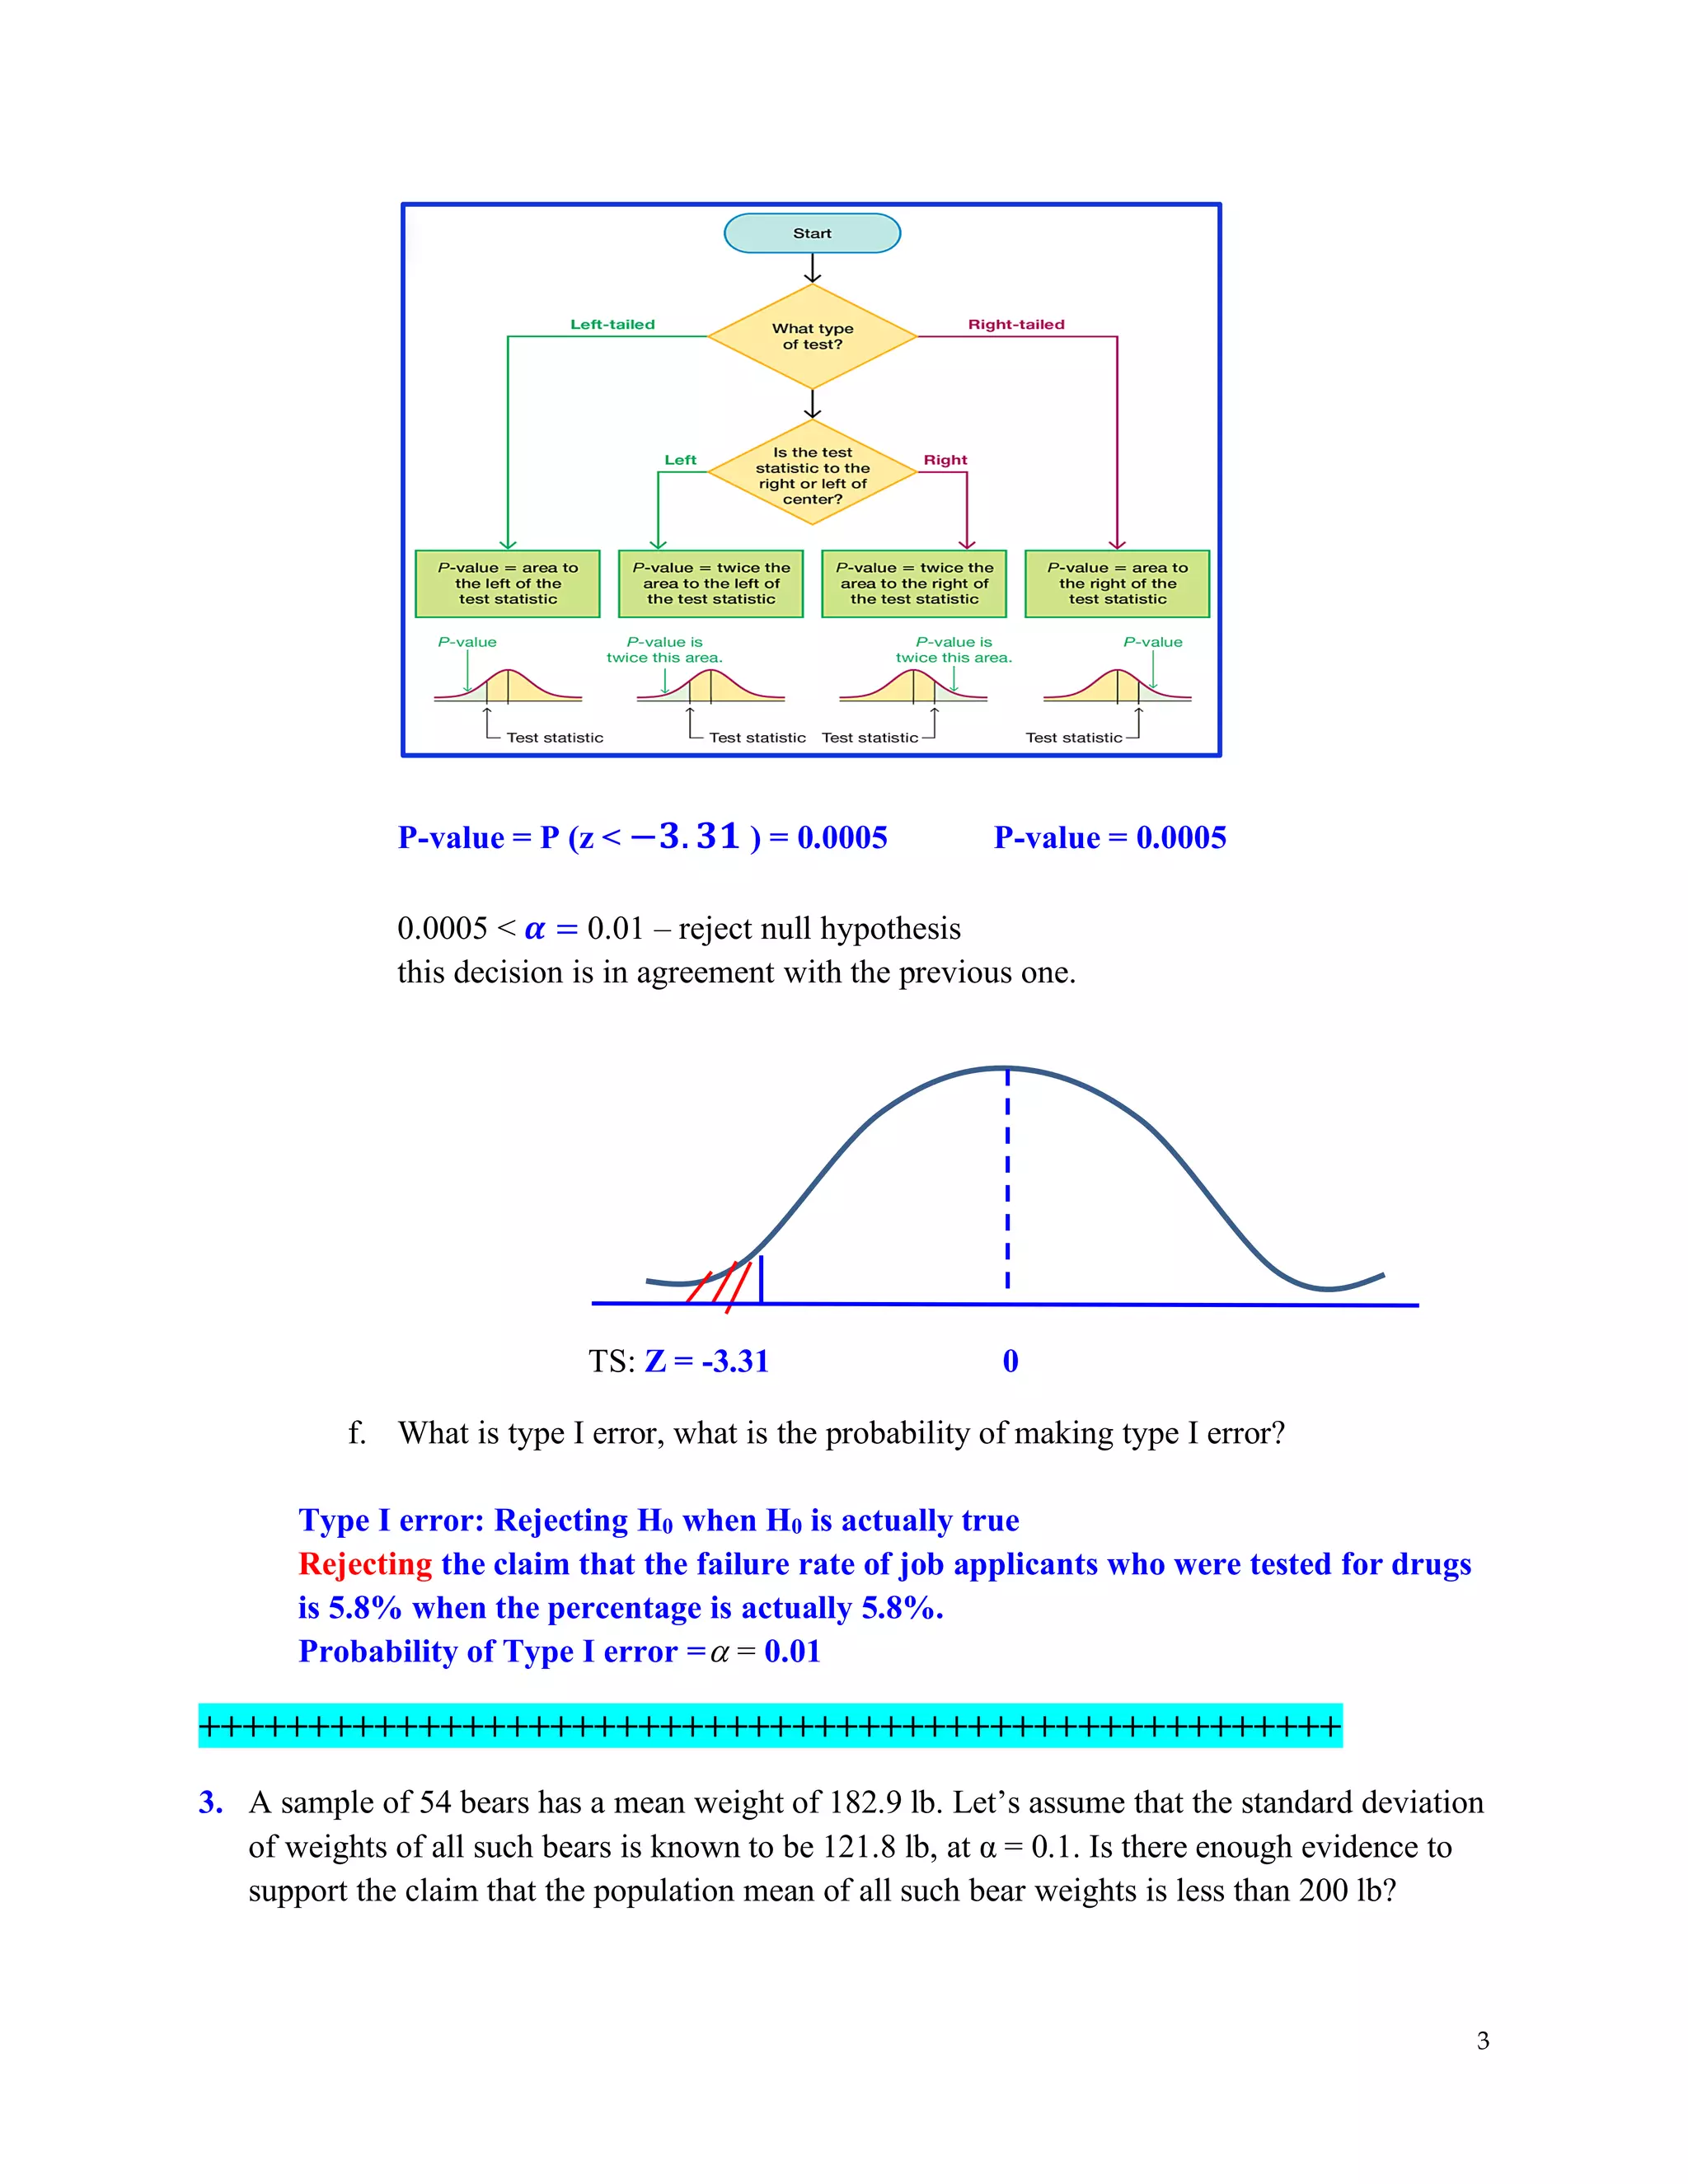
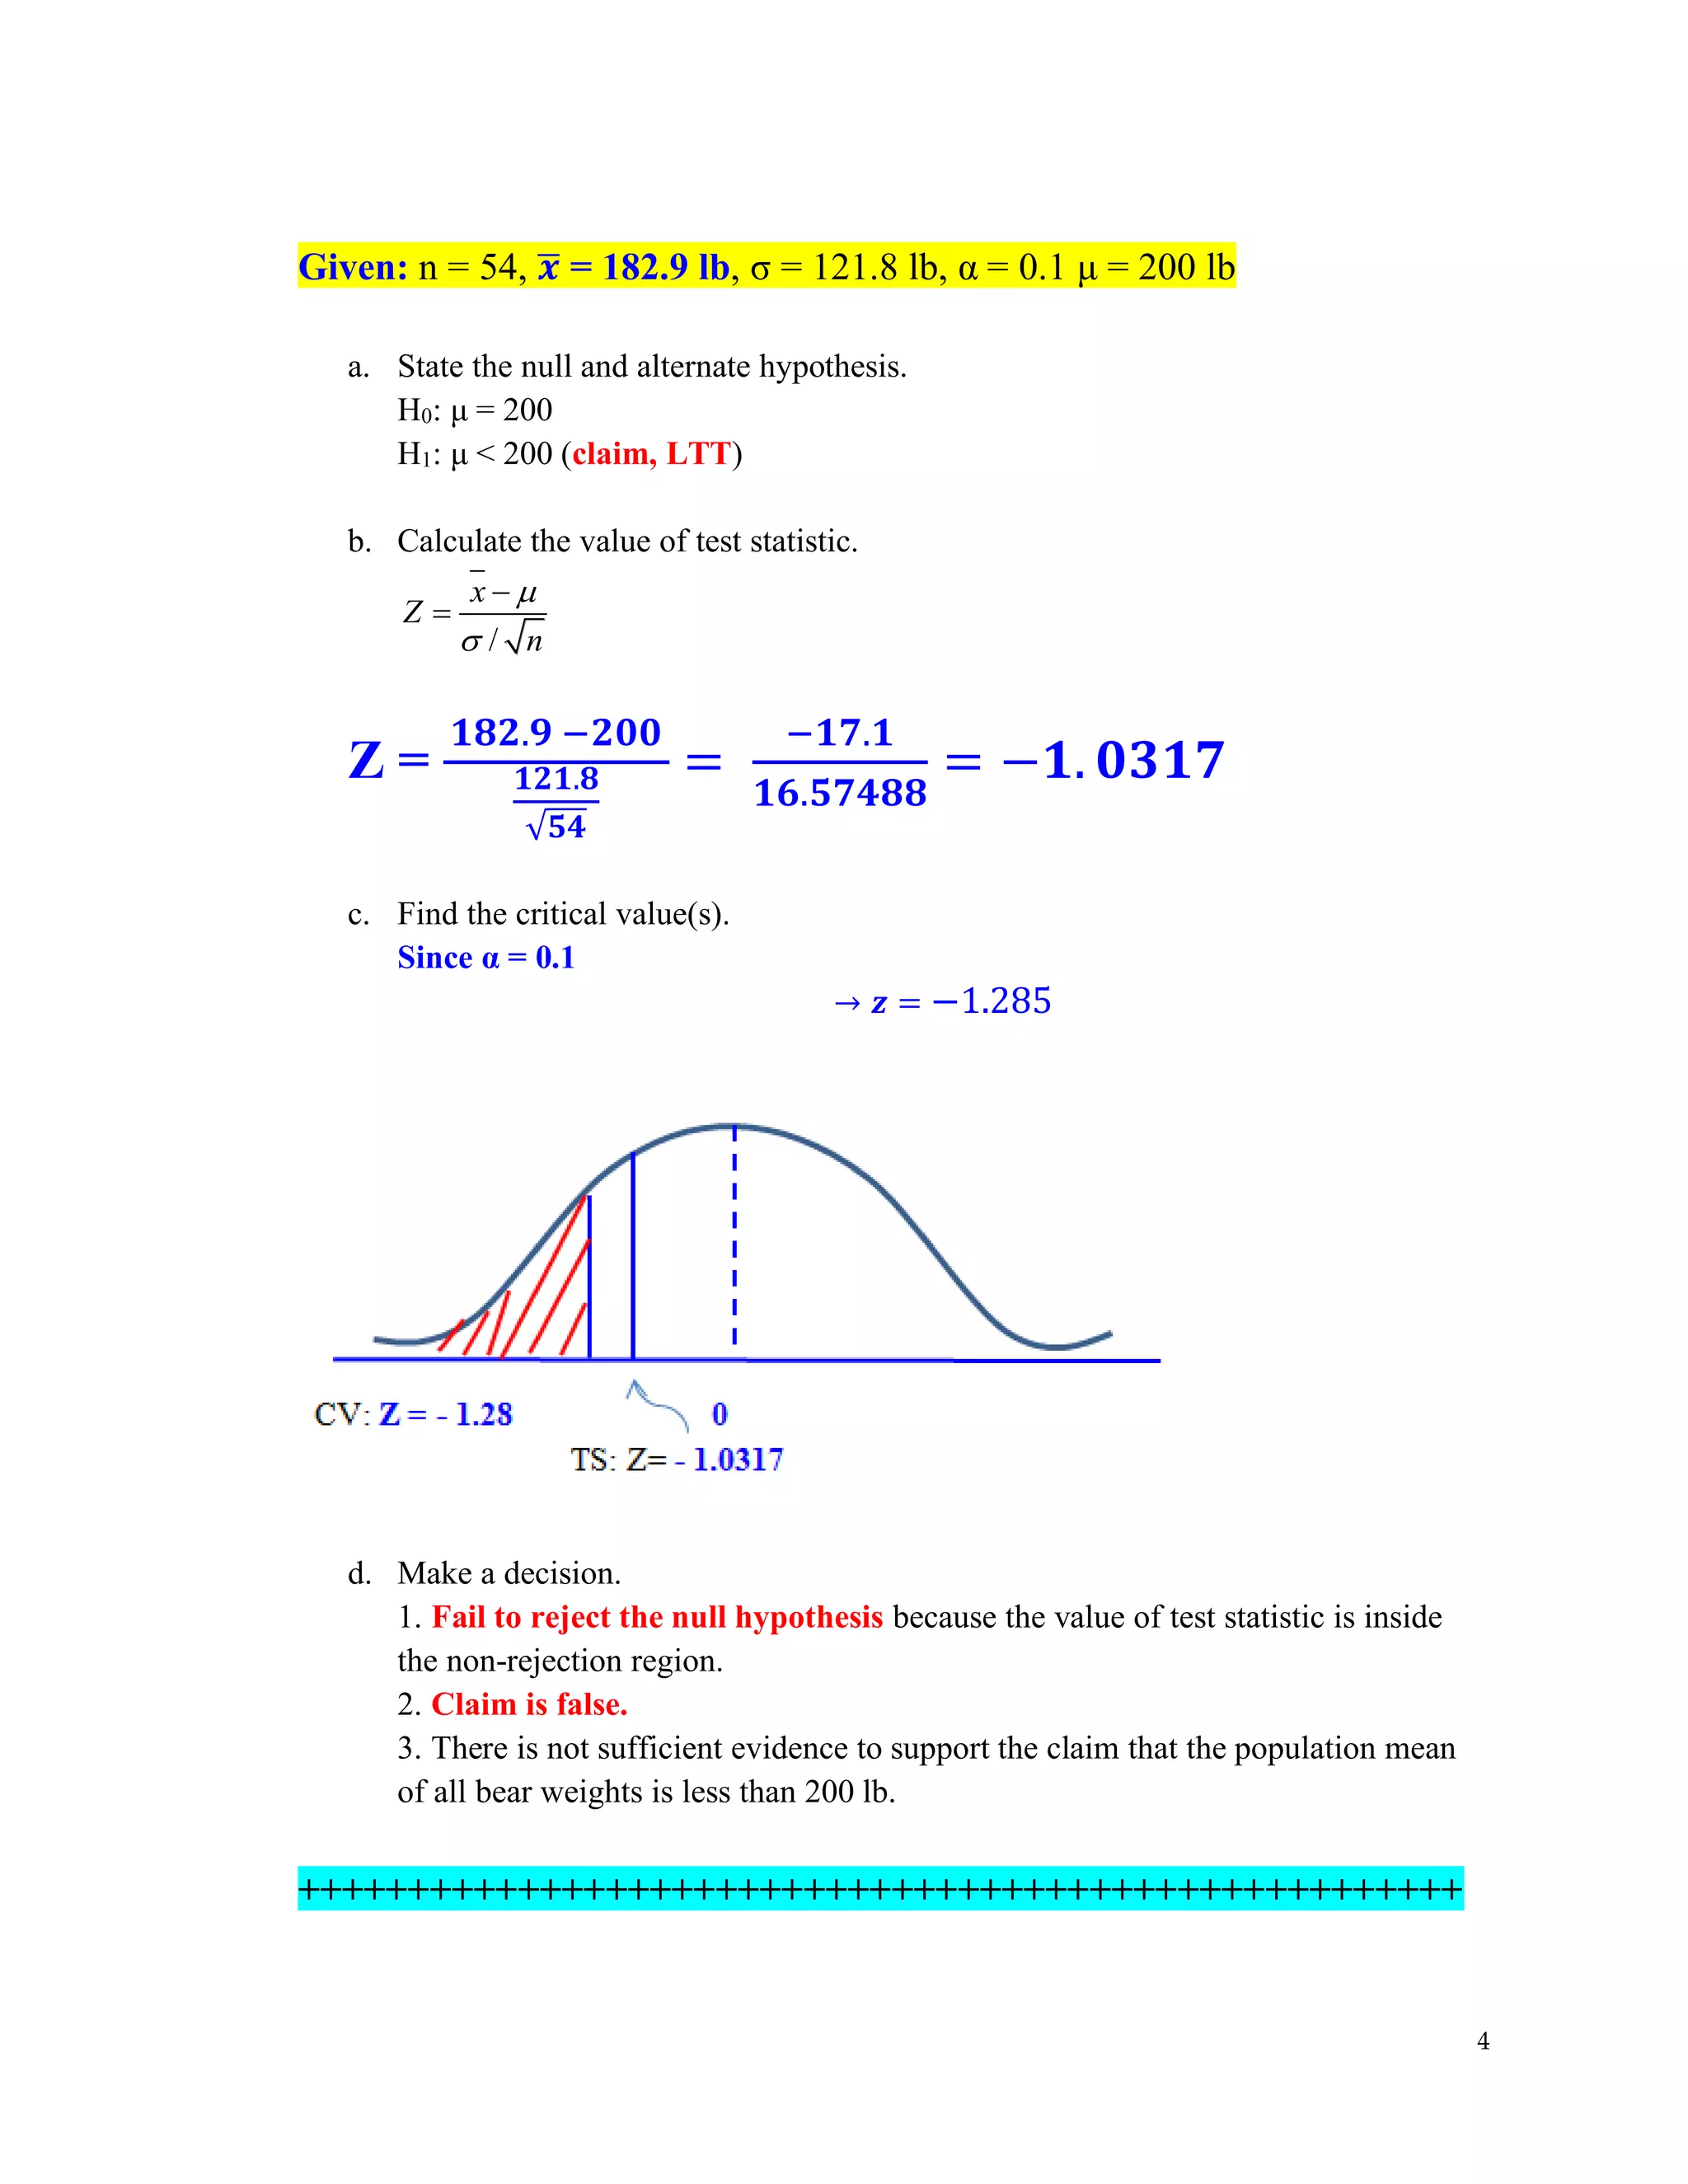
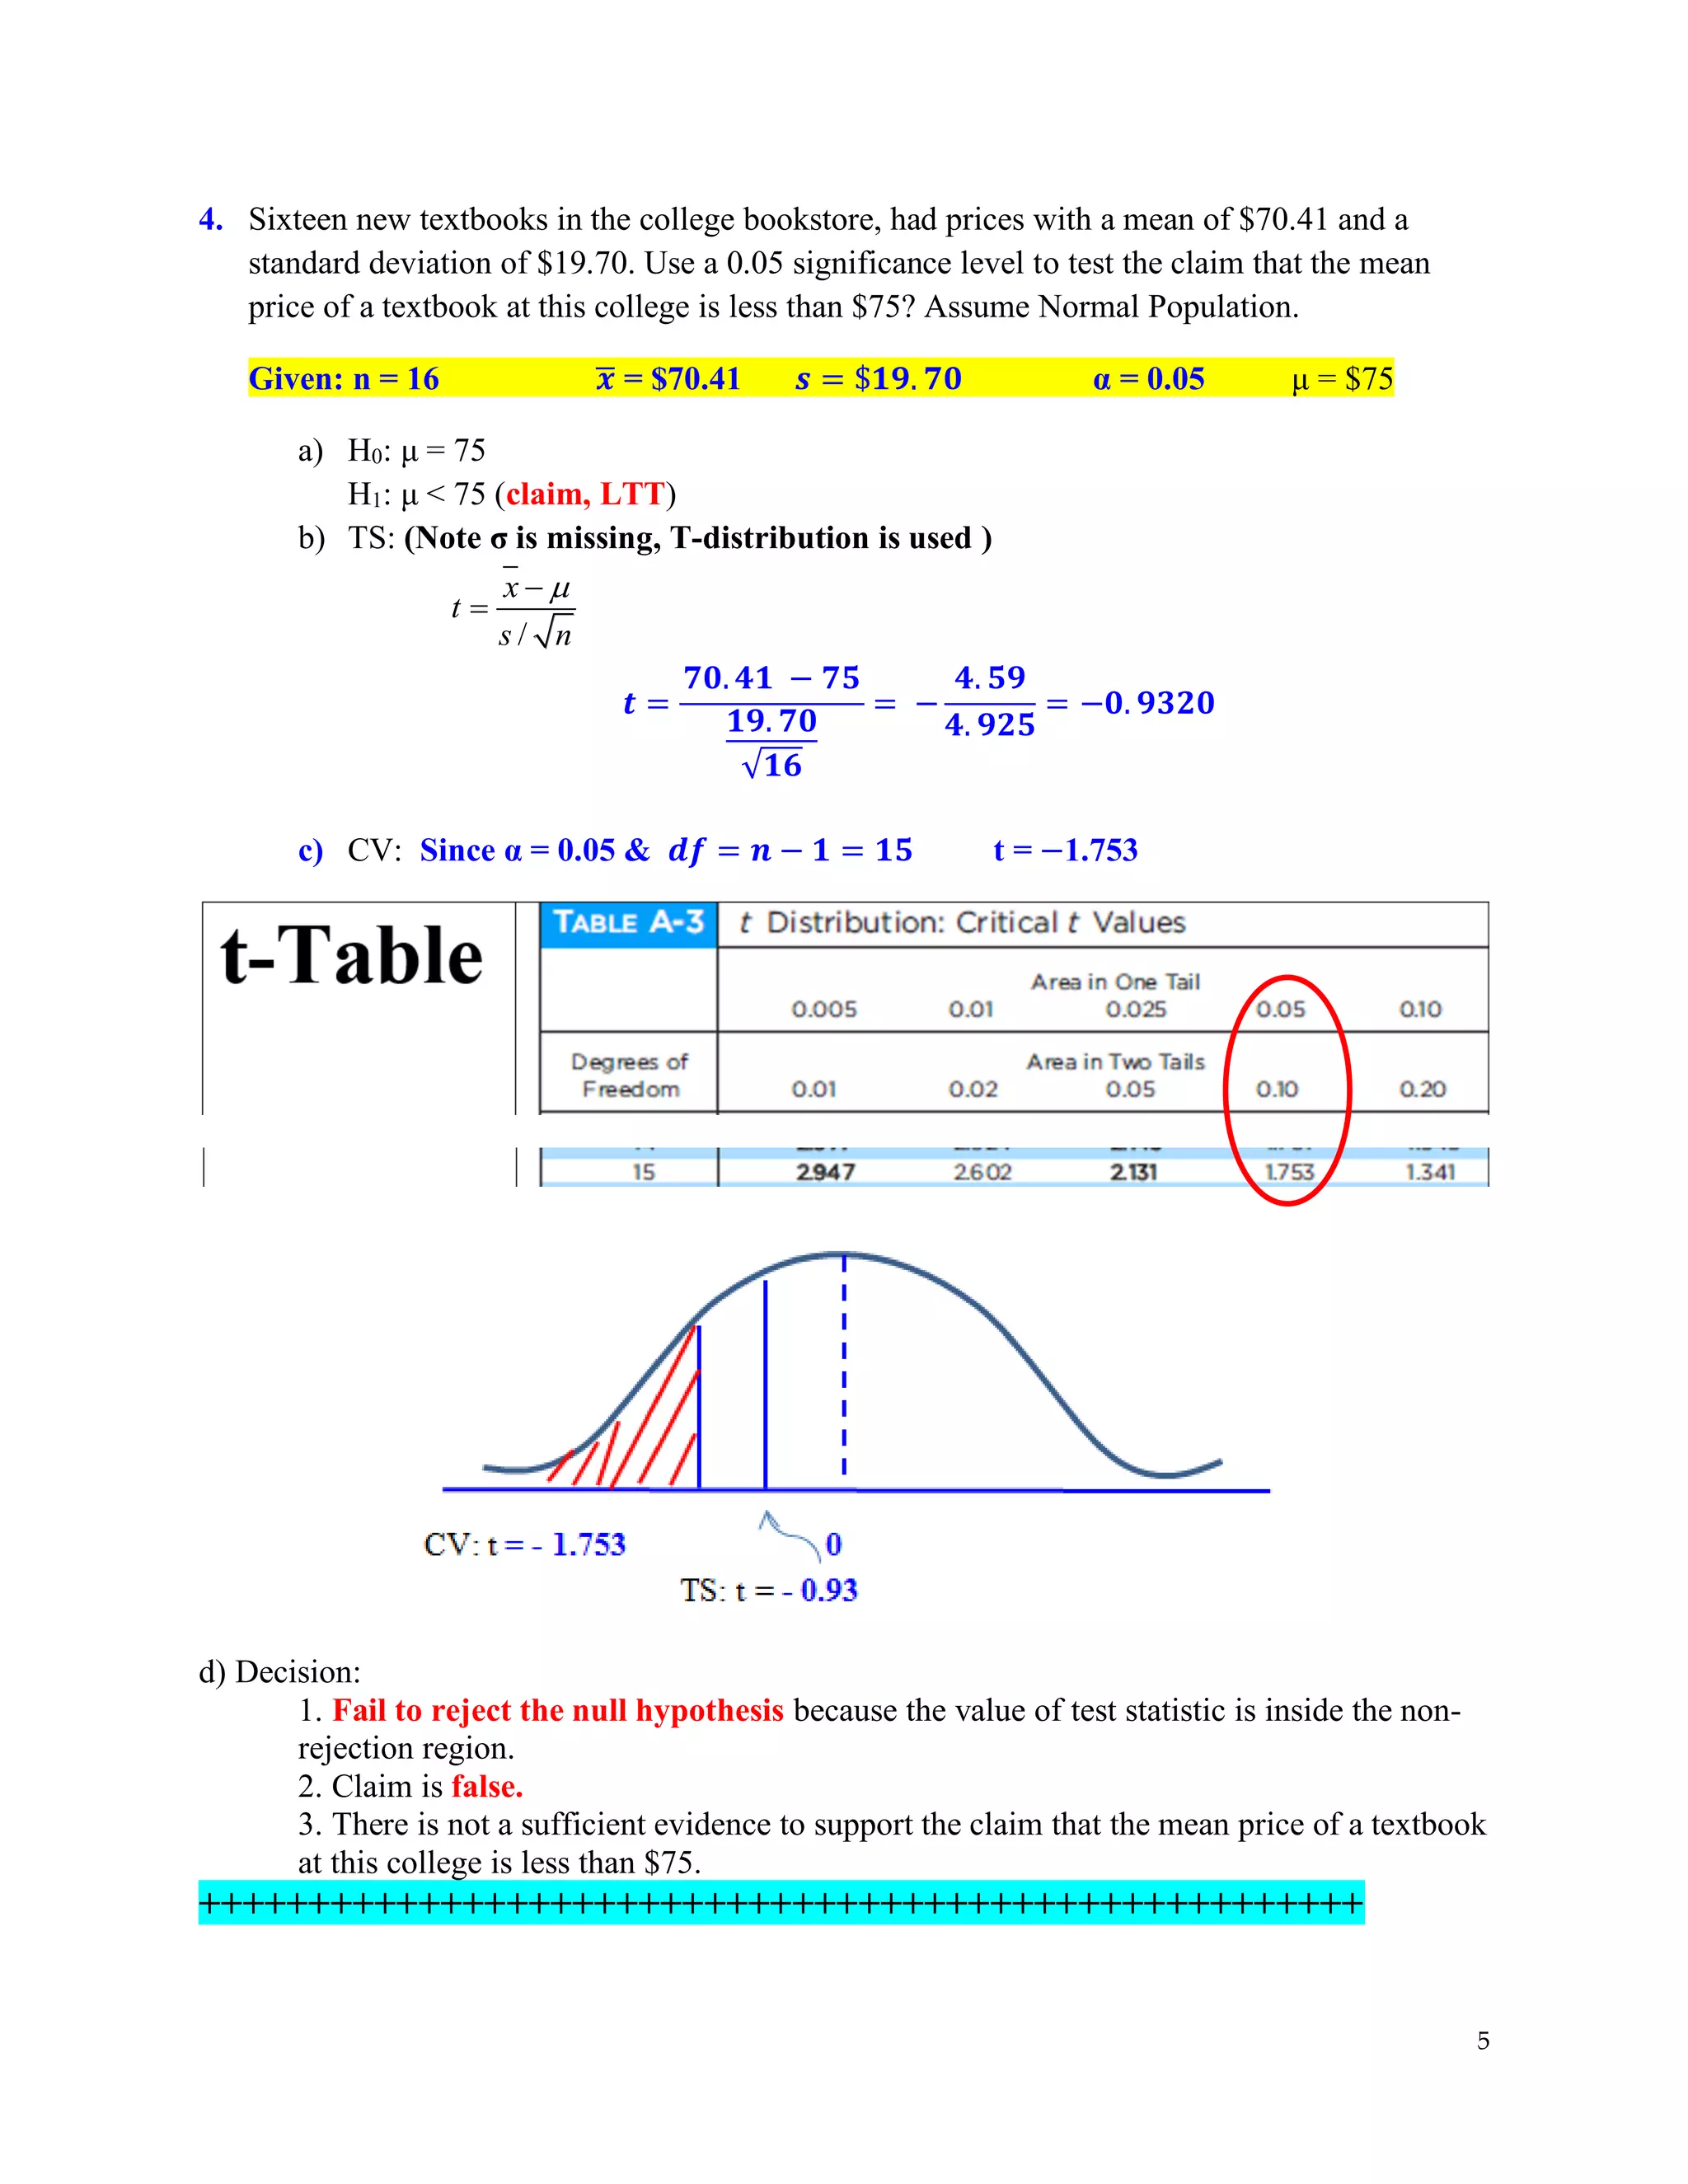
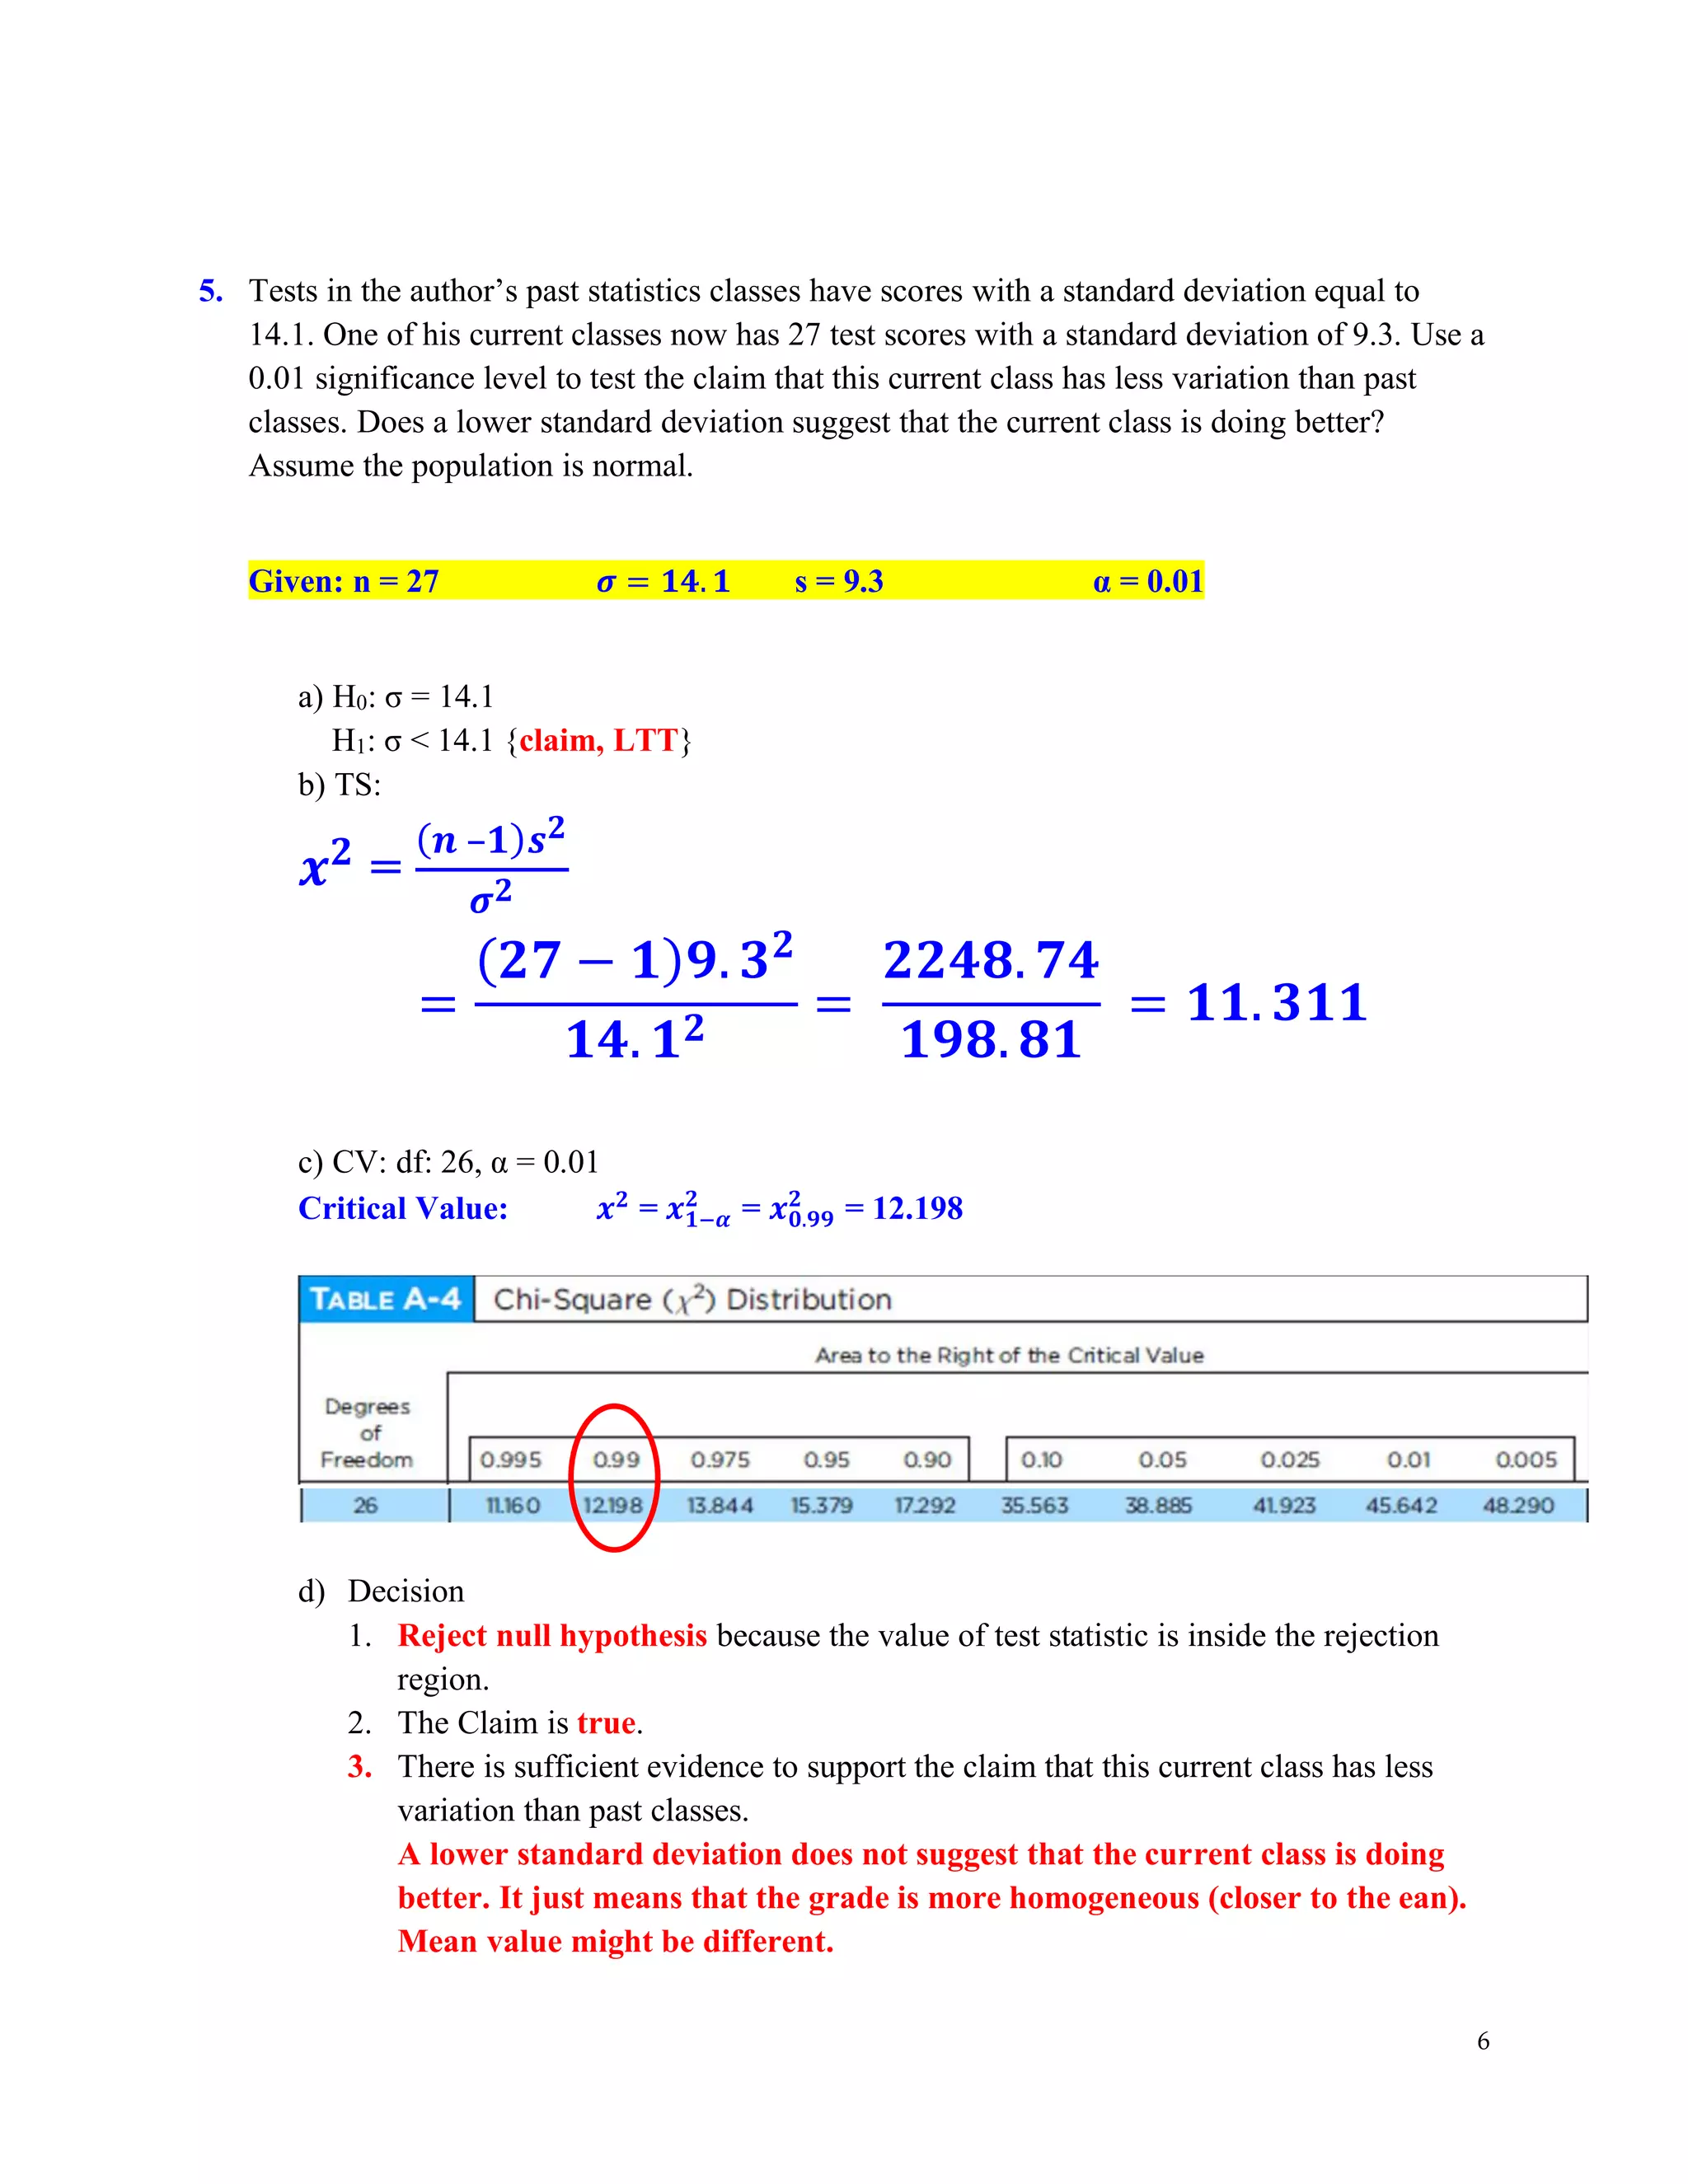
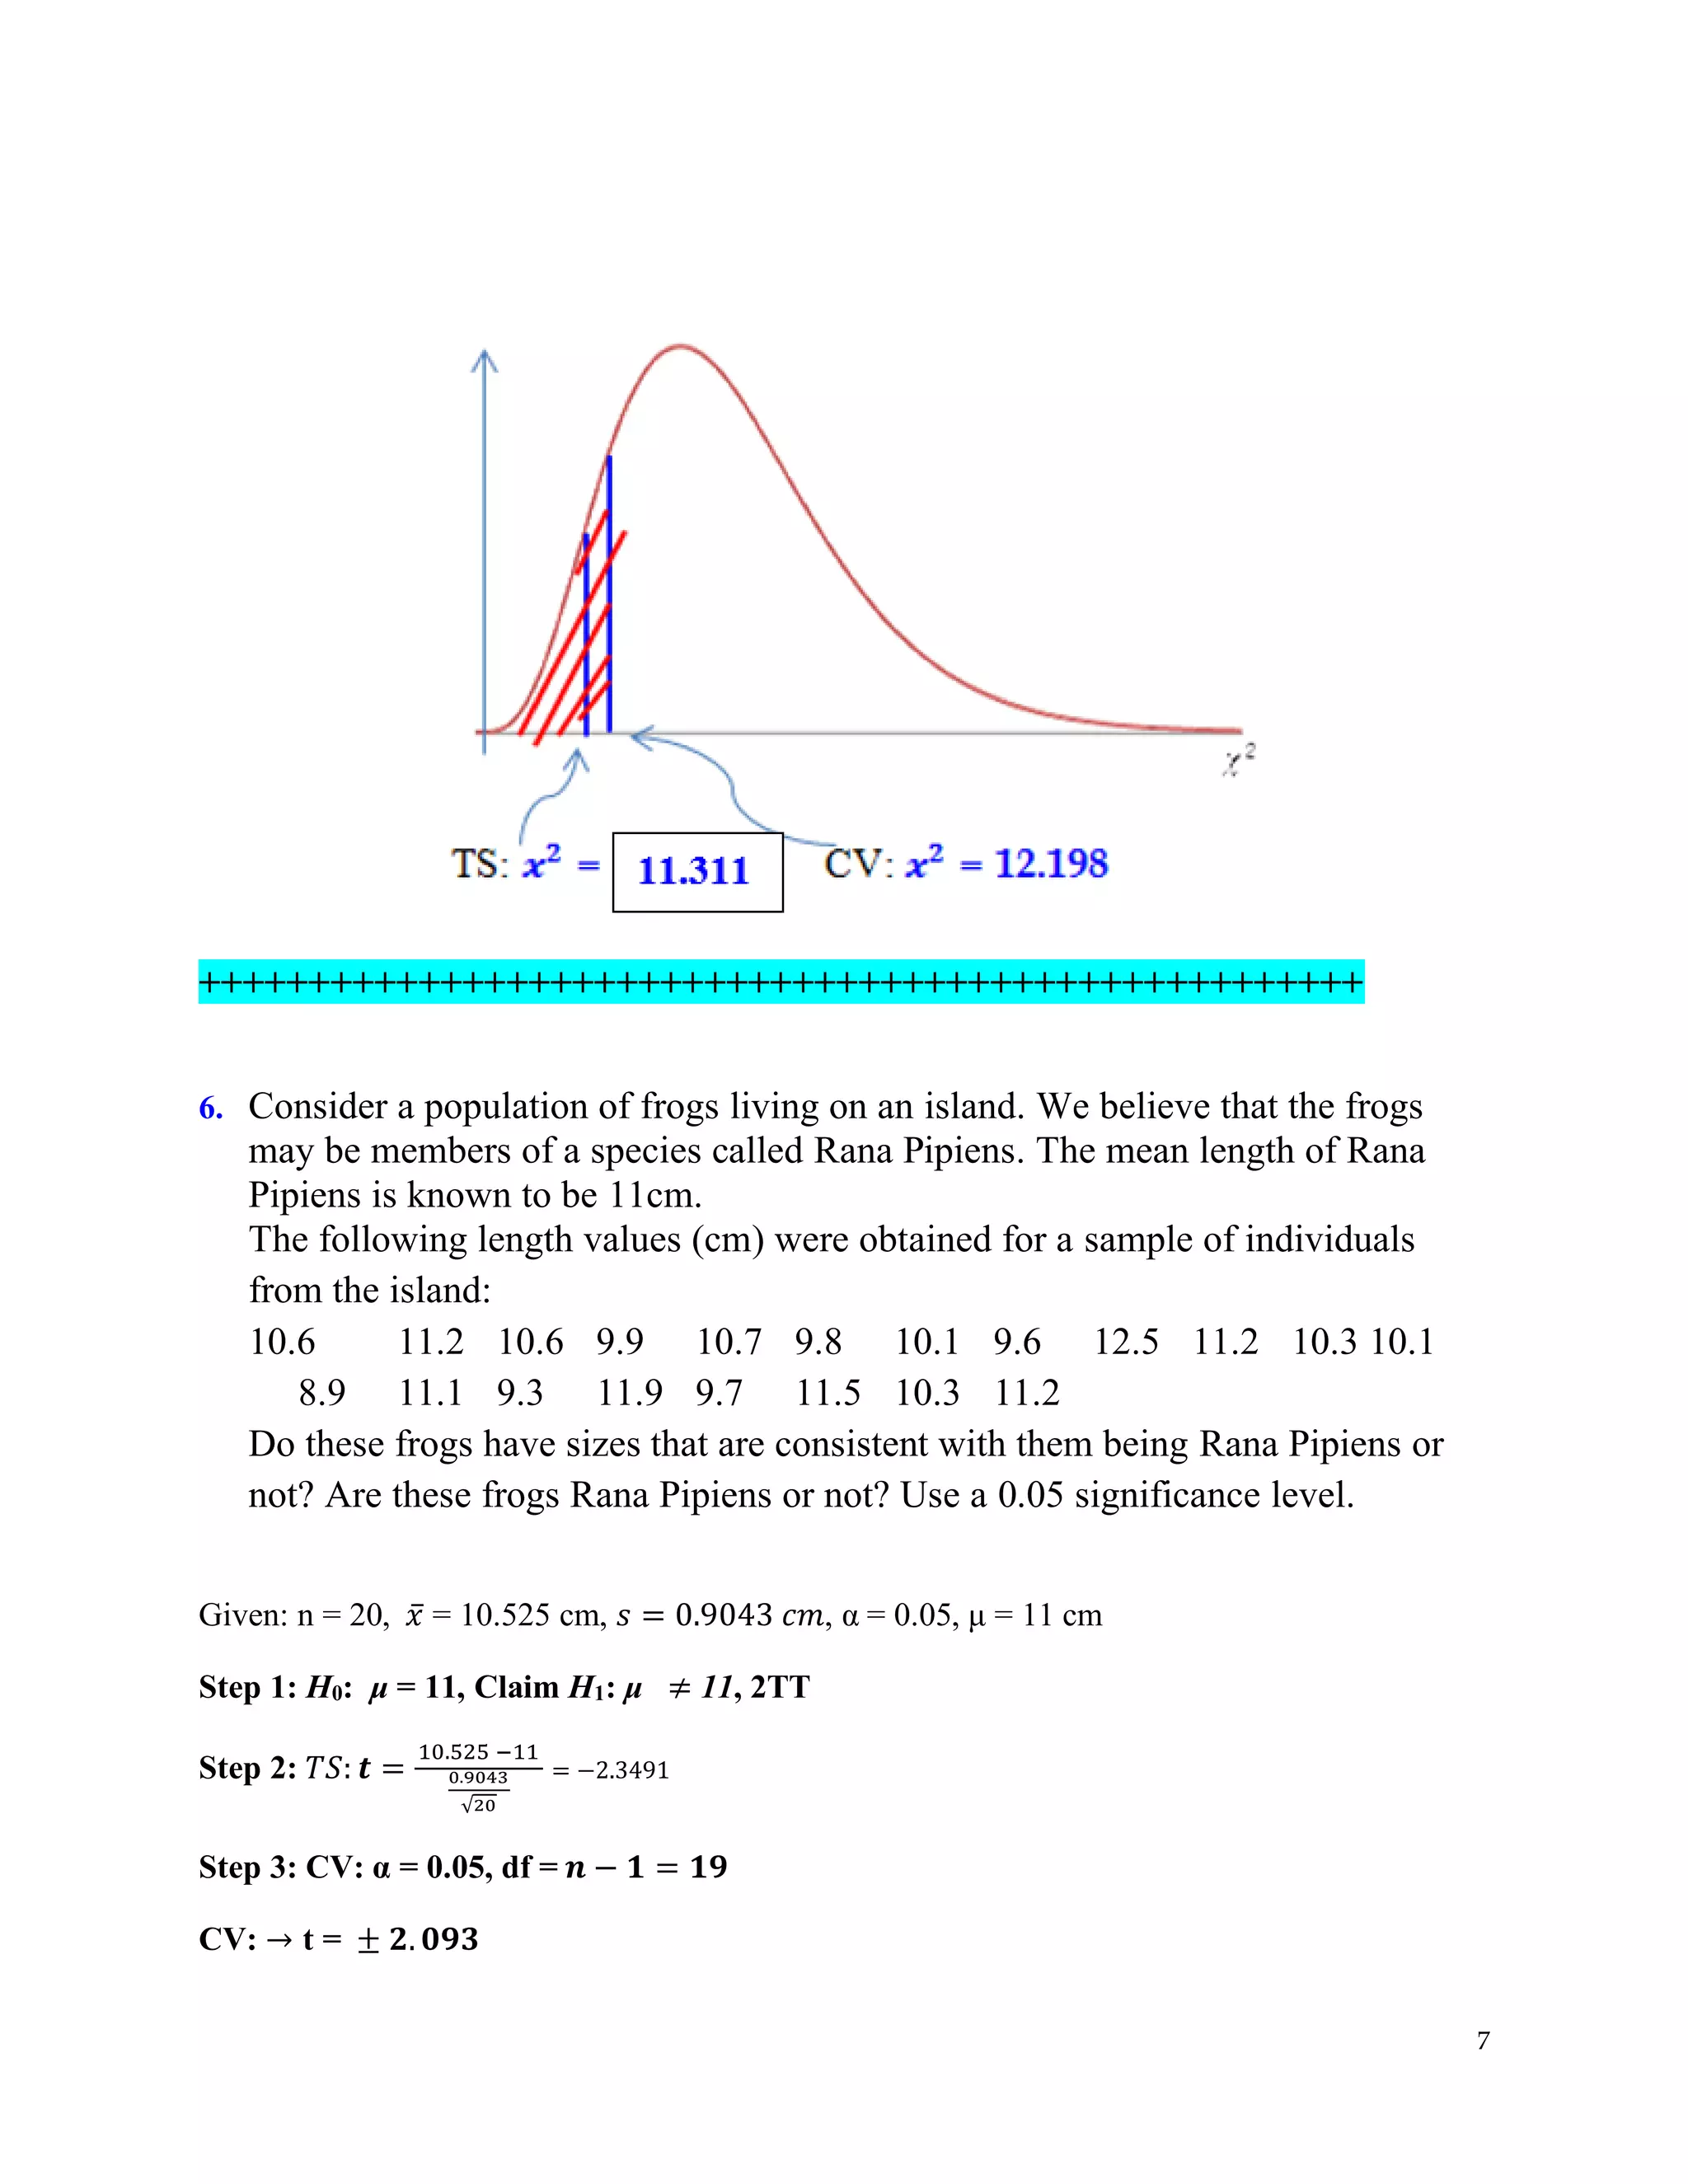
1
Statistics, Sample Test (Exam Review) Solution
Chapters 8: Hypothesis Testing
Chapters 9: Inferences from Two Samples
Chapters 8: Hypothesis Testing
1. Answer the following:
a. A test of hypothesis is always about a population parameter.
b. The observed value of a test statistic is the value calculated for a sample statistic.
ex) z scores, t distribution, chi-square (𝜒2
)
c. As the sample size gets larger, both type I and type II errors decrease.
d. Define type I error.
Rejecting a Null hypothesis when it is true (false positive)
e. Define type II error.
Failing to reject a Null hypothesis when it is false (false negative)
f. The value of α is called the probability of type I error
g. The value of β is called the probability of type II error
h. The value of 1-β is called the power of the test , correct decision ( probability of
rejecting a false hypothesis)
+++++++++++++++++++++++++++++++++++++++++++++++++++++
2. In 1990, 5.8% of job applicants who were tested for drugs failed the test. At the 0.01
significance level, test the claim that the failure rate is now lower if a simple random sample
of 1520 current job applicants results in 58 failures. Does the result suggest that fewer job
applicants now use drugs?
Given: p = 0.058, α = 0.01, n = 1520, x = 58
a. State the null and alternate hypothesis.
H0: p = 0.058
H1: p < 0.058 (claim, LTT = Left Tailed Test)
2
b. Calculate the value of test statistic (TS).
𝑝̂ = x/n = 58/1520 = 0.03816
𝑧 =
𝑝
̂−𝑝
√𝑝𝑞/𝑛
𝒁 =
𝟎.𝟎𝟑𝟖𝟐−𝟎.𝟎𝟓𝟖
√
(𝟎.𝟎𝟓𝟖)(𝟎.𝟗𝟒𝟐)
𝟏𝟓𝟐𝟎
= −
𝟎.𝟎𝟏𝟗𝟖
𝟎.𝟎𝟎𝟓𝟗𝟗𝟓
= −𝟑. 𝟑𝟎𝟗
c. Find the critical value (CV).
𝜶 = 0.01 (Left-tailed, it’s negative)
𝒛𝜶 = −𝒛𝟎.𝟎𝟏 = −𝟐. 𝟑𝟑 𝒐𝒓 − 𝟐. 𝟑𝟐𝟓
d. Make a decision. (3 parts)
1. Reject H0 (because the value of test statistic is inside the rejection region)
2. Claim is true
3. There is sufficient evidence to support the claim that the failure rate among job
applicants for drugs is now lower.
Result suggests that fewer job applicants now use drugs.
e. Find the p-value and make a decision. Is this decision in agreement with the
previous one?
−3.31 − 2.33
3
P-value = P (z < −𝟑. 𝟑𝟏 ) = 0.0005 P-value = 0.0005
0.0005 < 𝜶 = 0.01 – reject null hypothesis
this decision is in agreement with the previous one.
TS: Z = -3.31 0
f. What is type I error, what is the probability of making type I error?
Type I error: Rejecting H0 when H0 is actually true
Rejecting the claim that the failure rate of job applicants who were tested for drugs
is 5.8% when the percentage is actually 5.8%.
Probability of Type I error = = 0.01
++++++++++++++++++++++++++++++++++++++++++++++++++++
3. A sample of 54 bears has a mean weight of 182.9 lb. Let’s assume that the standard deviation
of weights of all such bears is known to be 121.8 lb, at α = 0.1. Is there enough evidence to
support the claim that the population mean of all such bear weights is less than 200 lb?
4
Given: n = 54, 𝒙
̅ = 182.9 lb, σ = 121.8 lb, α = 0.1 μ = 200 lb
a. State the null and alternate hypothesis.
H0: μ = 200
H1: μ < 200 (claim, LTT)
b. Calculate the value of test statistic.
/
x
Z
n


−
=
Z =
𝟏𝟖𝟐.𝟗 −𝟐𝟎𝟎
𝟏𝟐𝟏.𝟖
√𝟓𝟒
=
−𝟏𝟕.𝟏
𝟏𝟔.𝟓𝟕𝟒𝟖𝟖
= −𝟏. 𝟎𝟑𝟏𝟕
c. Find the critical value(s).
Since α = 0.1
→ 𝒛 = −1.285
d. Make a decision.
1. Fail to reject the null hypothesis because the value of test statistic is inside
the non-rejection region.
2. Claim is false.
3. There is not sufficient evidence to support the claim that the population mean
of all bear weights is less than 200 lb.
+++++++++++++++++++++++++++++++++++++++++++++++++++++
5
4. Sixteen new textbooks in the college bookstore, had prices with a mean of $70.41 and a
standard deviation of $19.70. Use a 0.05 significance level to test the claim that the mean
price of a textbook at this college is less than $75? Assume Normal Population.
Given: n = 16 𝒙
̅ = $70.41 𝒔 = $𝟏𝟗. 𝟕𝟎 α = 0.05 μ = $75
a) H0: μ = 75
H1: μ < 75 (claim, LTT)
b) TS: (Note σ is missing, T-distribution is used )
/
x
t
s n

−
=
𝒕 =
𝟕𝟎. 𝟒𝟏 − 𝟕𝟓
𝟏𝟗. 𝟕𝟎
√𝟏𝟔
= −
𝟒. 𝟓𝟗
𝟒. 𝟗𝟐𝟓
= −𝟎. 𝟗𝟑𝟐𝟎
c) CV: Since α = 0.05 & 𝒅𝒇 = 𝒏 − 𝟏 = 𝟏𝟓 t = −1.753
d) Decision:
1. Fail to reject the null hypothesis because the value of test statistic is inside the non-
rejection region.
2. Claim is false.
3. There is not a sufficient evidence to support the claim that the mean price of a textbook
at this college is less than $75.
+++++++++++++++++++++++++++++++++++++++++++++++++++++
6
5. Tests in the author’s past statistics classes have scores with a standard deviation equal to
14.1. One of his current classes now has 27 test scores with a standard deviation of 9.3. Use a
0.01 significance level to test the claim that this current class has less variation than past
classes. Does a lower standard deviation suggest that the current class is doing better?
Assume the population is normal.
Given: n = 27 𝝈 = 𝟏𝟒. 𝟏 s = 9.3 α = 0.01
a) H0: σ = 14.1
H1: σ < 14.1 {claim, LTT}
b) TS:
𝒙𝟐
=
(𝒏 –𝟏)𝒔𝟐
𝝈𝟐
=
(𝟐𝟕 − 𝟏)𝟗. 𝟑𝟐
𝟏𝟒. 𝟏𝟐
=
𝟐𝟐𝟒𝟖. 𝟕𝟒
𝟏𝟗𝟖. 𝟖𝟏
= 𝟏𝟏. 𝟑𝟏𝟏
c) CV: df: 26, α = 0.01
Critical Value: 𝒙𝟐
= 𝒙𝟏−𝜶
𝟐
= 𝒙𝟎.𝟗𝟗
𝟐
= 12.198
d) Decision
1. Reject null hypothesis because the value of test statistic is inside the rejection
region.
2. The Claim is true.
3. There is sufficient evidence to support the claim that this current class has less
variation than past classes.
A lower standard deviation does not suggest that the current class is doing
better. It just means that the grade is more homogeneous (closer to the ean).
Mean value might be different.
7
+++++++++++++++++++++++++++++++++++++++++++++++++++++
6. Consider a population of frogs living on an island. We believe that the frogs
may be members of a species called Rana Pipiens. The mean length of Rana
Pipiens is known to be 11cm.
The following length values (cm) were obtained for a sample of individuals
from the island:
10.6 11.2 10.6 9.9 10.7 9.8 10.1 9.6 12.5 11.2 10.3 10.1
8.9 11.1 9.3 11.9 9.7 11.5 10.3 11.2
Do these frogs have sizes that are consistent with them being Rana Pipiens or
not? Are these frogs Rana Pipiens or not? Use a 0.05 significance level.
Given: n = 20, 𝑥̅ = 10.525 cm, 𝑠 = 0.9043 𝑐𝑚, α = 0.05, μ = 11 cm
Step 1: H0: μ = 11, Claim H1: μ ≠ 11, 2TT
Step 2: 𝑇𝑆: 𝒕 =
10.525 −11
0.9043
√20
= −2.3491
Step 3: CV: α = 0.05, df = 𝒏 − 𝟏 = 𝟏𝟗
CV: → t = ± 𝟐. 𝟎𝟗𝟑
8
TS: −𝟐. 𝟑𝟒𝟗𝟏 𝑪𝑽: −𝟐. 𝟎𝟗𝟑 CV: 𝟐. 𝟎𝟗𝟑
Step 4: Decision:
1. Reject the null hypothesis
2. Claim is false.
3. There is not sufficient evidence to support the claim that these frogs have sizes that are
consistent with them being Rana Pipiens.
Conclusion: These are not Rana Pipiens.
9
Statistics, Sample Test (Exam Review)
Module 4: Chapters 8 & 9 Review
Chapters 9: Inferences from Two Samples
1. Among 843 smoking employees of hospitals with the smoking ban, 56 quit smoking in one
year after the ban. Among 703 smoking employees from workplaces without the smoking
ban, 27 quit smoking in one year.
Given: 𝑛1 = 843, 𝑥1 = 56, 𝑛2 = 703, 𝑥2 = 27
a. Is there a significant difference between the two proportions? Use a 0.01 significance level
1 2
1 2
56 27
0.0537, 1 0.9463
843 703
x x
p
n n
q p
+
=
+
+
= = = − =
+
𝑝̂1 =
𝑥1
𝑛1
=
56
843
= 0.0664,𝑞
̂1 = 1 − 𝑝̂1 = 0.9336
𝑝̂2 =
𝑥2
𝑛2
=
27
703
= 0.0384, 𝑞
̂2 = 1 − 𝑝̂2 = 0.9616
1. H0: p1 = p2
H1: p1 ≠ p2 (2TT), Claim
2. TS:
10
𝑧 =
𝑝̂1 − 𝑝̂2
√
𝑝̅𝑞
̅
𝑛1
+
𝑝̅𝑞
̅
𝑛2
= 2.4319
3. CV:
α = 0.01, Z = ± 2.575
4. Decision
i) Fail to reject null hypothesis
ii) The claim is false
iii) there is not a significant difference between the two proportions
b. Construct the 99% confidence interval for the difference between the two proportions.
(𝑝̂1 – 𝑝̂2) – E < p1 – p2 < (𝑝̂1 – 𝑝̂2) + E
E = Zα/2 √
𝑝
̂1 𝑞
̂1
𝑛1
+
𝑝
̂2 𝑞
̂2
𝑛2
=
2.575√
(0.066429)(0.9335571)
843
+
(0.038407)(0.961593)
703
2.575 √(0.000073566) + (0.000052534) = 2.575 (0.11229) = 0.0289
𝑝̂1 – 𝑝̂2 = 0.066429 – 0.038407 = 0.028022
11
99% confidence interval estimate:
(𝑝̂1 – 𝑝̂2) – E < p1 – p2 < (𝑝̂1 – 𝑝̂2) + E
0.028022 – 0.0289 < p1 – p2 < 0.028022 + 0.0289
−0.000878 < p1 – p2 < 0.056922
Because the confidence interval limits contain zero, there is not a significant difference between
the 2 proportions (Fail to reject the null hypothesis).
2. Company “A” claims that its yogurt cups contain, on average fewer calories than that of a
competitor. A sample of 50 such yogurt cups of company “A” produced an average of 141
calories per cup with a standard deviation of 5.4 calories. A sample of 40 yogurt cups of a
rival company “B” produced an average of 144 calories per cup with a standard deviation of
6.3 calories.
a. Assuming that the calories of the yogurt cups for company “A” and company “B” have
different variances, use a 0.01 significance level to test the claim.
Given:
Company A Company B
df (smaller of n1 -1 and n2 -1) = 39
α = 0.01
n1 = 50 n2 = 40
𝒙
̅1 = 141 cal. 𝒙
̅2 = 144 cal.
s1 = 5.4 cal. s2 = 6.3 cal.
1. H0: μ1 = μ2
H1: μ1 < μ2 (claim, LTT)
2. TS:
𝒕 =
(𝒙
̅𝟏− 𝒙
̅𝟐) − (𝝁𝟏− 𝝁𝟐)
√
𝒔𝟏
𝟐
𝒏𝟏
+
𝒔𝟐
𝟐
𝒏𝟐
=
12
(𝟏𝟒𝟏−𝟏𝟒𝟒)−𝟎
√𝟐𝟗.𝟏𝟔/𝟓𝟎+𝟑𝟗.𝟔𝟗/𝟒𝟎
=−𝟐. 𝟑𝟗𝟎𝟏
3. CV:
α = 0.01, df = 39
t = − 2.426 (critical value)
4. Decision
i) fail to reject the null hypothesis
ii) Claim is false
iii) There is not sufficient evidence to support the claim that company A’s
yogurt cups contain, on average fewer calories than that of a
competitor.
b. Calculate the p-value for the test of previous part and make a decision. Is decision in
agreement with the previous one?
Area to the left of TS: t = − 2.3901
df = 39 – 2.426 < TS: t = -2.3901 < – 2.023
Area in one tail : 0.01 < p-value < 0.025
p-value > α = 0.01,
we fail to reject the null hypothesis (therefore, the
claim is false)
Decision is in agreement with the previous part.
13
c. Make the 98% confidence intervals for the difference between the two means.
(𝑥̅1 – 𝑥̅2) ± 𝐸
E = tα/2 √
𝑠1
2
𝑛1
+
𝑠2
2
𝑛2
= 2.426 √
(5.4)2
50
+
(6.3)2
40
E = 2.426 √(0.5832) + (0.99225) = 2.426 (1.255169) = 3.04504
(𝑥̅1 – 𝑥̅2) – E < 𝜇1 – 𝜇2 < (𝑥̅1 – 𝑥̅2) + E
- 3 – 3.04504 < 𝜇1 – 𝜇2 < - 3 + 3.04504
- 6.04504 < 𝜇1 – 𝜇2 < 0.04504
Because the confidence interval limits contain zero, there is not a significant difference
between the 2 means (Fail to reject the null hypothesis).
3. Assuming that the calories of the yogurt cups for company “A” and company “B” have
equal variances, repeat the previous question.
Given:
Company A Company B
Df = ( n1 -1 + n2 -1)
= 88
α = 0.01
n1 = 50 n2 = 40
𝒙
̅1 = 141 cal. 𝒙
̅2 = 144 cal.
s1 = 5.4 cal. s2 = 6.3 cal.
a. Test of Hypothesis:
1. H0: μ1 = μ2
H1: μ1 < μ2 (claim, LTT)
2. TS:
14
𝑠𝑝
2
=
(𝑛1 − 1)𝑠1
2
+ (𝑛2 − 1)𝑠2
2
(𝑛1 − 1) + (𝑛2 − 1)
=
49 (5.4)2+ 39 (6.3)2
49+39
=
1428.84+1547.91
88
= 33.8267
t =
(𝑥̅1− 𝑥̅2) − (𝜇1− 𝜇2)
√
𝑠𝑝
2
𝑛1
+
𝑠𝑝
2
𝑛2
=
(141−144)−0
√0.6765+0.8457
=
− 3
1.23376
= −2.4316
3. CV:
df = n1 + n2 – 2 = 50 + 40 – 2 = 88 ≈ 90 (when using t-table)
α = 0.01, CV: t = -2.368
4. Decision
i) Reject null hypothesis because the value of test statistic is
inside the rejection region
ii) claim is true
iii) there is sufficient evidence to support the claim that company
A’s yogurt cups contain on average less calories than that of its
competitors.
b. Area to the left of TS: t = – 2.4316
df = 90 – 2.632 < t = – 2.4316 < – 2.368
Area in one tail: 0.005 < p-value < 0.01
p-value less than 0.01, the result agrees with part a.
c. 98% Confidence Interval:
15
E = tα/2 √
𝑠𝑝
2
𝑛1
+
𝑠𝑝
2
𝑛2
= 2.368(1.23376) = 2.9216
(𝑥̅1 – 𝑥̅2) – E < 𝜇1 – 𝜇2 < (𝑥̅1 – 𝑥̅2) + E
(141 – 144) – 2.9216 < μ1 – μ2 < (141 – 144) + 2.9216
–5.9216 < μ1 – μ2 < –0.0784
Because the confidence interval limits do not contain zero, there is a significant
difference between the 2 means. Because the confidence interval limits are both
negative, it indicates that company A’s yogurt cups contain on average less calories
than that of its competitors (Reject null hypothesis).
4. Test a claim that weights of male college students have a larger variance than female college
students. Use a significance level of 0.05 and assume the populations are normal.
: 31, 168, 28,
: 29, 125, 25
Males n x s
females n x s
= = =
= = =
α = 0.05, normal population
1. H0: σ1
2
= σ2
2
H1: σ1
2
> σ2
2
(claim, RTT)
2. TS
F = s1
2
/s2
2
F = 282
/252
= 1.2544
3. CV:
df1: n1 – 1 = 30 (numerator degrees of freedom) df2: n2 – 1 = 28
(denominator degrees of freedom)
CV: F = 1.8687
16
4. Decision
a) Fail to reject the null hypothesis because the value of test statistic falls
in the non-rejection region
b) The claim is false
c) There is not sufficient evidence to support the claim that weights of male
college students have a larger variance than female college students
17
5. Directional asymmetry (DA) is a phenomenon whereby in a population one side of each
organism is consistently larger than the other (I.E., left larger than right). An evolutionary
biologist studying DA measures the length of the left and right wings of a sample of
Drosophila (a type of flies, whose members are often called “small fruit flies”) collected
from nature and she gets these data.
a. The researcher decides to perform a two-sample t test to determine whether the mean
wing differs between the left and right sides of these flies. What type of t test will
she do? α = 0.05
b. Find the 90% confidence interval for the difference between the means.
Part a:
The researcher decides to perform a two-sample t test to determine whether the mean wing
differs between the left and right sides of these flies. What type of t test will she do? α = 0.05
We use paired t test.
18
𝐷
̄ =
∑ 𝐷
𝑛
= −0.0906
𝑠𝐷 = √
𝑛 ∑ 𝐷2 − (∑ 𝐷)2
𝑛(𝑛 − 1)
= 0.2283
Step 1: H0: μD = 0 and H1: μD  0 (claim), 2TT
Step 2: 𝑻𝑺: 𝑡 =
𝐷
̄ −𝜇𝐷
𝑠𝐷/√𝑛
=
−0.09059 − 0
0.22829/√17
= −1.636
Step 3: CV: α = 0.05, df= 17 − 1 = 16
→ 𝑡 = ±2.120
Step 4: Decision:
a. Do not reject H0
b. The claim is False
c. There is not sufficient evidence to support the claim that the mean wing
differs between the left and right sides of these flies.
She cannot conclude that this population possesses DA because the mean
lengths of the wings on the left and rights sides do not differ significantly.
Part b:
Find the 90% confidence interval for the difference between the means.
𝐷
̄ ± 𝐸
𝐸 = 𝑡𝛼/2
𝑠𝐷
√𝑛
𝑏)𝐸 = 2.120 ⋅
0.2283
√17
= 0.1174
19
𝐷
̄ ± 𝐸 →
→ −0.0906 ± 0.1174
−0.208 < 𝜇𝐷 < 0.268
Since 0 is contained in the interval, the decision is to not reject the null
hypothesis H0
: μD
= 0.
6. An ecologist is concerned with whether pollution entering part of a preserve area is compromising the health and growth of
an endangered species of snake. To determine this, he decides to measure the length of a set of mature adults from the
polluted area and an unpolluted area. The researcher decides to perform a two-sample t test to determine whether the
mean length of these snakes differs between these two areas. α = 0.05
Length measurements
unpolluted area (cm)
Length measurements
polluted area (cm)
1 27 25
2 28 26
3 30 28
4 29 27
5 28 23
6 28 21
7 28 19
8 31 28
9 25 23
10 23 24
11 21 26
12 26 28
13 28 25
14 30 26
15 27 25
16 21
20
17 24
Sample SD 2.658320272 2.620619594
Mean 27.26666667 24.64705882
Size: n 15 17
Step 1: H0: μ1 = μ2 & H1: μ1 ≠ μ2 , claim, 2TT
Step 2: 𝑇𝑆: 𝑡 =
27.267−24.647
√2.6582
50
+
2.6212
40
=
2.62
0.093498
= 2.8022
Step 3: CV: α = 0.05, df = smaller of n1 – 1 or n2 – 1 = 15 – 1 =14
→ 𝑡 = ±2.145
Step 4: Decision:
a. Reject H0
b. The claim is True
c. There is enough evidence to support the claim that the mean length of these snakes
differs in these areas. It is larger in the unpolluted area since TS is positive.
Note: Technology / Calculator results are different.
𝑑𝑓 =
(𝐴+𝐵)2
𝐴2
𝑛1−1
+
𝐵2
𝑛2−1
, A =
𝑠1
2
𝑛1
, 𝐵 =
𝑠2
2
𝑛2
→ 29.38 → 29
Step 3: CV: α = 0.05,
df = 29→ 𝑡 = ±2.045,
𝑃 − 𝑣𝑙𝑢𝑒 = 0.009 < 𝛼 = 0.05
−𝟐. 𝟏𝟒𝟓 𝟐. 𝟏𝟒𝟓 TS: 𝟐. 𝟖𝟎𝟐𝟐

Solution to the practice test ch 8 hypothesis testing ch 9 two populations

  • 1.
    1 Statistics, Sample Test(Exam Review) Solution Chapters 8: Hypothesis Testing Chapters 9: Inferences from Two Samples Chapters 8: Hypothesis Testing 1. Answer the following: a. A test of hypothesis is always about a population parameter. b. The observed value of a test statistic is the value calculated for a sample statistic. ex) z scores, t distribution, chi-square (𝜒2 ) c. As the sample size gets larger, both type I and type II errors decrease. d. Define type I error. Rejecting a Null hypothesis when it is true (false positive) e. Define type II error. Failing to reject a Null hypothesis when it is false (false negative) f. The value of α is called the probability of type I error g. The value of β is called the probability of type II error h. The value of 1-β is called the power of the test , correct decision ( probability of rejecting a false hypothesis) +++++++++++++++++++++++++++++++++++++++++++++++++++++ 2. In 1990, 5.8% of job applicants who were tested for drugs failed the test. At the 0.01 significance level, test the claim that the failure rate is now lower if a simple random sample of 1520 current job applicants results in 58 failures. Does the result suggest that fewer job applicants now use drugs? Given: p = 0.058, α = 0.01, n = 1520, x = 58 a. State the null and alternate hypothesis. H0: p = 0.058 H1: p < 0.058 (claim, LTT = Left Tailed Test)
  • 2.
    2 b. Calculate thevalue of test statistic (TS). 𝑝̂ = x/n = 58/1520 = 0.03816 𝑧 = 𝑝 ̂−𝑝 √𝑝𝑞/𝑛 𝒁 = 𝟎.𝟎𝟑𝟖𝟐−𝟎.𝟎𝟓𝟖 √ (𝟎.𝟎𝟓𝟖)(𝟎.𝟗𝟒𝟐) 𝟏𝟓𝟐𝟎 = − 𝟎.𝟎𝟏𝟗𝟖 𝟎.𝟎𝟎𝟓𝟗𝟗𝟓 = −𝟑. 𝟑𝟎𝟗 c. Find the critical value (CV). 𝜶 = 0.01 (Left-tailed, it’s negative) 𝒛𝜶 = −𝒛𝟎.𝟎𝟏 = −𝟐. 𝟑𝟑 𝒐𝒓 − 𝟐. 𝟑𝟐𝟓 d. Make a decision. (3 parts) 1. Reject H0 (because the value of test statistic is inside the rejection region) 2. Claim is true 3. There is sufficient evidence to support the claim that the failure rate among job applicants for drugs is now lower. Result suggests that fewer job applicants now use drugs. e. Find the p-value and make a decision. Is this decision in agreement with the previous one? −3.31 − 2.33
  • 3.
    3 P-value = P(z < −𝟑. 𝟑𝟏 ) = 0.0005 P-value = 0.0005 0.0005 < 𝜶 = 0.01 – reject null hypothesis this decision is in agreement with the previous one. TS: Z = -3.31 0 f. What is type I error, what is the probability of making type I error? Type I error: Rejecting H0 when H0 is actually true Rejecting the claim that the failure rate of job applicants who were tested for drugs is 5.8% when the percentage is actually 5.8%. Probability of Type I error = = 0.01 ++++++++++++++++++++++++++++++++++++++++++++++++++++ 3. A sample of 54 bears has a mean weight of 182.9 lb. Let’s assume that the standard deviation of weights of all such bears is known to be 121.8 lb, at α = 0.1. Is there enough evidence to support the claim that the population mean of all such bear weights is less than 200 lb?
  • 4.
    4 Given: n =54, 𝒙 ̅ = 182.9 lb, σ = 121.8 lb, α = 0.1 μ = 200 lb a. State the null and alternate hypothesis. H0: μ = 200 H1: μ < 200 (claim, LTT) b. Calculate the value of test statistic. / x Z n   − = Z = 𝟏𝟖𝟐.𝟗 −𝟐𝟎𝟎 𝟏𝟐𝟏.𝟖 √𝟓𝟒 = −𝟏𝟕.𝟏 𝟏𝟔.𝟓𝟕𝟒𝟖𝟖 = −𝟏. 𝟎𝟑𝟏𝟕 c. Find the critical value(s). Since α = 0.1 → 𝒛 = −1.285 d. Make a decision. 1. Fail to reject the null hypothesis because the value of test statistic is inside the non-rejection region. 2. Claim is false. 3. There is not sufficient evidence to support the claim that the population mean of all bear weights is less than 200 lb. +++++++++++++++++++++++++++++++++++++++++++++++++++++
  • 5.
    5 4. Sixteen newtextbooks in the college bookstore, had prices with a mean of $70.41 and a standard deviation of $19.70. Use a 0.05 significance level to test the claim that the mean price of a textbook at this college is less than $75? Assume Normal Population. Given: n = 16 𝒙 ̅ = $70.41 𝒔 = $𝟏𝟗. 𝟕𝟎 α = 0.05 μ = $75 a) H0: μ = 75 H1: μ < 75 (claim, LTT) b) TS: (Note σ is missing, T-distribution is used ) / x t s n  − = 𝒕 = 𝟕𝟎. 𝟒𝟏 − 𝟕𝟓 𝟏𝟗. 𝟕𝟎 √𝟏𝟔 = − 𝟒. 𝟓𝟗 𝟒. 𝟗𝟐𝟓 = −𝟎. 𝟗𝟑𝟐𝟎 c) CV: Since α = 0.05 & 𝒅𝒇 = 𝒏 − 𝟏 = 𝟏𝟓 t = −1.753 d) Decision: 1. Fail to reject the null hypothesis because the value of test statistic is inside the non- rejection region. 2. Claim is false. 3. There is not a sufficient evidence to support the claim that the mean price of a textbook at this college is less than $75. +++++++++++++++++++++++++++++++++++++++++++++++++++++
  • 6.
    6 5. Tests inthe author’s past statistics classes have scores with a standard deviation equal to 14.1. One of his current classes now has 27 test scores with a standard deviation of 9.3. Use a 0.01 significance level to test the claim that this current class has less variation than past classes. Does a lower standard deviation suggest that the current class is doing better? Assume the population is normal. Given: n = 27 𝝈 = 𝟏𝟒. 𝟏 s = 9.3 α = 0.01 a) H0: σ = 14.1 H1: σ < 14.1 {claim, LTT} b) TS: 𝒙𝟐 = (𝒏 –𝟏)𝒔𝟐 𝝈𝟐 = (𝟐𝟕 − 𝟏)𝟗. 𝟑𝟐 𝟏𝟒. 𝟏𝟐 = 𝟐𝟐𝟒𝟖. 𝟕𝟒 𝟏𝟗𝟖. 𝟖𝟏 = 𝟏𝟏. 𝟑𝟏𝟏 c) CV: df: 26, α = 0.01 Critical Value: 𝒙𝟐 = 𝒙𝟏−𝜶 𝟐 = 𝒙𝟎.𝟗𝟗 𝟐 = 12.198 d) Decision 1. Reject null hypothesis because the value of test statistic is inside the rejection region. 2. The Claim is true. 3. There is sufficient evidence to support the claim that this current class has less variation than past classes. A lower standard deviation does not suggest that the current class is doing better. It just means that the grade is more homogeneous (closer to the ean). Mean value might be different.
  • 7.
    7 +++++++++++++++++++++++++++++++++++++++++++++++++++++ 6. Consider apopulation of frogs living on an island. We believe that the frogs may be members of a species called Rana Pipiens. The mean length of Rana Pipiens is known to be 11cm. The following length values (cm) were obtained for a sample of individuals from the island: 10.6 11.2 10.6 9.9 10.7 9.8 10.1 9.6 12.5 11.2 10.3 10.1 8.9 11.1 9.3 11.9 9.7 11.5 10.3 11.2 Do these frogs have sizes that are consistent with them being Rana Pipiens or not? Are these frogs Rana Pipiens or not? Use a 0.05 significance level. Given: n = 20, 𝑥̅ = 10.525 cm, 𝑠 = 0.9043 𝑐𝑚, α = 0.05, μ = 11 cm Step 1: H0: μ = 11, Claim H1: μ ≠ 11, 2TT Step 2: 𝑇𝑆: 𝒕 = 10.525 −11 0.9043 √20 = −2.3491 Step 3: CV: α = 0.05, df = 𝒏 − 𝟏 = 𝟏𝟗 CV: → t = ± 𝟐. 𝟎𝟗𝟑
  • 8.
    8 TS: −𝟐. 𝟑𝟒𝟗𝟏𝑪𝑽: −𝟐. 𝟎𝟗𝟑 CV: 𝟐. 𝟎𝟗𝟑 Step 4: Decision: 1. Reject the null hypothesis 2. Claim is false. 3. There is not sufficient evidence to support the claim that these frogs have sizes that are consistent with them being Rana Pipiens. Conclusion: These are not Rana Pipiens.
  • 9.
    9 Statistics, Sample Test(Exam Review) Module 4: Chapters 8 & 9 Review Chapters 9: Inferences from Two Samples 1. Among 843 smoking employees of hospitals with the smoking ban, 56 quit smoking in one year after the ban. Among 703 smoking employees from workplaces without the smoking ban, 27 quit smoking in one year. Given: 𝑛1 = 843, 𝑥1 = 56, 𝑛2 = 703, 𝑥2 = 27 a. Is there a significant difference between the two proportions? Use a 0.01 significance level 1 2 1 2 56 27 0.0537, 1 0.9463 843 703 x x p n n q p + = + + = = = − = + 𝑝̂1 = 𝑥1 𝑛1 = 56 843 = 0.0664,𝑞 ̂1 = 1 − 𝑝̂1 = 0.9336 𝑝̂2 = 𝑥2 𝑛2 = 27 703 = 0.0384, 𝑞 ̂2 = 1 − 𝑝̂2 = 0.9616 1. H0: p1 = p2 H1: p1 ≠ p2 (2TT), Claim 2. TS:
  • 10.
    10 𝑧 = 𝑝̂1 −𝑝̂2 √ 𝑝̅𝑞 ̅ 𝑛1 + 𝑝̅𝑞 ̅ 𝑛2 = 2.4319 3. CV: α = 0.01, Z = ± 2.575 4. Decision i) Fail to reject null hypothesis ii) The claim is false iii) there is not a significant difference between the two proportions b. Construct the 99% confidence interval for the difference between the two proportions. (𝑝̂1 – 𝑝̂2) – E < p1 – p2 < (𝑝̂1 – 𝑝̂2) + E E = Zα/2 √ 𝑝 ̂1 𝑞 ̂1 𝑛1 + 𝑝 ̂2 𝑞 ̂2 𝑛2 = 2.575√ (0.066429)(0.9335571) 843 + (0.038407)(0.961593) 703 2.575 √(0.000073566) + (0.000052534) = 2.575 (0.11229) = 0.0289 𝑝̂1 – 𝑝̂2 = 0.066429 – 0.038407 = 0.028022
  • 11.
    11 99% confidence intervalestimate: (𝑝̂1 – 𝑝̂2) – E < p1 – p2 < (𝑝̂1 – 𝑝̂2) + E 0.028022 – 0.0289 < p1 – p2 < 0.028022 + 0.0289 −0.000878 < p1 – p2 < 0.056922 Because the confidence interval limits contain zero, there is not a significant difference between the 2 proportions (Fail to reject the null hypothesis). 2. Company “A” claims that its yogurt cups contain, on average fewer calories than that of a competitor. A sample of 50 such yogurt cups of company “A” produced an average of 141 calories per cup with a standard deviation of 5.4 calories. A sample of 40 yogurt cups of a rival company “B” produced an average of 144 calories per cup with a standard deviation of 6.3 calories. a. Assuming that the calories of the yogurt cups for company “A” and company “B” have different variances, use a 0.01 significance level to test the claim. Given: Company A Company B df (smaller of n1 -1 and n2 -1) = 39 α = 0.01 n1 = 50 n2 = 40 𝒙 ̅1 = 141 cal. 𝒙 ̅2 = 144 cal. s1 = 5.4 cal. s2 = 6.3 cal. 1. H0: μ1 = μ2 H1: μ1 < μ2 (claim, LTT) 2. TS: 𝒕 = (𝒙 ̅𝟏− 𝒙 ̅𝟐) − (𝝁𝟏− 𝝁𝟐) √ 𝒔𝟏 𝟐 𝒏𝟏 + 𝒔𝟐 𝟐 𝒏𝟐 =
  • 12.
    12 (𝟏𝟒𝟏−𝟏𝟒𝟒)−𝟎 √𝟐𝟗.𝟏𝟔/𝟓𝟎+𝟑𝟗.𝟔𝟗/𝟒𝟎 =−𝟐. 𝟑𝟗𝟎𝟏 3. CV: α= 0.01, df = 39 t = − 2.426 (critical value) 4. Decision i) fail to reject the null hypothesis ii) Claim is false iii) There is not sufficient evidence to support the claim that company A’s yogurt cups contain, on average fewer calories than that of a competitor. b. Calculate the p-value for the test of previous part and make a decision. Is decision in agreement with the previous one? Area to the left of TS: t = − 2.3901 df = 39 – 2.426 < TS: t = -2.3901 < – 2.023 Area in one tail : 0.01 < p-value < 0.025 p-value > α = 0.01, we fail to reject the null hypothesis (therefore, the claim is false) Decision is in agreement with the previous part.
  • 13.
    13 c. Make the98% confidence intervals for the difference between the two means. (𝑥̅1 – 𝑥̅2) ± 𝐸 E = tα/2 √ 𝑠1 2 𝑛1 + 𝑠2 2 𝑛2 = 2.426 √ (5.4)2 50 + (6.3)2 40 E = 2.426 √(0.5832) + (0.99225) = 2.426 (1.255169) = 3.04504 (𝑥̅1 – 𝑥̅2) – E < 𝜇1 – 𝜇2 < (𝑥̅1 – 𝑥̅2) + E - 3 – 3.04504 < 𝜇1 – 𝜇2 < - 3 + 3.04504 - 6.04504 < 𝜇1 – 𝜇2 < 0.04504 Because the confidence interval limits contain zero, there is not a significant difference between the 2 means (Fail to reject the null hypothesis). 3. Assuming that the calories of the yogurt cups for company “A” and company “B” have equal variances, repeat the previous question. Given: Company A Company B Df = ( n1 -1 + n2 -1) = 88 α = 0.01 n1 = 50 n2 = 40 𝒙 ̅1 = 141 cal. 𝒙 ̅2 = 144 cal. s1 = 5.4 cal. s2 = 6.3 cal. a. Test of Hypothesis: 1. H0: μ1 = μ2 H1: μ1 < μ2 (claim, LTT) 2. TS:
  • 14.
    14 𝑠𝑝 2 = (𝑛1 − 1)𝑠1 2 +(𝑛2 − 1)𝑠2 2 (𝑛1 − 1) + (𝑛2 − 1) = 49 (5.4)2+ 39 (6.3)2 49+39 = 1428.84+1547.91 88 = 33.8267 t = (𝑥̅1− 𝑥̅2) − (𝜇1− 𝜇2) √ 𝑠𝑝 2 𝑛1 + 𝑠𝑝 2 𝑛2 = (141−144)−0 √0.6765+0.8457 = − 3 1.23376 = −2.4316 3. CV: df = n1 + n2 – 2 = 50 + 40 – 2 = 88 ≈ 90 (when using t-table) α = 0.01, CV: t = -2.368 4. Decision i) Reject null hypothesis because the value of test statistic is inside the rejection region ii) claim is true iii) there is sufficient evidence to support the claim that company A’s yogurt cups contain on average less calories than that of its competitors. b. Area to the left of TS: t = – 2.4316 df = 90 – 2.632 < t = – 2.4316 < – 2.368 Area in one tail: 0.005 < p-value < 0.01 p-value less than 0.01, the result agrees with part a. c. 98% Confidence Interval:
  • 15.
    15 E = tα/2√ 𝑠𝑝 2 𝑛1 + 𝑠𝑝 2 𝑛2 = 2.368(1.23376) = 2.9216 (𝑥̅1 – 𝑥̅2) – E < 𝜇1 – 𝜇2 < (𝑥̅1 – 𝑥̅2) + E (141 – 144) – 2.9216 < μ1 – μ2 < (141 – 144) + 2.9216 –5.9216 < μ1 – μ2 < –0.0784 Because the confidence interval limits do not contain zero, there is a significant difference between the 2 means. Because the confidence interval limits are both negative, it indicates that company A’s yogurt cups contain on average less calories than that of its competitors (Reject null hypothesis). 4. Test a claim that weights of male college students have a larger variance than female college students. Use a significance level of 0.05 and assume the populations are normal. : 31, 168, 28, : 29, 125, 25 Males n x s females n x s = = = = = = α = 0.05, normal population 1. H0: σ1 2 = σ2 2 H1: σ1 2 > σ2 2 (claim, RTT) 2. TS F = s1 2 /s2 2 F = 282 /252 = 1.2544 3. CV: df1: n1 – 1 = 30 (numerator degrees of freedom) df2: n2 – 1 = 28 (denominator degrees of freedom) CV: F = 1.8687
  • 16.
    16 4. Decision a) Failto reject the null hypothesis because the value of test statistic falls in the non-rejection region b) The claim is false c) There is not sufficient evidence to support the claim that weights of male college students have a larger variance than female college students
  • 17.
    17 5. Directional asymmetry(DA) is a phenomenon whereby in a population one side of each organism is consistently larger than the other (I.E., left larger than right). An evolutionary biologist studying DA measures the length of the left and right wings of a sample of Drosophila (a type of flies, whose members are often called “small fruit flies”) collected from nature and she gets these data. a. The researcher decides to perform a two-sample t test to determine whether the mean wing differs between the left and right sides of these flies. What type of t test will she do? α = 0.05 b. Find the 90% confidence interval for the difference between the means. Part a: The researcher decides to perform a two-sample t test to determine whether the mean wing differs between the left and right sides of these flies. What type of t test will she do? α = 0.05 We use paired t test.
  • 18.
    18 𝐷 ̄ = ∑ 𝐷 𝑛 =−0.0906 𝑠𝐷 = √ 𝑛 ∑ 𝐷2 − (∑ 𝐷)2 𝑛(𝑛 − 1) = 0.2283 Step 1: H0: μD = 0 and H1: μD  0 (claim), 2TT Step 2: 𝑻𝑺: 𝑡 = 𝐷 ̄ −𝜇𝐷 𝑠𝐷/√𝑛 = −0.09059 − 0 0.22829/√17 = −1.636 Step 3: CV: α = 0.05, df= 17 − 1 = 16 → 𝑡 = ±2.120 Step 4: Decision: a. Do not reject H0 b. The claim is False c. There is not sufficient evidence to support the claim that the mean wing differs between the left and right sides of these flies. She cannot conclude that this population possesses DA because the mean lengths of the wings on the left and rights sides do not differ significantly. Part b: Find the 90% confidence interval for the difference between the means. 𝐷 ̄ ± 𝐸 𝐸 = 𝑡𝛼/2 𝑠𝐷 √𝑛 𝑏)𝐸 = 2.120 ⋅ 0.2283 √17 = 0.1174
  • 19.
    19 𝐷 ̄ ± 𝐸→ → −0.0906 ± 0.1174 −0.208 < 𝜇𝐷 < 0.268 Since 0 is contained in the interval, the decision is to not reject the null hypothesis H0 : μD = 0. 6. An ecologist is concerned with whether pollution entering part of a preserve area is compromising the health and growth of an endangered species of snake. To determine this, he decides to measure the length of a set of mature adults from the polluted area and an unpolluted area. The researcher decides to perform a two-sample t test to determine whether the mean length of these snakes differs between these two areas. α = 0.05 Length measurements unpolluted area (cm) Length measurements polluted area (cm) 1 27 25 2 28 26 3 30 28 4 29 27 5 28 23 6 28 21 7 28 19 8 31 28 9 25 23 10 23 24 11 21 26 12 26 28 13 28 25 14 30 26 15 27 25 16 21
  • 20.
    20 17 24 Sample SD2.658320272 2.620619594 Mean 27.26666667 24.64705882 Size: n 15 17 Step 1: H0: μ1 = μ2 & H1: μ1 ≠ μ2 , claim, 2TT Step 2: 𝑇𝑆: 𝑡 = 27.267−24.647 √2.6582 50 + 2.6212 40 = 2.62 0.093498 = 2.8022 Step 3: CV: α = 0.05, df = smaller of n1 – 1 or n2 – 1 = 15 – 1 =14 → 𝑡 = ±2.145 Step 4: Decision: a. Reject H0 b. The claim is True c. There is enough evidence to support the claim that the mean length of these snakes differs in these areas. It is larger in the unpolluted area since TS is positive. Note: Technology / Calculator results are different. 𝑑𝑓 = (𝐴+𝐵)2 𝐴2 𝑛1−1 + 𝐵2 𝑛2−1 , A = 𝑠1 2 𝑛1 , 𝐵 = 𝑠2 2 𝑛2 → 29.38 → 29 Step 3: CV: α = 0.05, df = 29→ 𝑡 = ±2.045, 𝑃 − 𝑣𝑙𝑢𝑒 = 0.009 < 𝛼 = 0.05 −𝟐. 𝟏𝟒𝟓 𝟐. 𝟏𝟒𝟓 TS: 𝟐. 𝟖𝟎𝟐𝟐