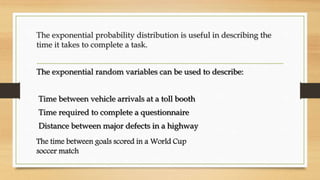
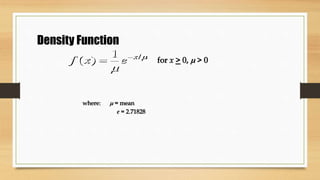
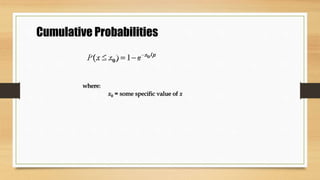
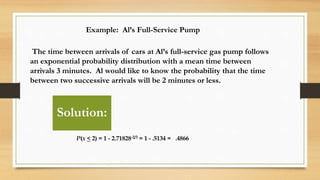
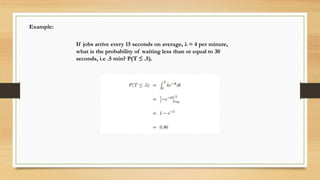
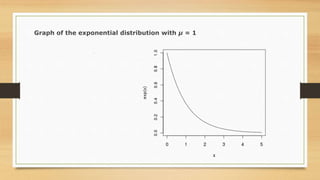
The exponential probability distribution is useful for describing the time it takes to complete random tasks. It can model the time between events like vehicle arrivals at a toll booth, time to complete a survey, or distance between defects on a highway. The distribution is defined by a probability density function that uses the mean time or rate of the process. It can calculate the probability that an event will occur within a certain time threshold, like the chance a car will arrive at a gas pump within 2 minutes. The mean and standard deviation of the exponential distribution are equal, and it is an extremely skewed distribution without a defined mode.
A binomial random variable is the number of successes x in n repeated trials of a binomial experiment. The probability distribution of a binomial random variable is called a binomial distribution. Suppose we flip a coin two times and count the number of heads (successes).
: Random Variable, Discrete Random variable, Continuous random variable, Probability Distribution of Discrete Random variable, Mathematical Expectations and variance of a discrete random variable.
This presentation contains the topic as follows, probability distribution, random variable, continuous variable, discrete variable, probability mass function, expected value and variance and examples
A Probability Distribution is a way to shape the sample data to make predictions and draw conclusions about an entire population. It refers to the frequency at which some events or experiments occur. It helps finding all the possible values a random variable can take between the minimum and maximum statistically possible values.
Vehicle Headway Distribution Models on Two-Lane Two-Way Undivided RoadsAM Publications
The time headway between vehicles is an important flow characteristic that affects the safety, level of service, driver behavior, and capacity of a transportation system. The present study attempted to identify suitable probability distribution models for vehicle headways on 2-lane 2-way undivided (2/2 UD) road sections. Data was collected from three locations in the city of Semarang: Abdulrahman Saleh St. (Loc. 1), Taman Siswa St. (Loc. 2) and Lampersari St. (Loc.3). The vehicle headways were grouped into one-second interval. Three mathematical distributions were proposed: random (negative-exponential), normal, and composite, with vehicle headway as variable. The Kolmogorov-Smirnov test was used for testing the goodness of fit. Traffic flows at the selected locations were considered low, with traffic volume ranged between 400 to 670 vehicles per hour per lane. The traffic volume on Loc.1 was 484 vehicles per hour, that on Loc. 2 was 405 vehicles per hour, and that on Loc. 3 was 666 vehicles per hour. Random distribution showed good fit at all locations under study with 95% confidence level. Normal distribution showed good fit at Loc. 1 and Loc. 2, whereas composite distribution fit only at Loc. 1. It was suggested that random distribution is to be used as an input in generating traffic in traffic analysis at highway sections where traffic volume are under 500 vehicles per hour.
IE 425 Homework 10Submit on Tuesday, 12101.(20 pts) C.docxsheronlewthwaite
IE 425 Homework 10
Submit on Tuesday, 12/10
1.(20 pts) Consider the M/M/1/∞ queuing system descried in Problem 5 in Homework 9. Show
that:
(a) (11 pts) The average number of customers in the system is:
L =
λ
µ−λ
Hint:
L =
∞∑
n=0
nπn,
∞∑
n=0
nρn−1 =
d
dρ
∞∑
n=0
ρn =
d
dρ
(
1
1 −ρ
)
=
1
(1 −ρ)2
(b) (3 pts) The average waiting time in the system (from entrance to exist) is:
W =
1
µ−λ
(c) (3 pts) The average waiting time in the queue, not including service, is:
W0 =
λ
µ(µ−λ)
(d) (3 pts) The average number of customers in the queue, not including service, is:
L0 =
λ2
µ(µ−λ)
2.(15 pts) Consider the M/M/c/∞ queuing system descried in Problem 6 in Homework 9. Show
that:
L0 =
π0
c!
(
λ
µ
)c (
λ
cµ
)(
1 −
λ
cµ
)−2
Then, using Little’s law, we can compute:
W0 =
L0
λ
, W = W0 +
1
µ
, L = λW = λ
(
W0 +
1
µ
)
= L0 +
λ
µ
Hint:
L0 =
∞∑
n=c
(n− c)πn =
∞∑
m=0
mπc+m,
∞∑
m=0
mρm =
ρ
(1 −ρ)2
3.(15 pts) Consider the M/M/∞/∞ queuing system descried in Problem 7 in Homework 9. Show
that:
L =
λ
µ
, W =
1
µ
, W0 = 0, L0 = 0
4.(15 pts) Consider the M/M/c/c queuing system descried in Problem 8 in Homework 9.
(a) (3 pts) Explain why L0 = 0 and W0 = 0.
(b) (3 pts) Explain why W = 1
µ
.
1
(c) (5 pts) Explain why the mean arrival rate to the system is λ(1 −πc)
(d) (4 pts) Show that:
L =
λ
µ
(1 −πc)
5. (20 pts) Consider the M/M/c/k queuing system descried in Problem 9 in Homework 9. Show
that:
(a) (14 pts)
L0 =
π0
c!
(
λ
µ
)c (
λ
cµ
)(
1 −
λ
cµ
)−2 [
1 −
(
λ
cµ
)k−c
− (k − c)
(
λ
cµ
)k−c (
1 −
λ
cµ
)]
Hint:
L0 =
∞∑
n=c
(n− c)πn,
M∑
m=0
mρm−1 =
d
dρ
M∑
m=0
ρm
(b) (2 pts) Explain why:
L = L0 +
c−1∑
n=0
nπn + c
(
1 −
c−1∑
n=0
πn
)
(c) (2 pts) Explain why the mean arrival rate to the system is λ(1 −πk).
(d) (2 pts) Show that:
W0 =
L0
λ(1 −πk)
W =
L0
λ(1 −πk)
+
1
µ
6. (15 pts) For the M/M/c/∞ queuing system with a finite calling population N descried in
Problem 10 in Homework 9, it is more convenient to use the generic formulas to compute the queue
length and the number of customers in the system :
L0 =
N∑
n=c+1
(n− c)πn
L = L0 +
c−1∑
n=0
nπn + c
(
1 −
c−1∑
n=0
πn
)
(a) (10 pts) Show that the mean arrival rate to the system is:
N∑
n=0
(N −n)λπn = · · · = λ(N −L)
(b) (5 pts) Show that:
W0 =
L0
λ(N −L)
W =
L0
λ(N −L)
+
1
µ
2
IE 425 Homework 9
Submit on Tuesday, 12/3
1. Report your notebook score for Midterm Exam 2 along with a picture as the proof.
2. (11 pts) Consider a Discrete State Continuous Time Markov Chain (DSCTMC) defined on
Ω = {1, 2, 3} with generator matrix G:
G =
−6 2 41 −2 1
3 1 −4
Suppose the DSCTMC is in state 1.
(a) What is the expected time until the DSCTMC leaves state 1?
(b) What is the probability that the DSCTMC will jump to state 2 after it leaves state 1?
In Problem 3 ∼ Problem 10, model the systems as DSCTMCs. For each DSCTMC:
(a) Define the states of the DSCTMC and write down their holding time distributio ...
Similar to Exponential probability distribution (10)
The perfect Sundabet Slot mudah menang Promo new member Animated PDF for your conversation. Discover and Share the best GIFs on Tenor
Admin Ramah Cantik Aktif 24 Jam Nonstop siap melayani pemain member Sundabet login via apk sundabet rtp daftar slot gacor daftar
thGAP - BAbyss in Moderno!! Transgenic Human Germline Alternatives ProjectMarc Dusseiller Dusjagr
thGAP - Transgenic Human Germline Alternatives Project, presents an evening of input lectures, discussions and a performative workshop on artistic interventions for future scenarios of human genetic and inheritable modifications.
To begin our lecturers, Marc Dusseiller aka "dusjagr" and Rodrigo Martin Iglesias, will give an overview of their transdisciplinary practices, including the history of hackteria, a global network for sharing knowledge to involve artists in hands-on and Do-It-With-Others (DIWO) working with the lifesciences, and reflections on future scenarios from the 8-bit computer games of the 80ies to current real-world endeavous of genetically modifiying the human species.
We will then follow up with discussions and hands-on experiments on working with embryos, ovums, gametes, genetic materials from code to slime, in a creative and playful workshop setup, where all paticipant can collaborate on artistic interventions into the germline of a post-human future.
The Legacy of Breton In A New Age by Master Terrance LindallBBaez1
Brave Destiny 2003 for the Future for Technocratic Surrealmageddon Destiny for Andre Breton Legacy in Agenda 21 Technocratic Great Reset for Prison Planet Earth Galactica! The Prophecy of the Surreal Blasphemous Desires from the Paradise Lost Governments!
Explore the multifaceted world of Muntadher Saleh, an Iraqi polymath renowned for his expertise in visual art, writing, design, and pharmacy. This SlideShare delves into his innovative contributions across various disciplines, showcasing his unique ability to blend traditional themes with modern aesthetics. Learn about his impactful artworks, thought-provoking literary pieces, and his vision as a Neo-Pop artist dedicated to raising awareness about Iraq's cultural heritage. Discover why Muntadher Saleh is celebrated as "The Last Polymath" and how his multidisciplinary talents continue to inspire and influence.
2137ad Merindol Colony Interiors where refugee try to build a seemengly norm...luforfor
This are the interiors of the Merindol Colony in 2137ad after the Climate Change Collapse and the Apocalipse Wars. Merindol is a small Colony in the Italian Alps where there are around 4000 humans. The Colony values mainly around meritocracy and selection by effort.
2137ad - Characters that live in Merindol and are at the center of main storiesluforfor
Kurgan is a russian expatriate that is secretly in love with Sonia Contado. Henry is a british soldier that took refuge in Merindol Colony in 2137ad. He is the lover of Sonia Contado.
3. The exponential probability distribution is useful in describing the
time it takes to complete a task.
The exponential random variables can be used to describe:
Time between vehicle arrivals at a toll booth
Time required to complete a questionnaire
Distance between major defects in a highway
The time between goals scored in a World Cup
soccer match
4. f x e x
( ) /
1
for x > 0, > 0
Density Function
where: = mean
e = 2.71828
6. Example: Al’s Full-Service Pump
The time between arrivals of cars at Al’s full-service gas pump follows
an exponential probability distribution with a mean time between
arrivals 3 minutes. Al would like to know the probability that the time
between two successive arrivals will be 2 minutes or less.
P(x < 2) = 1 - 2.71828-2/3 = 1 - .5134 = .4866
Solution:
7. Example:
If jobs arrive every 15 seconds on average, λ = 4 per minute,
what is the probability of waiting less than or equal to 30
seconds, i.e .5 min? P(T ≤ .5).
8. Characteristics :
The mean and standard deviation of exponential distribution are equal.
The distribution is extremely skewed and there does not exist any mode.