Downloaded 116 times
![Steps in CPM Analysis
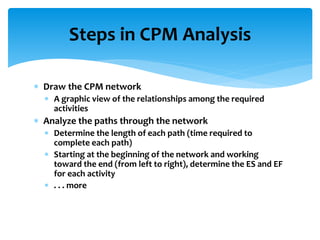
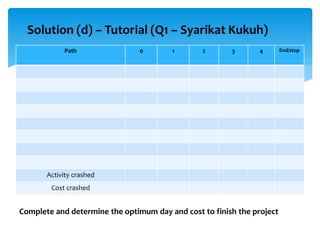
Path analysis (continued)
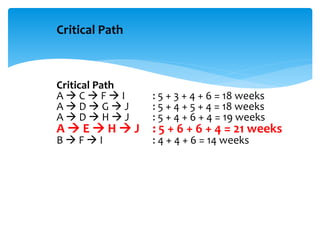
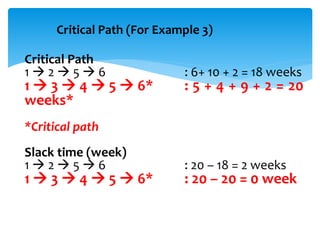
Identify the critical path(s) (the longest path[s]
through the network)
The critical path(s) determines how long the project
will take
. . . more](https://image.slidesharecdn.com/pertanalysis-150909061602-lva1-app6892/85/Pert-analysis-8-320.jpg)
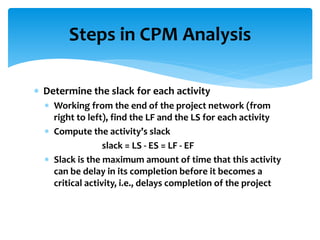


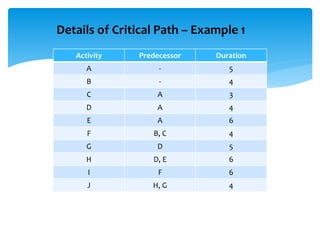
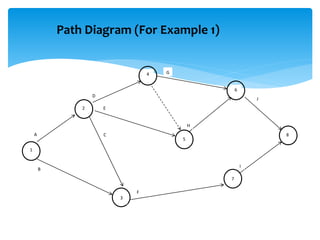
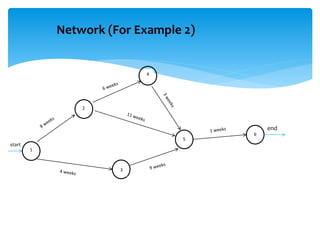
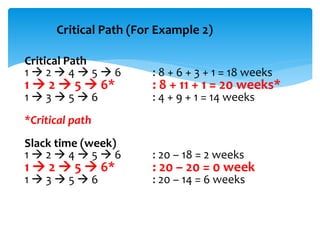
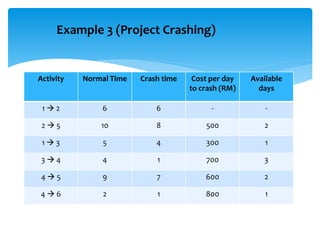
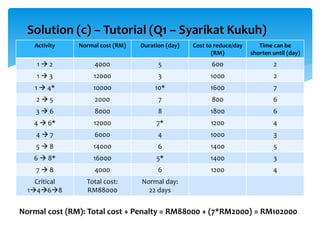


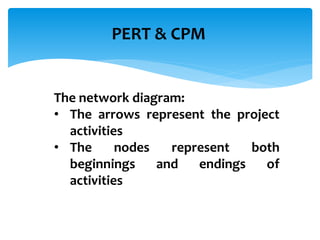
CPM involves drawing a network diagram of activities and their relationships, analyzing paths and determining earliest and latest start/finish times to identify the critical path and calculate slack. Project crashing involves shortening activity durations by incurring costs to potentially reduce the project duration below that of the critical path. An example outlines crashing the critical


