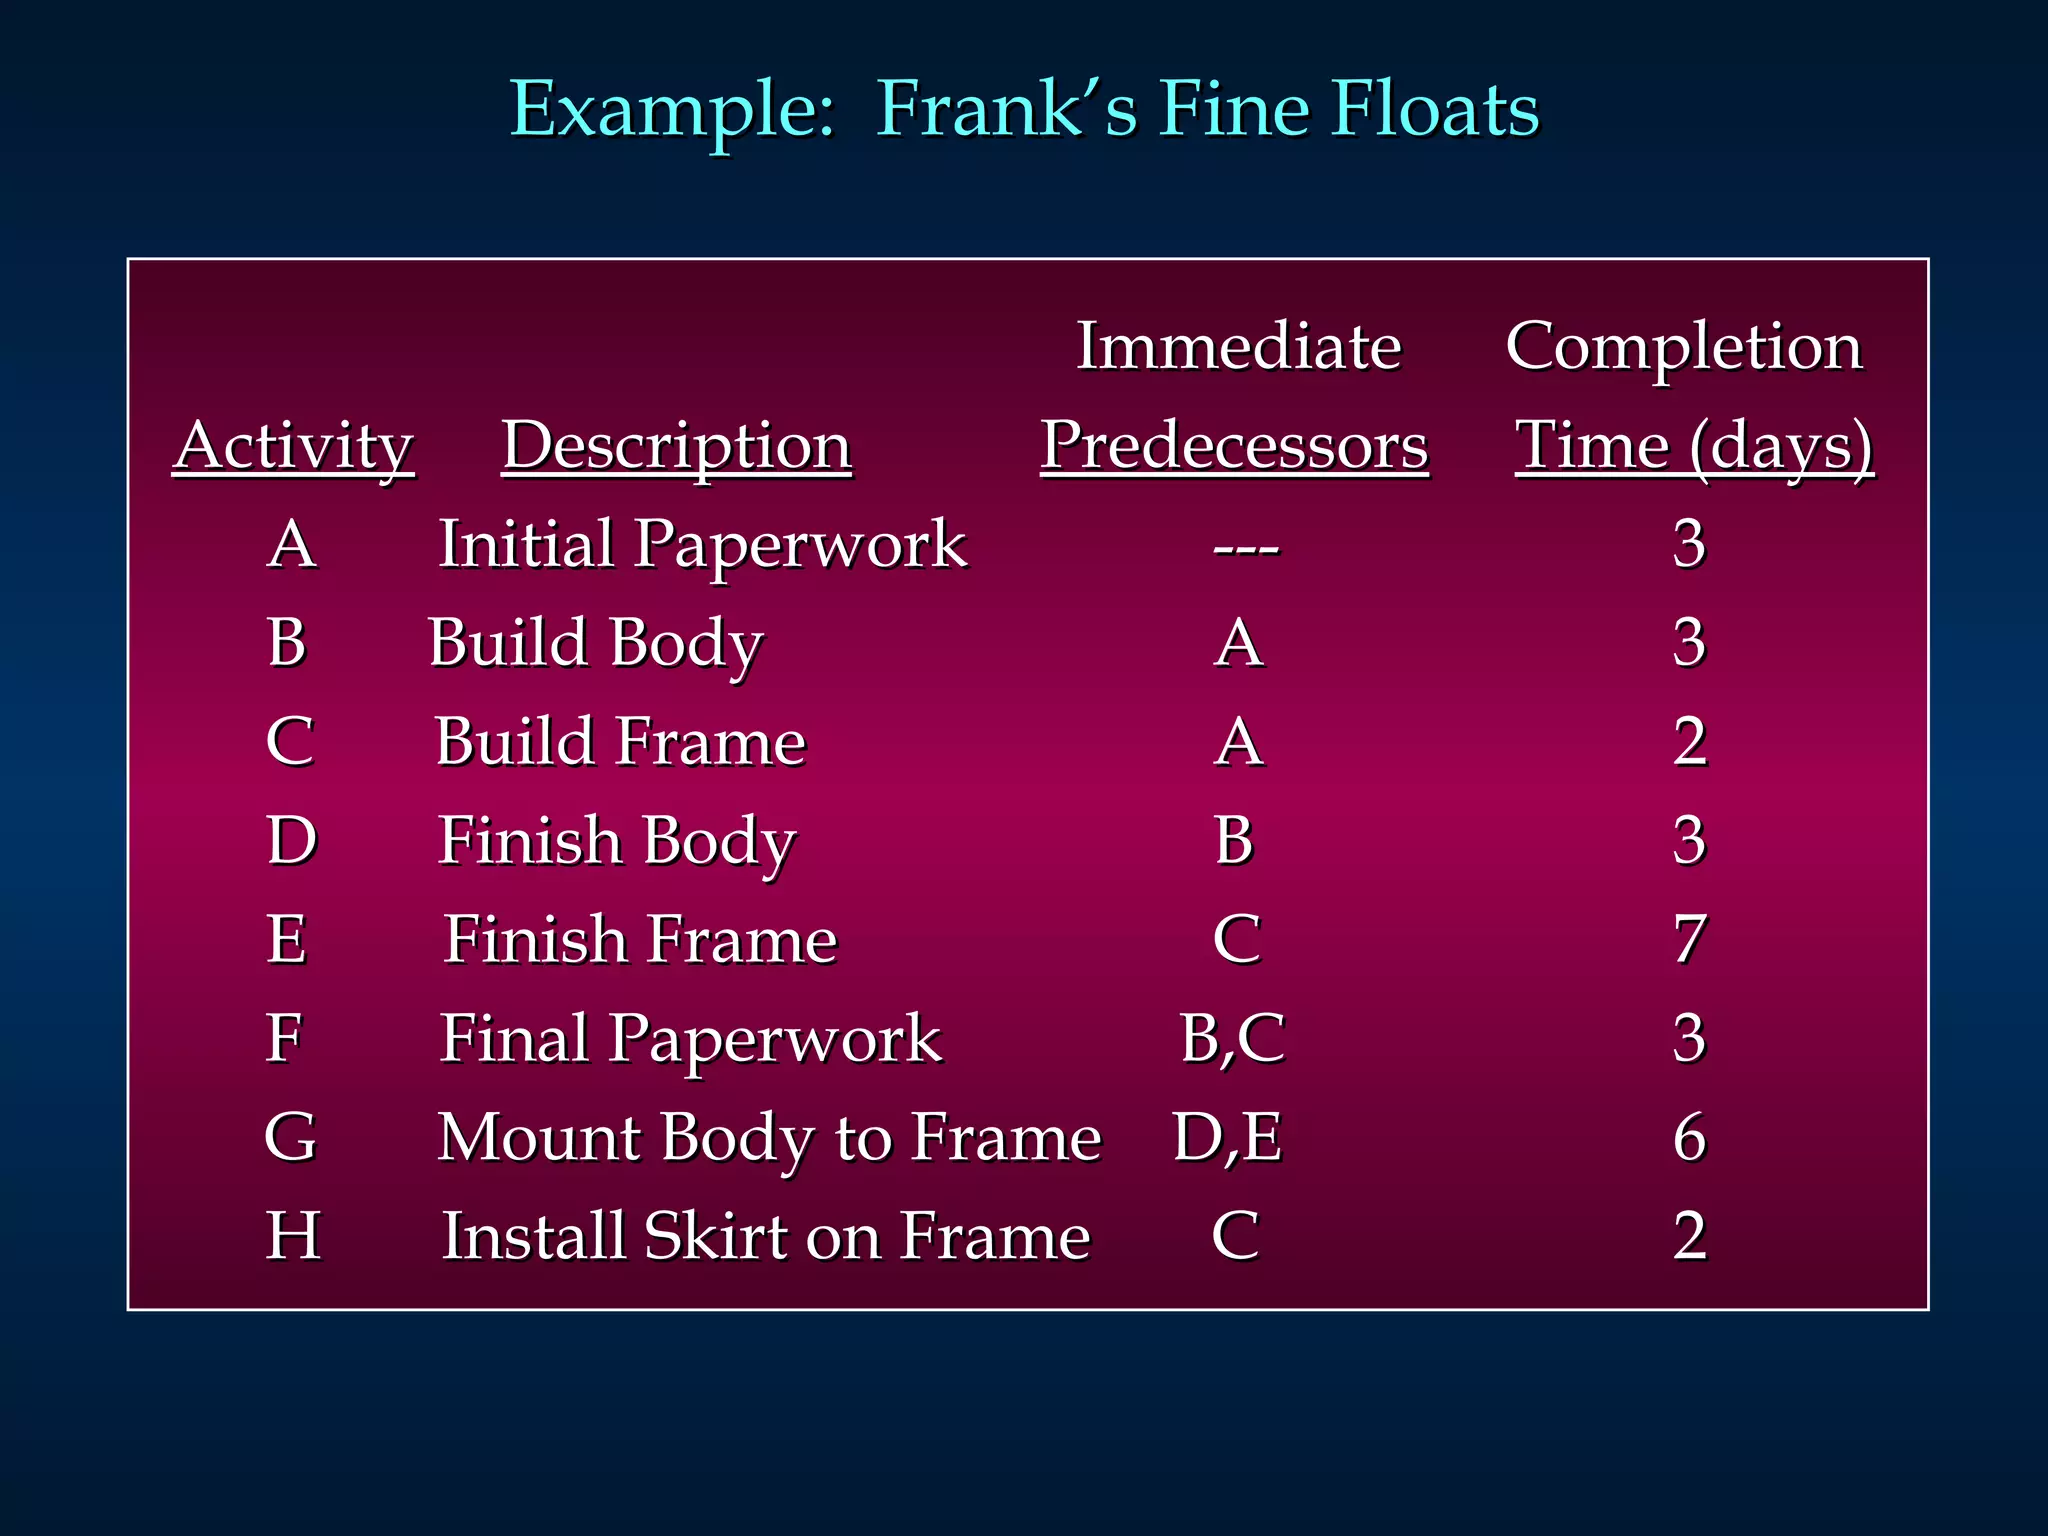
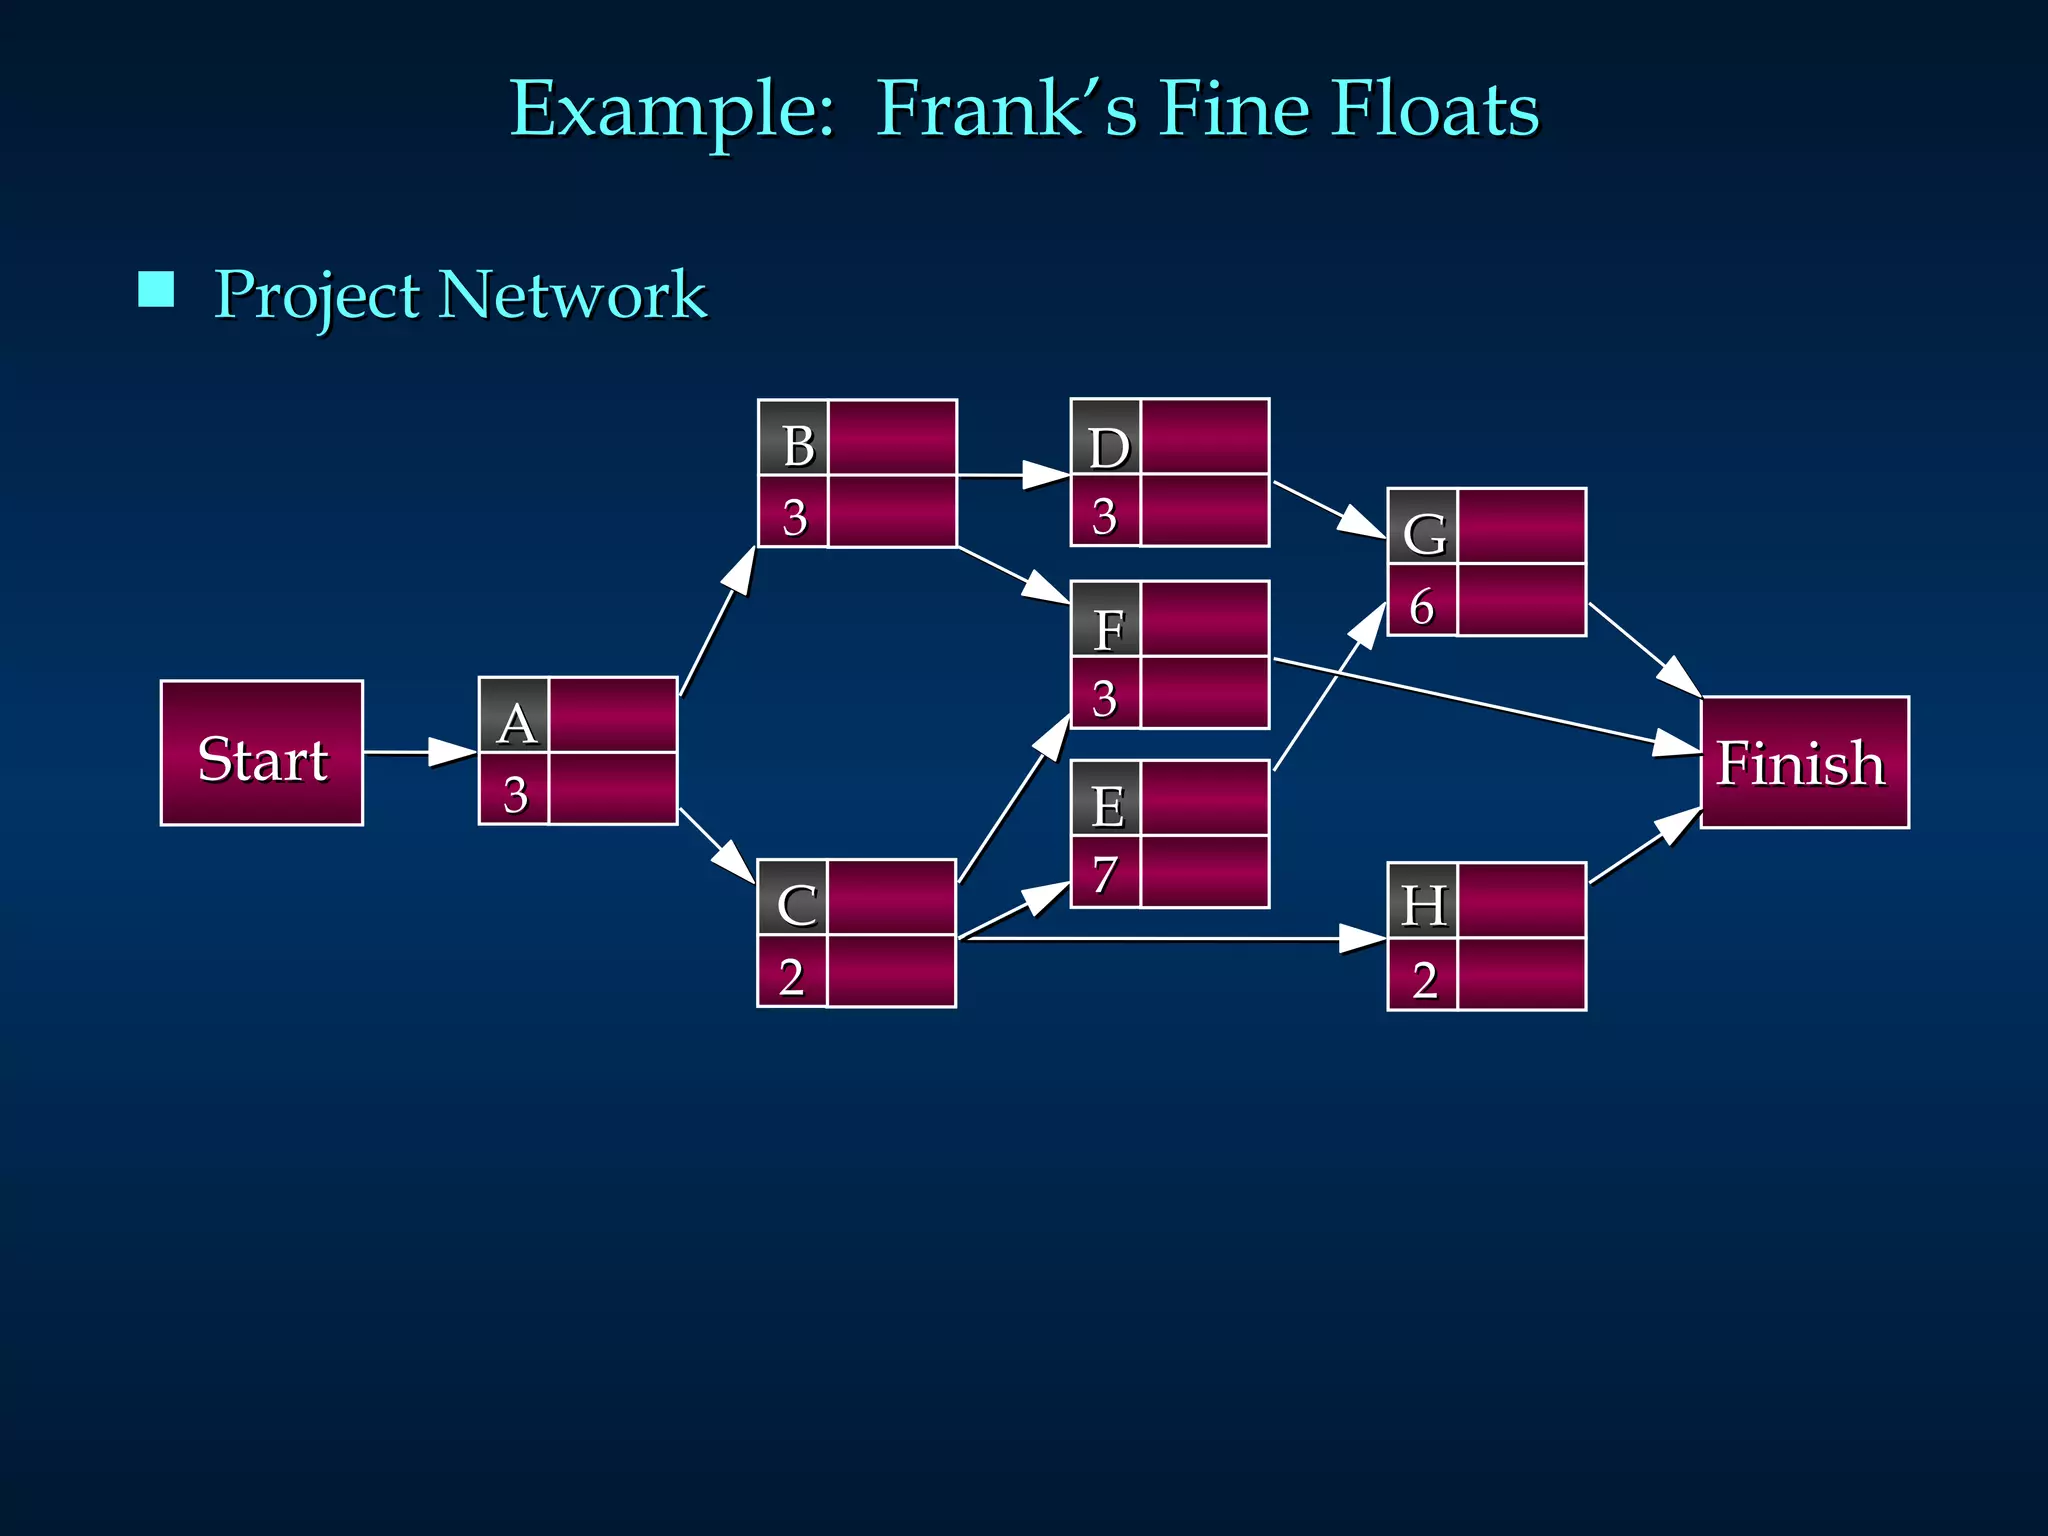
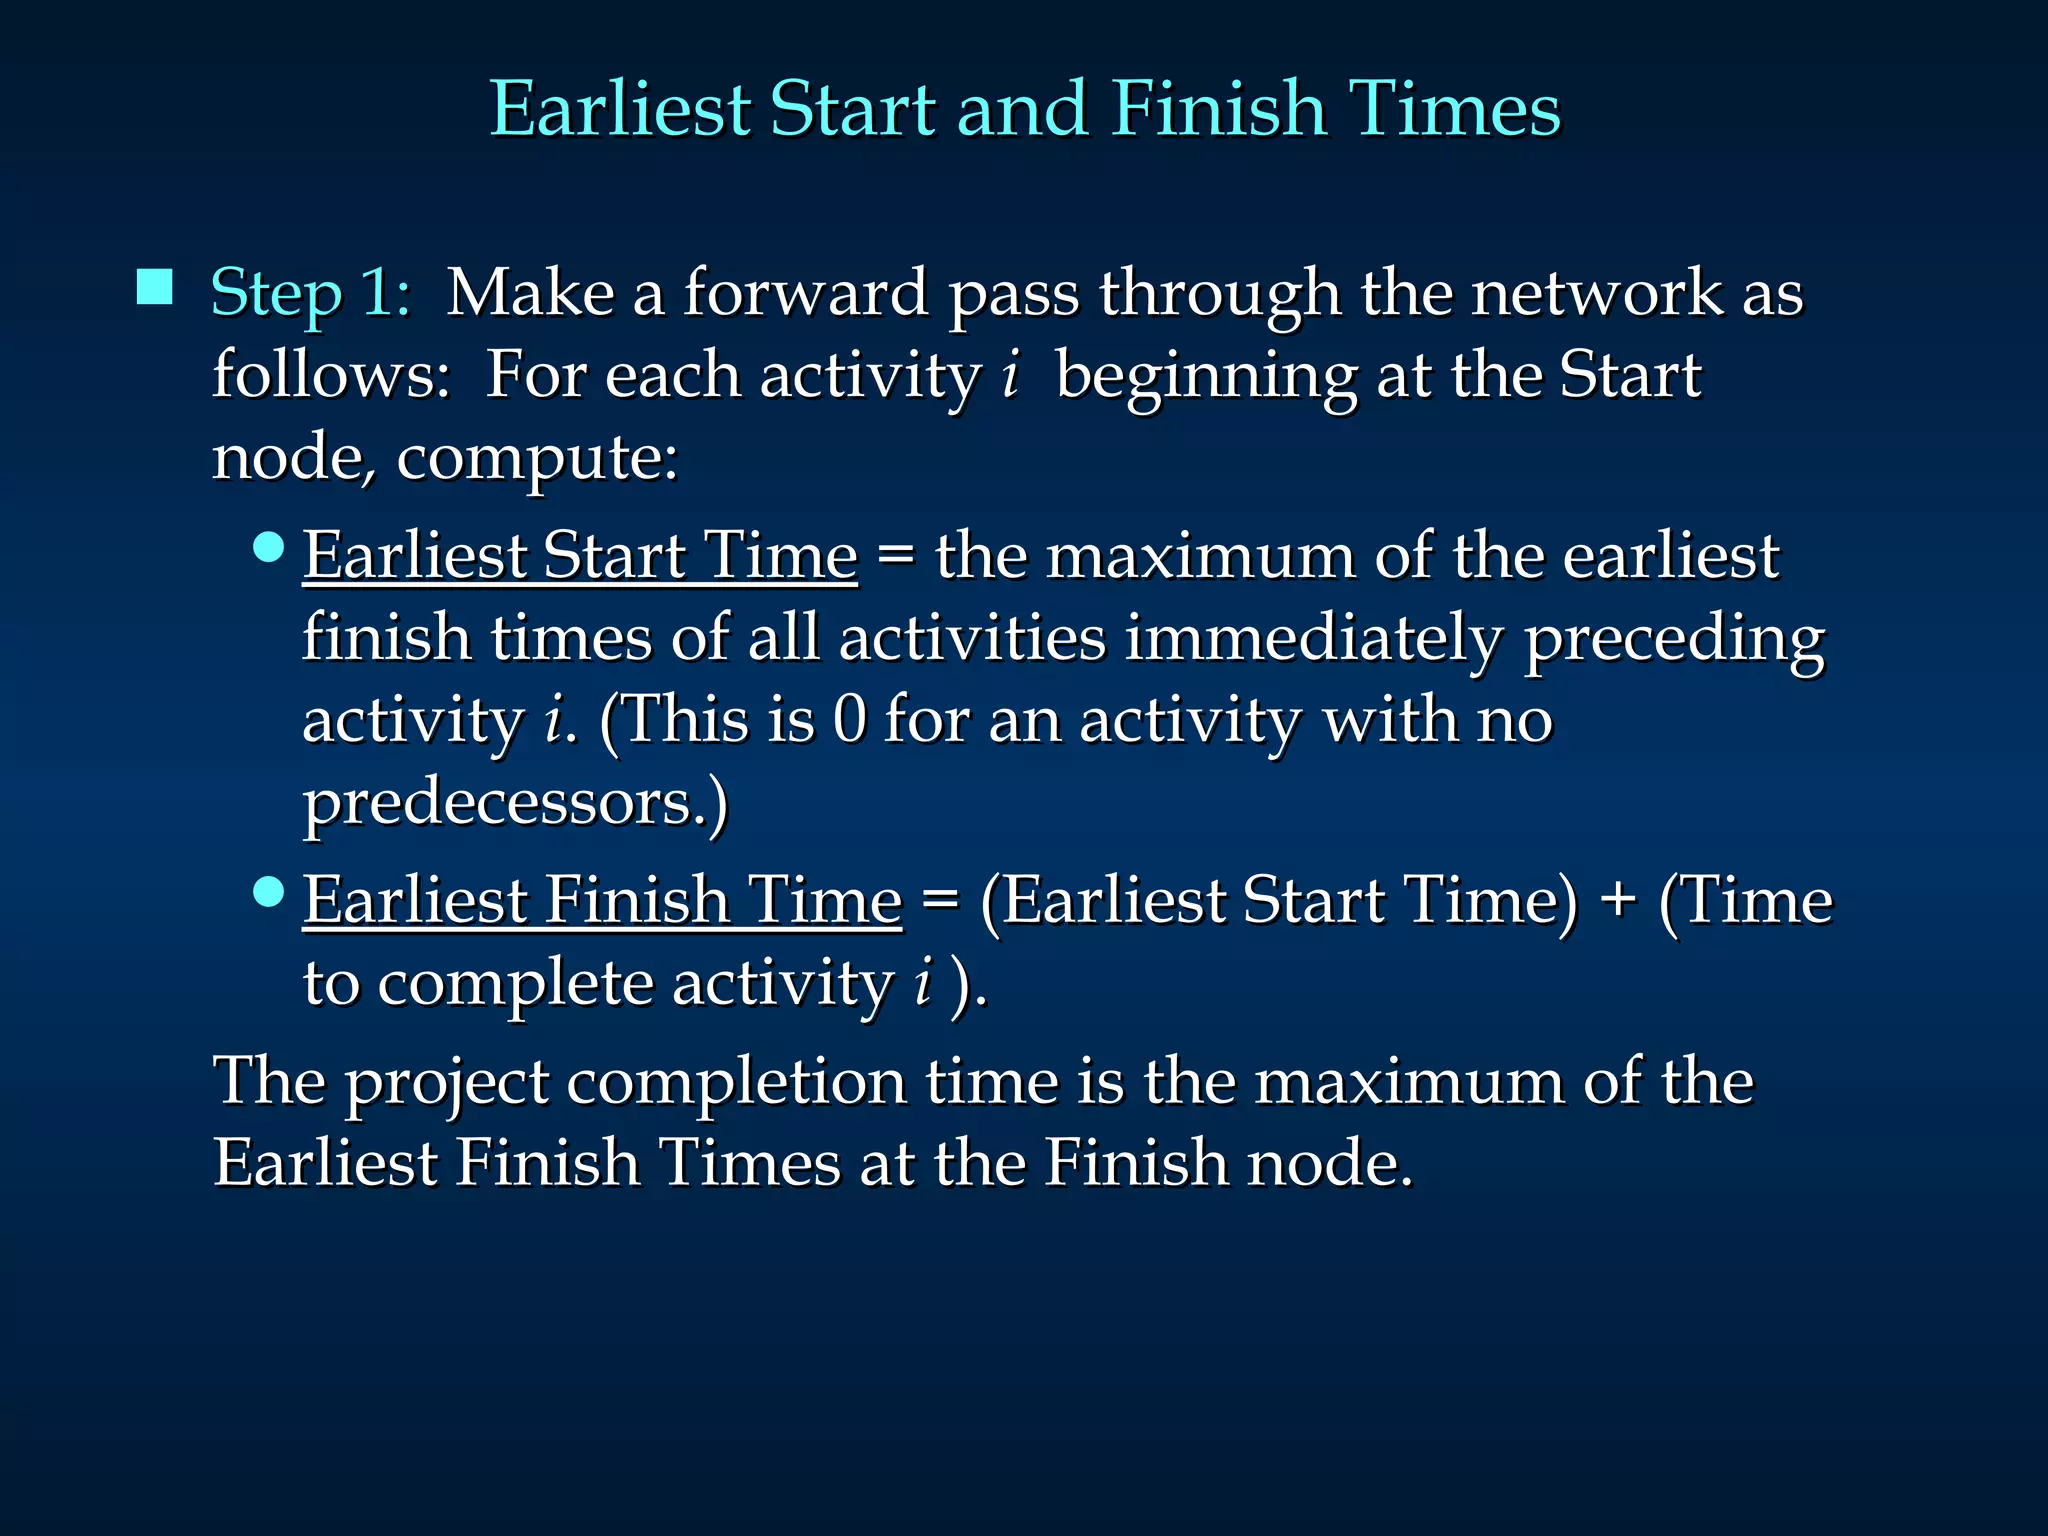
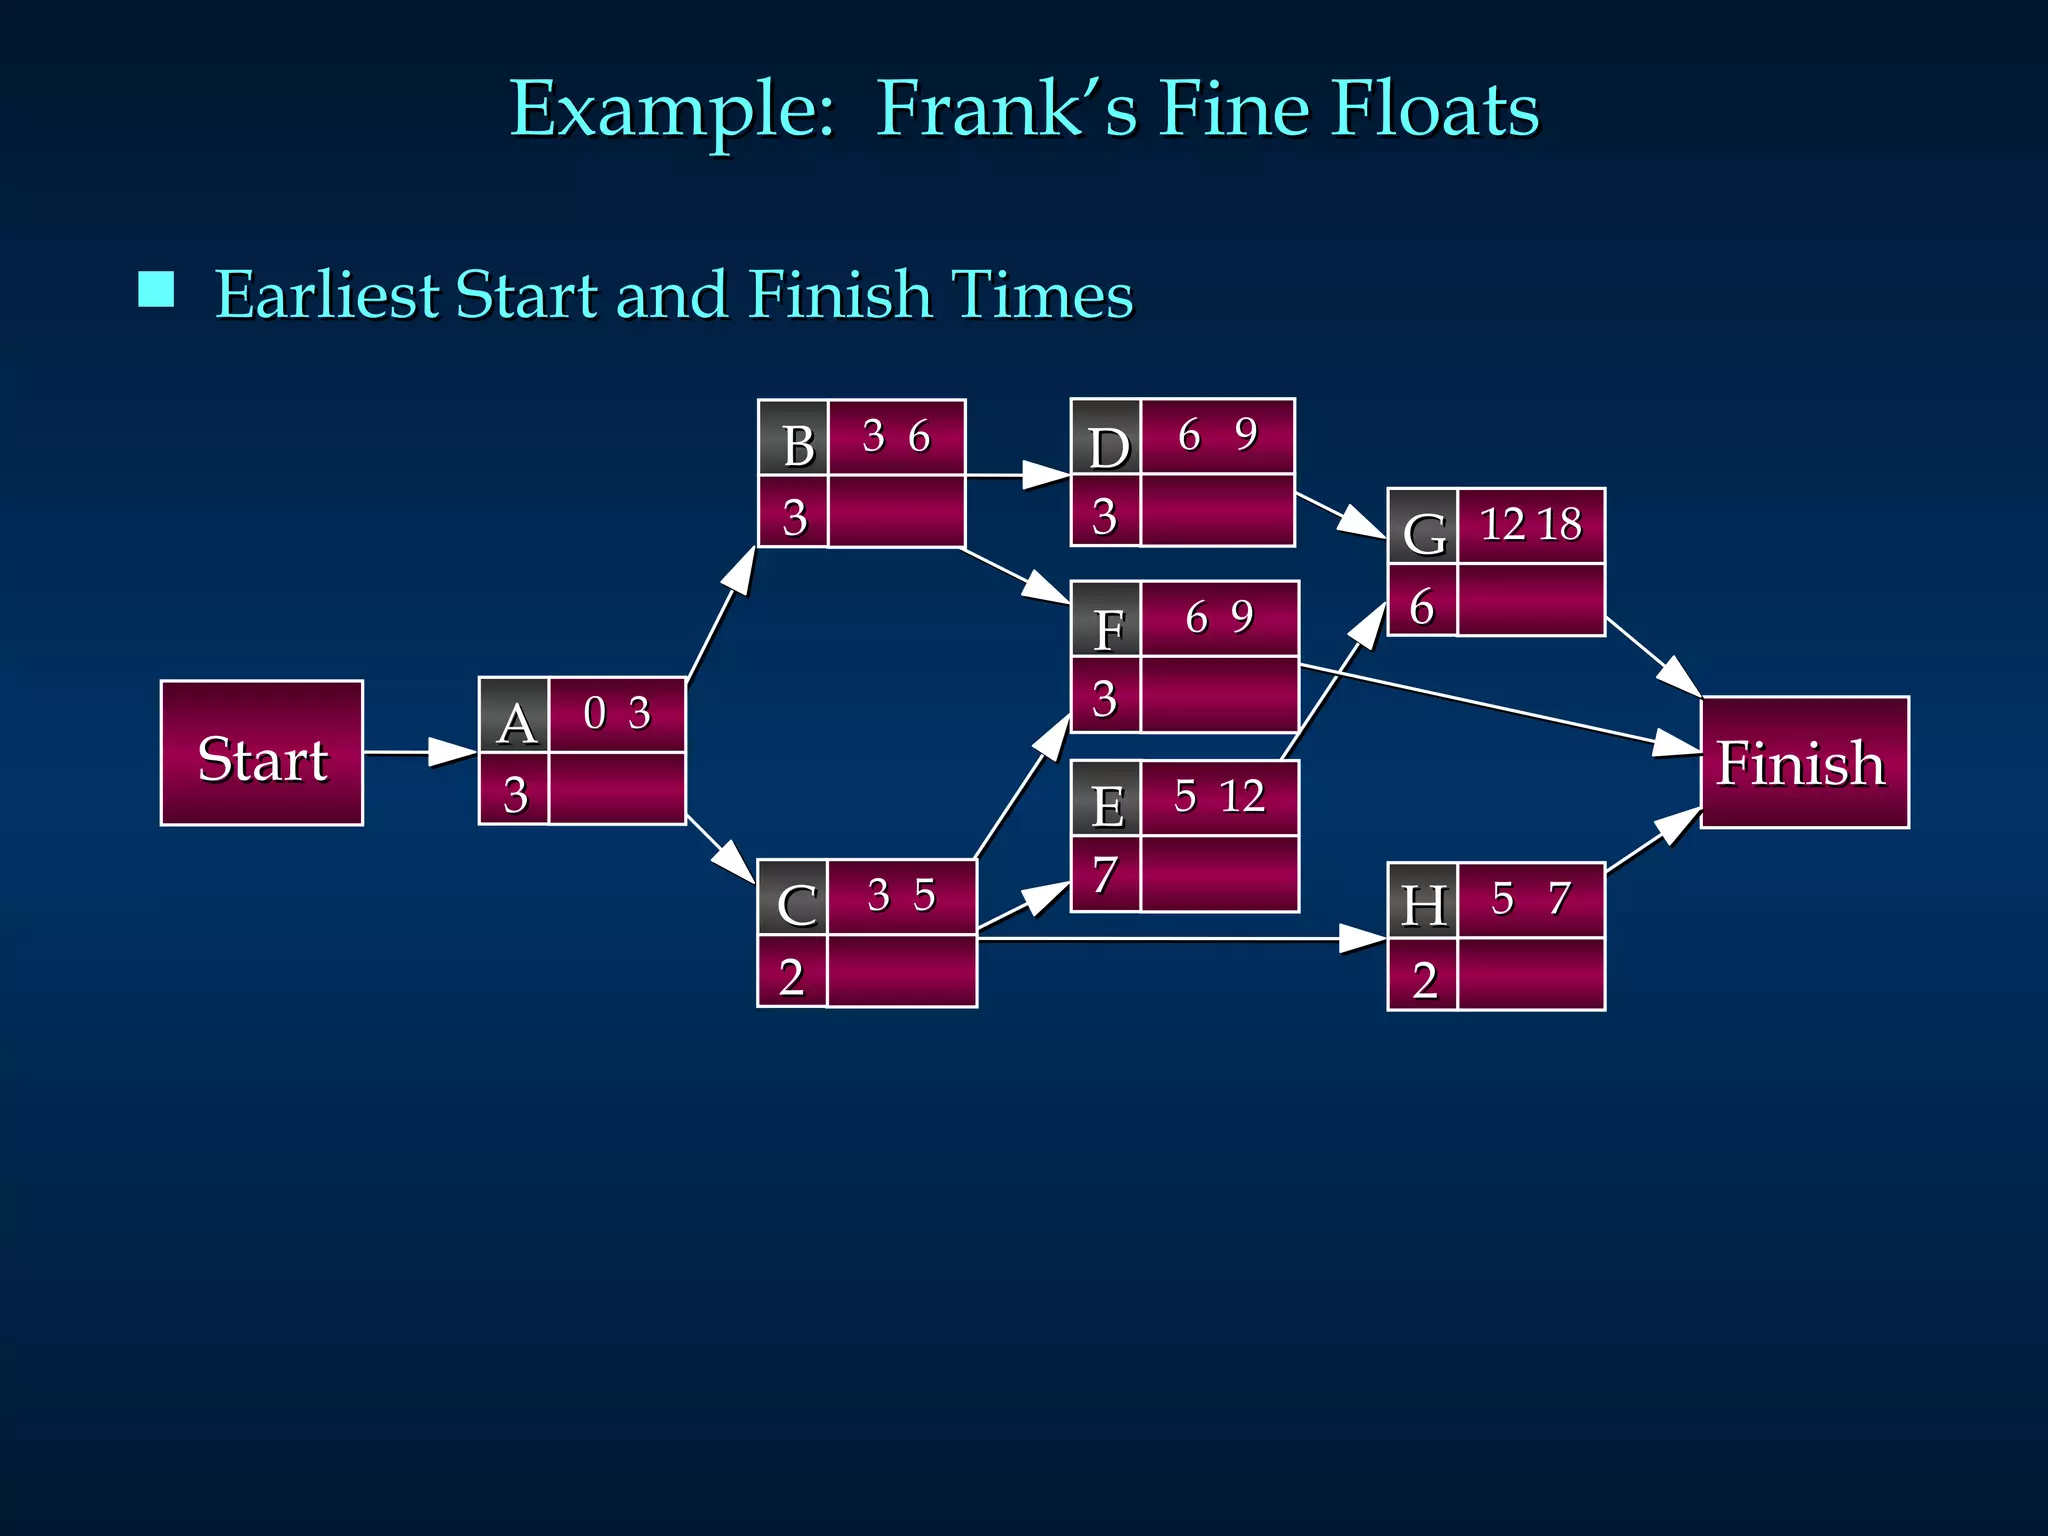
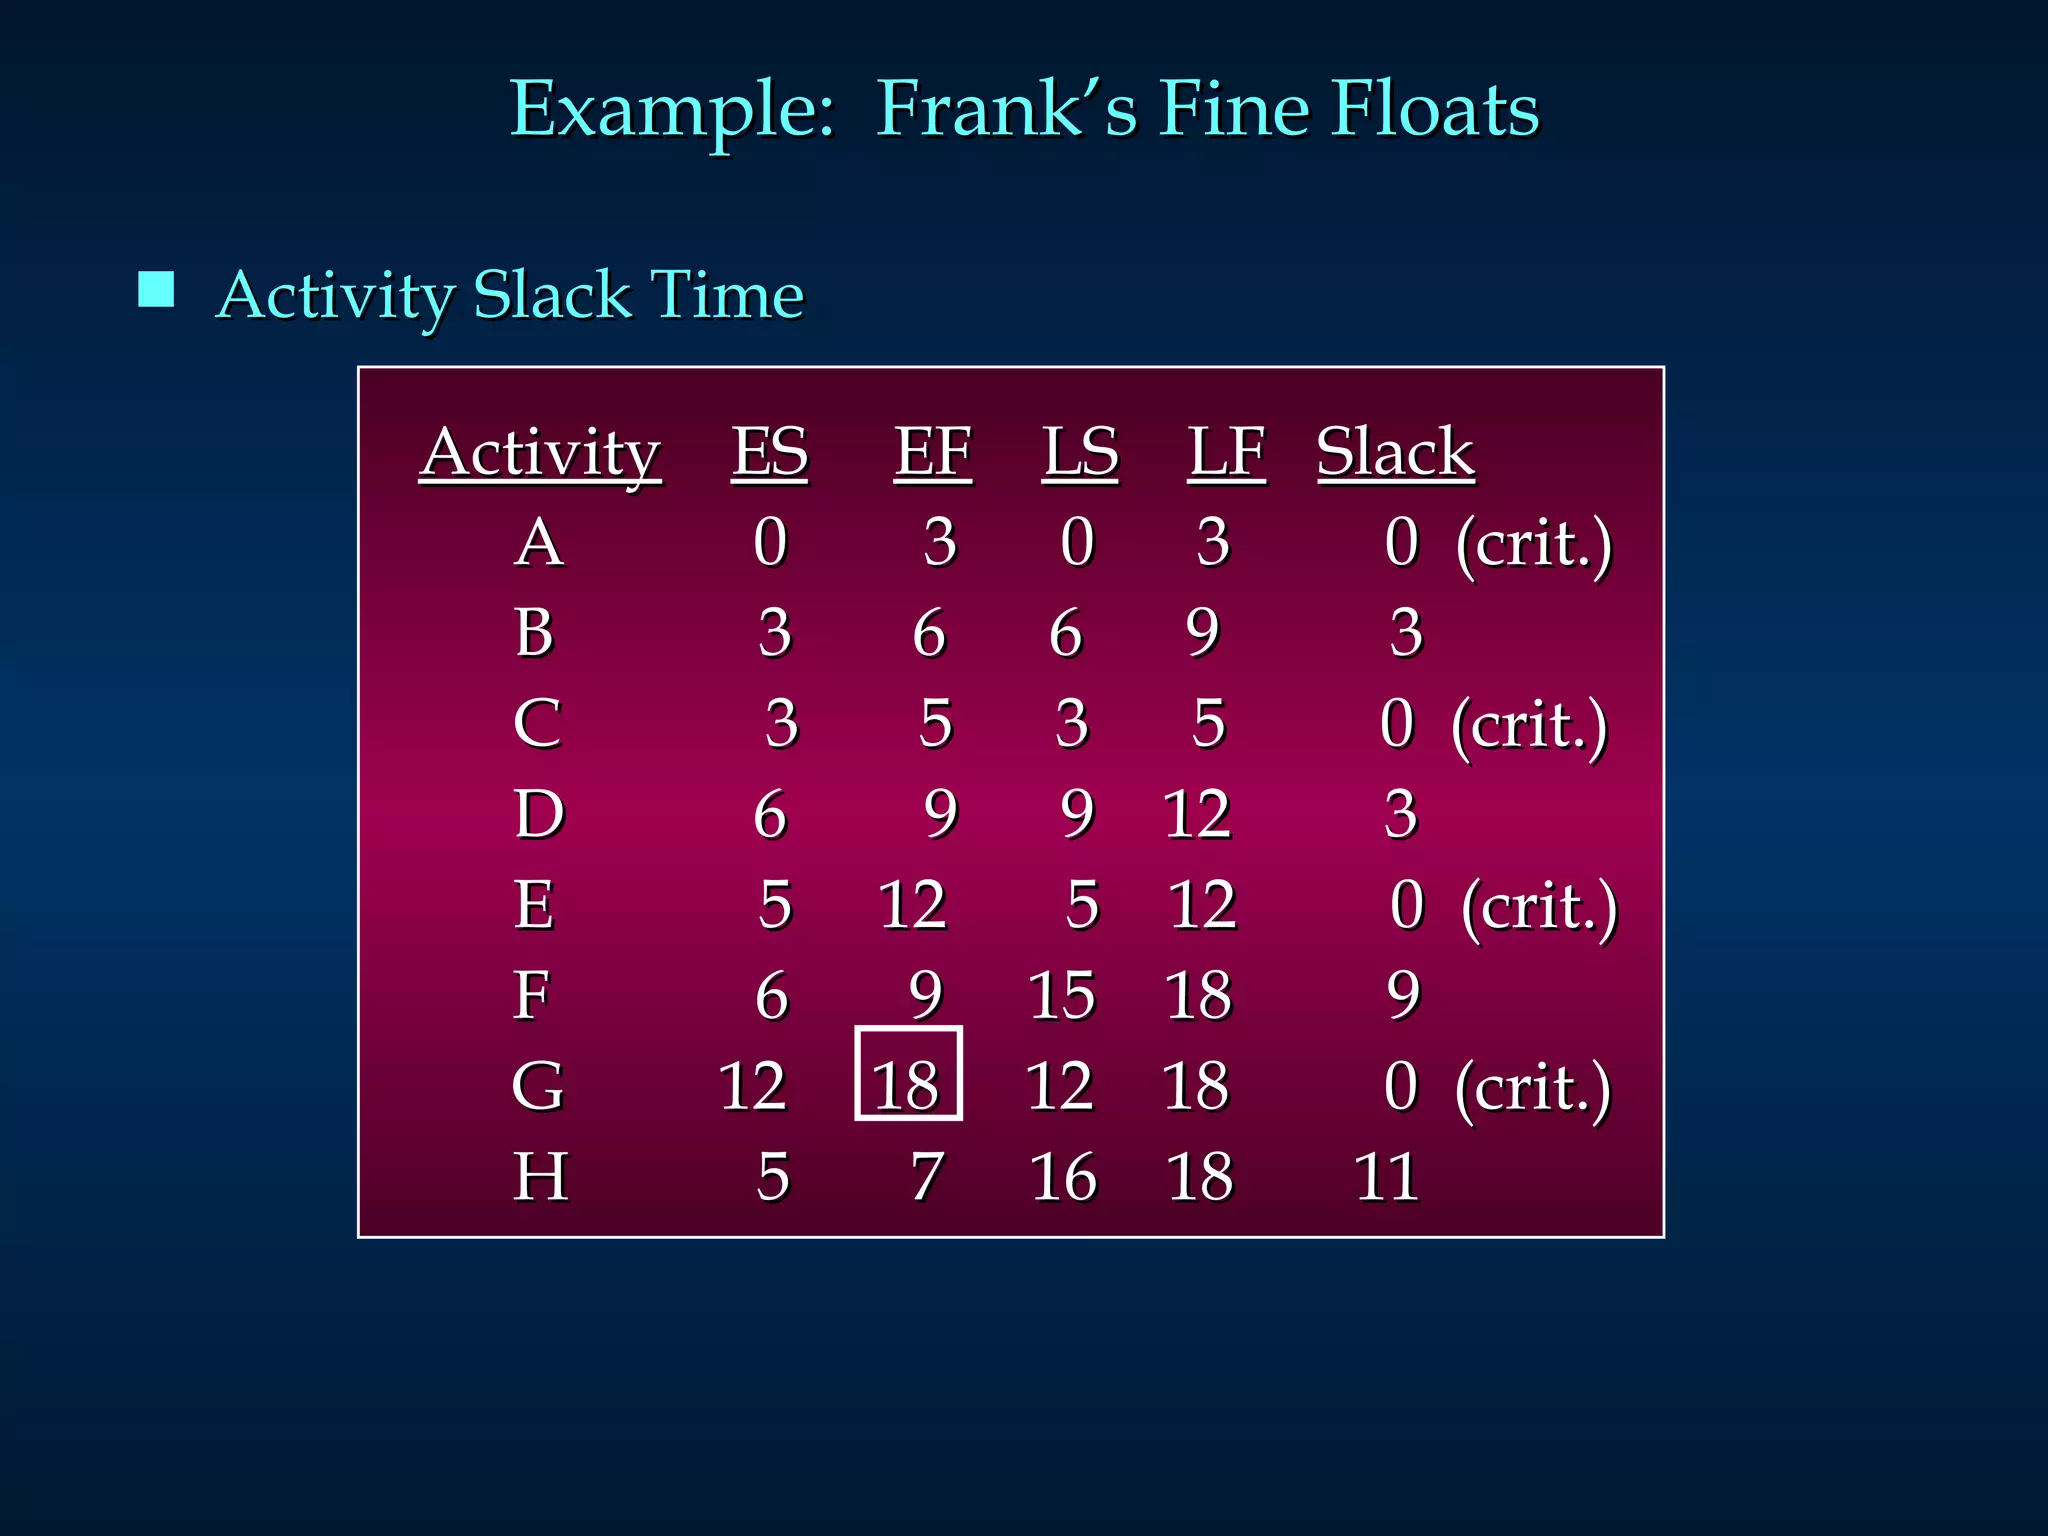
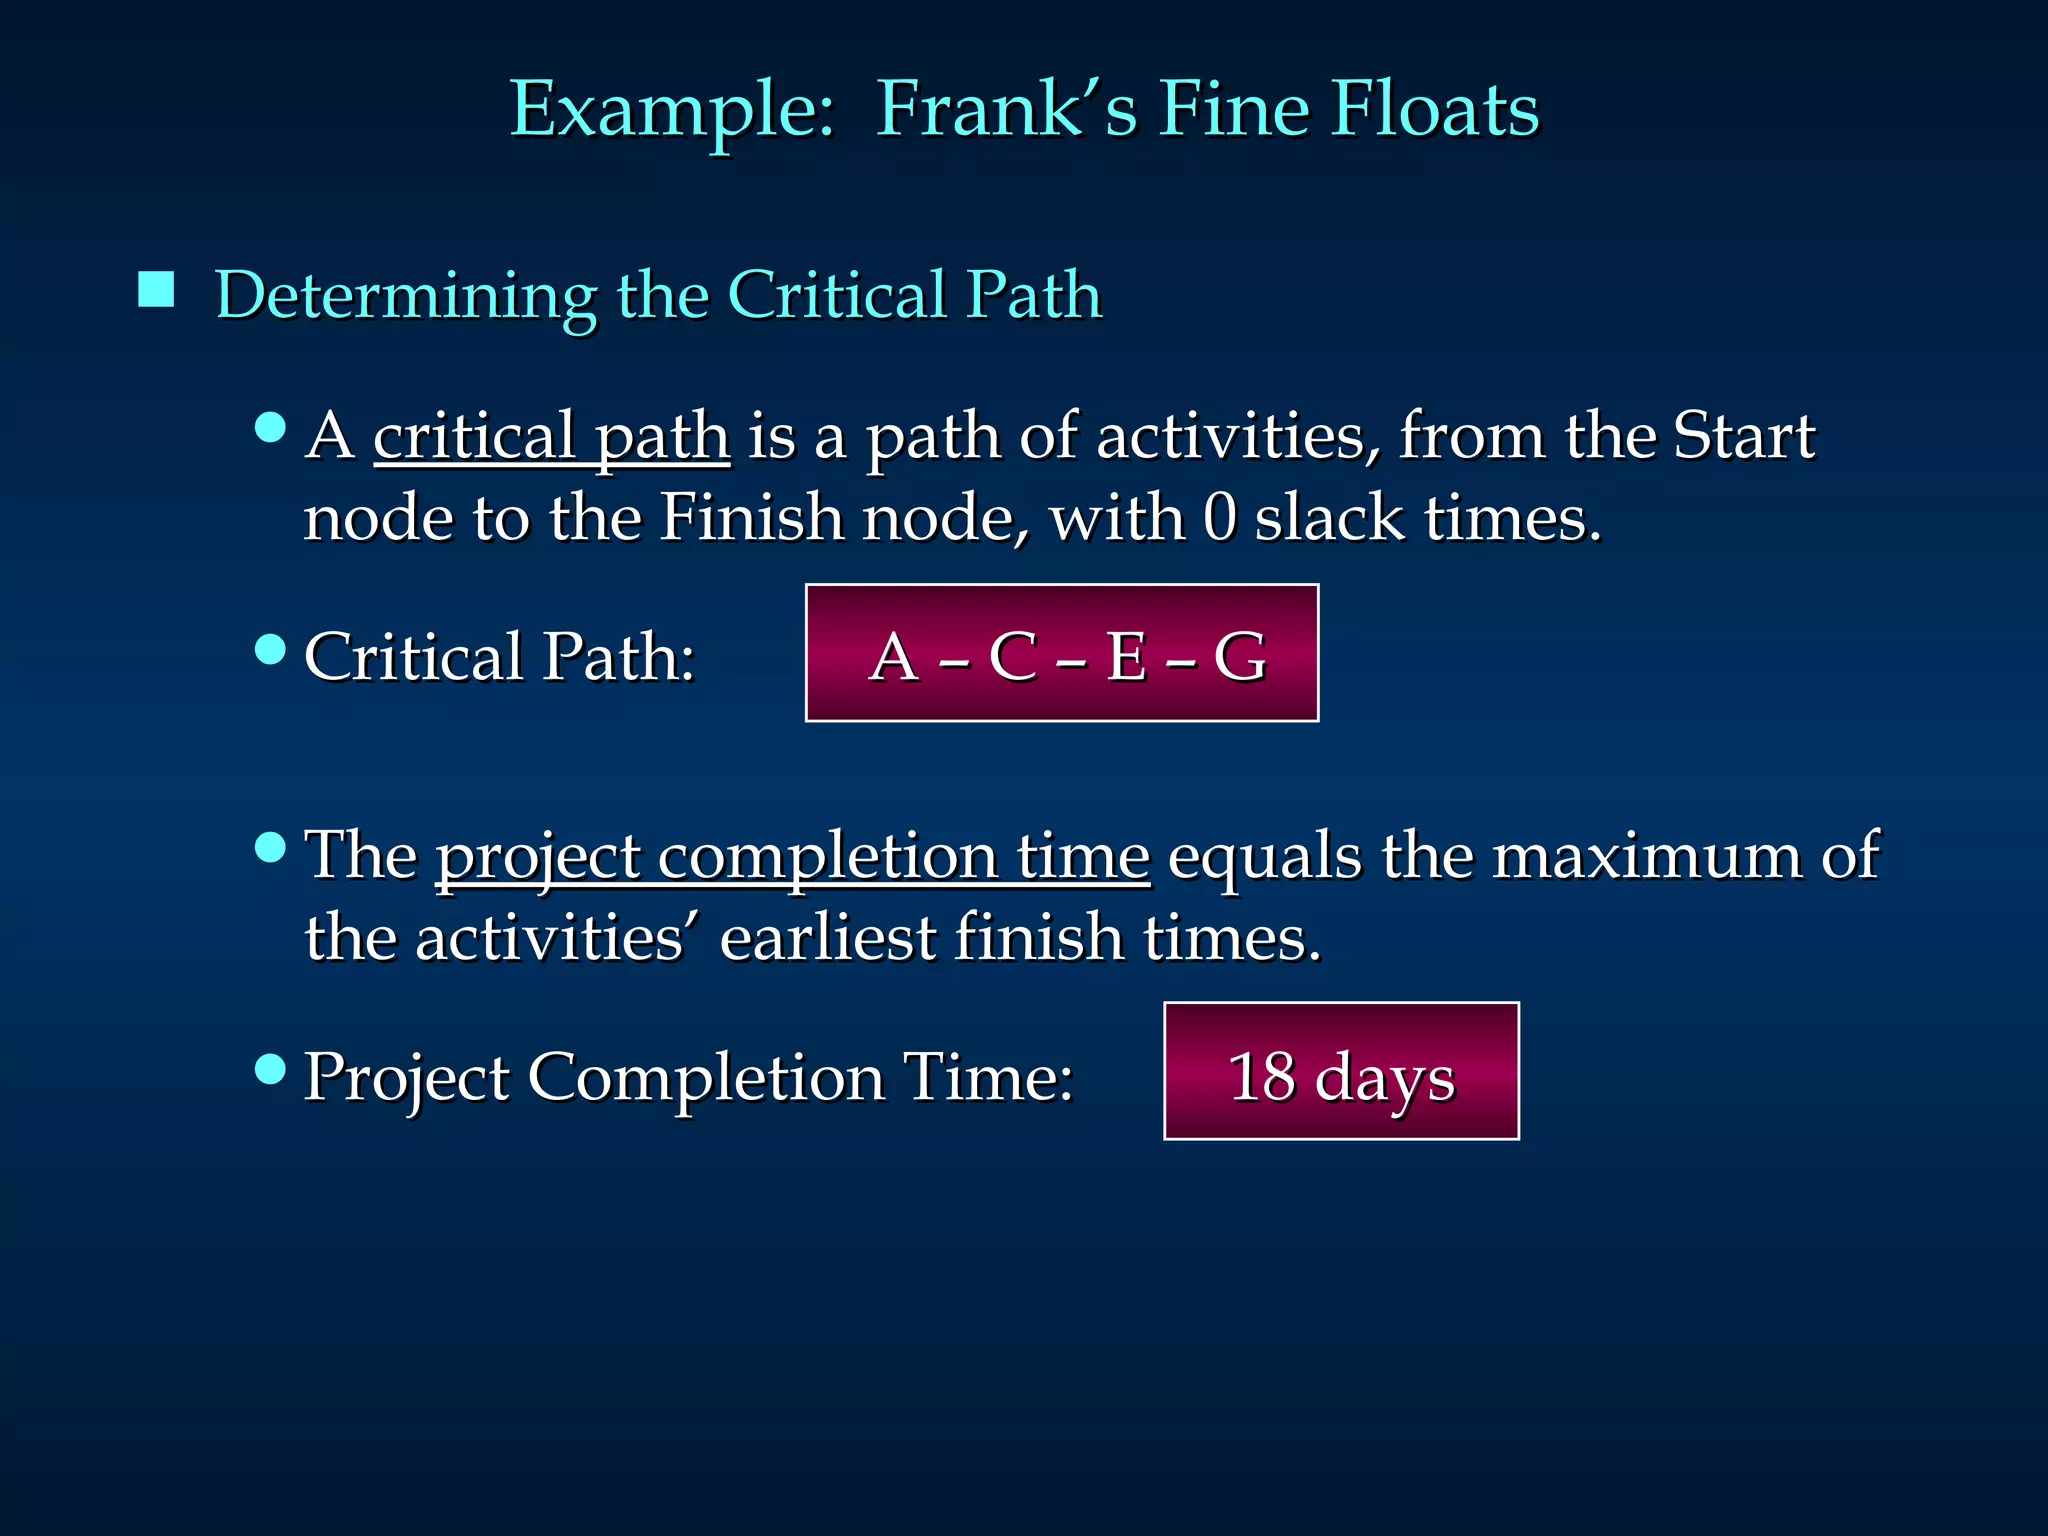
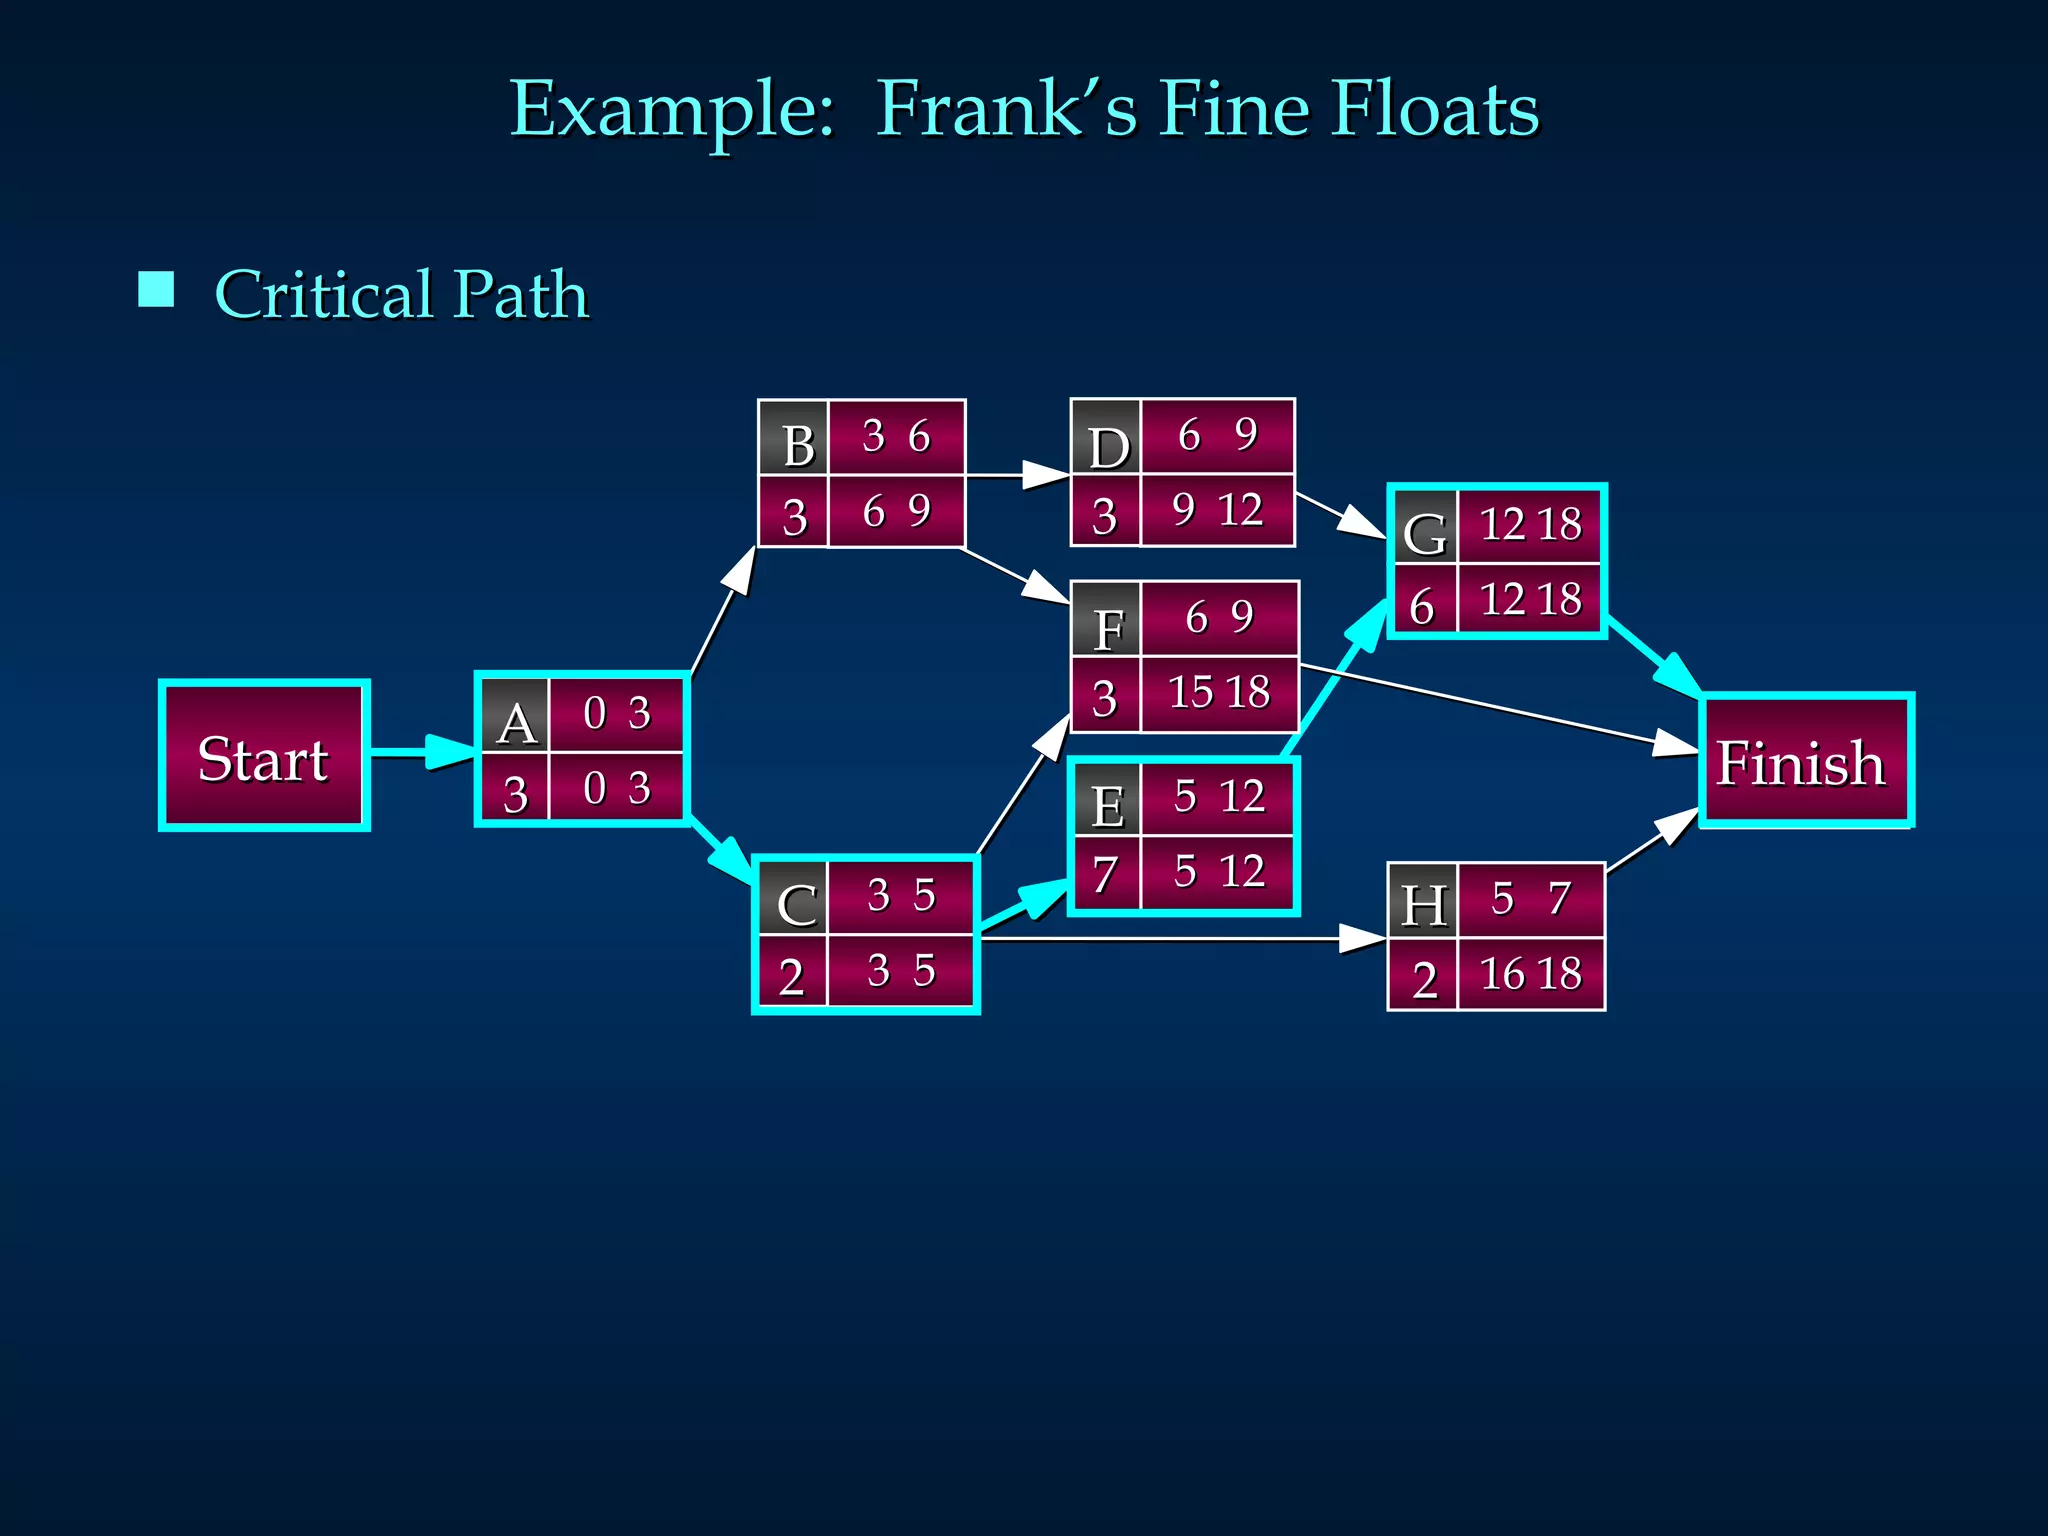
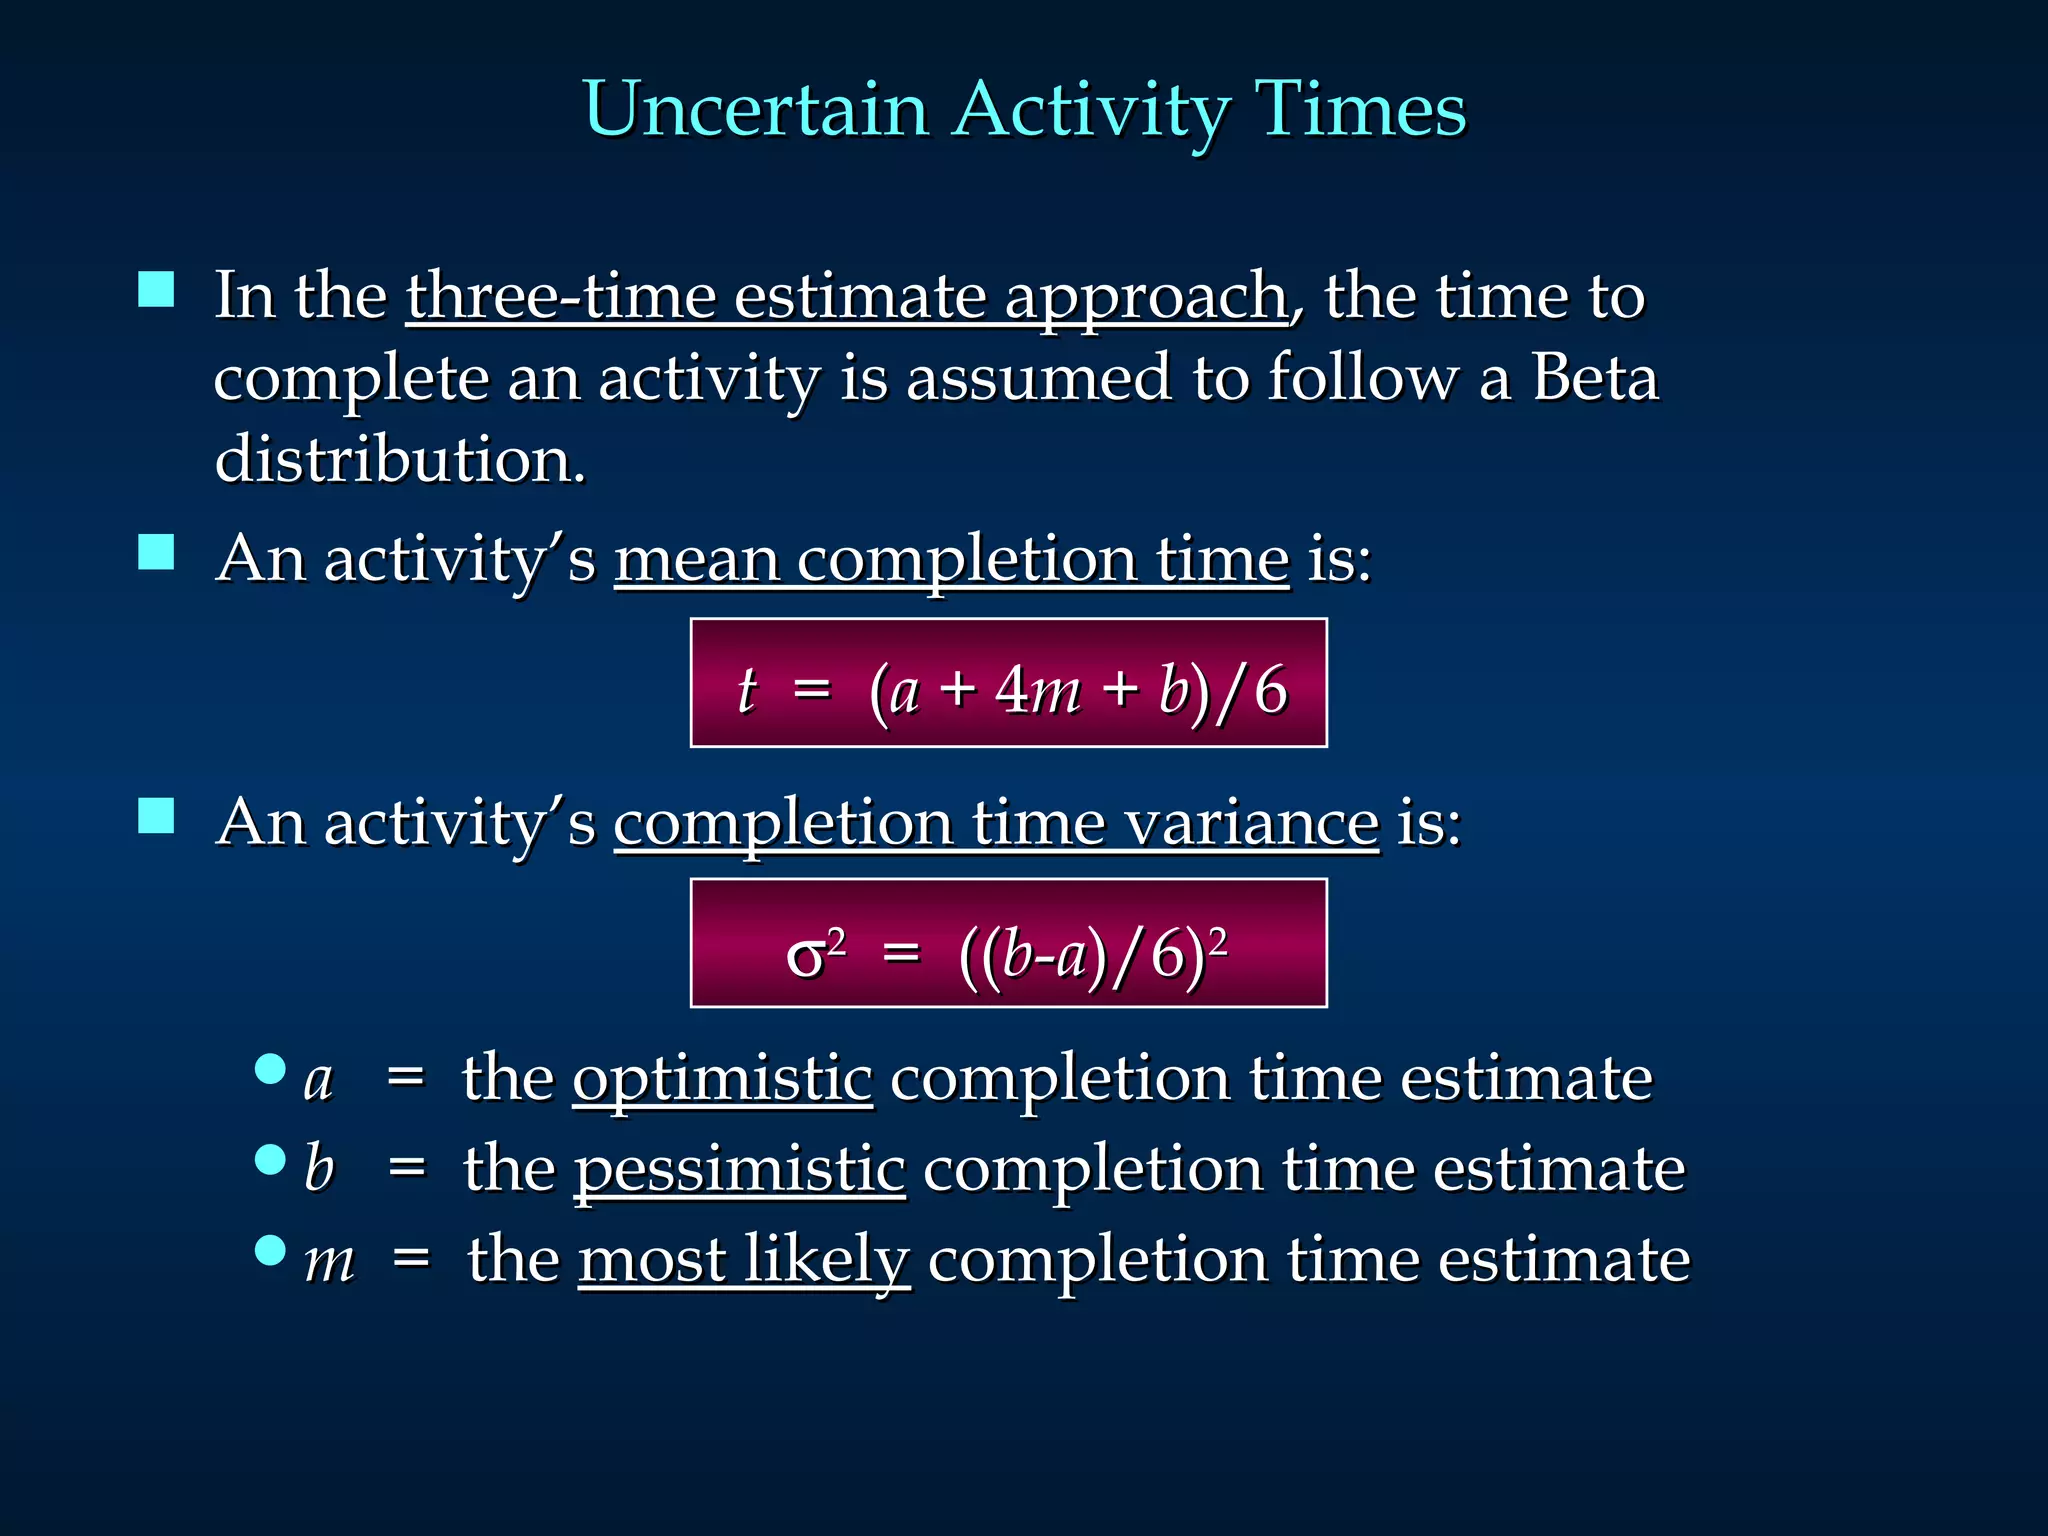
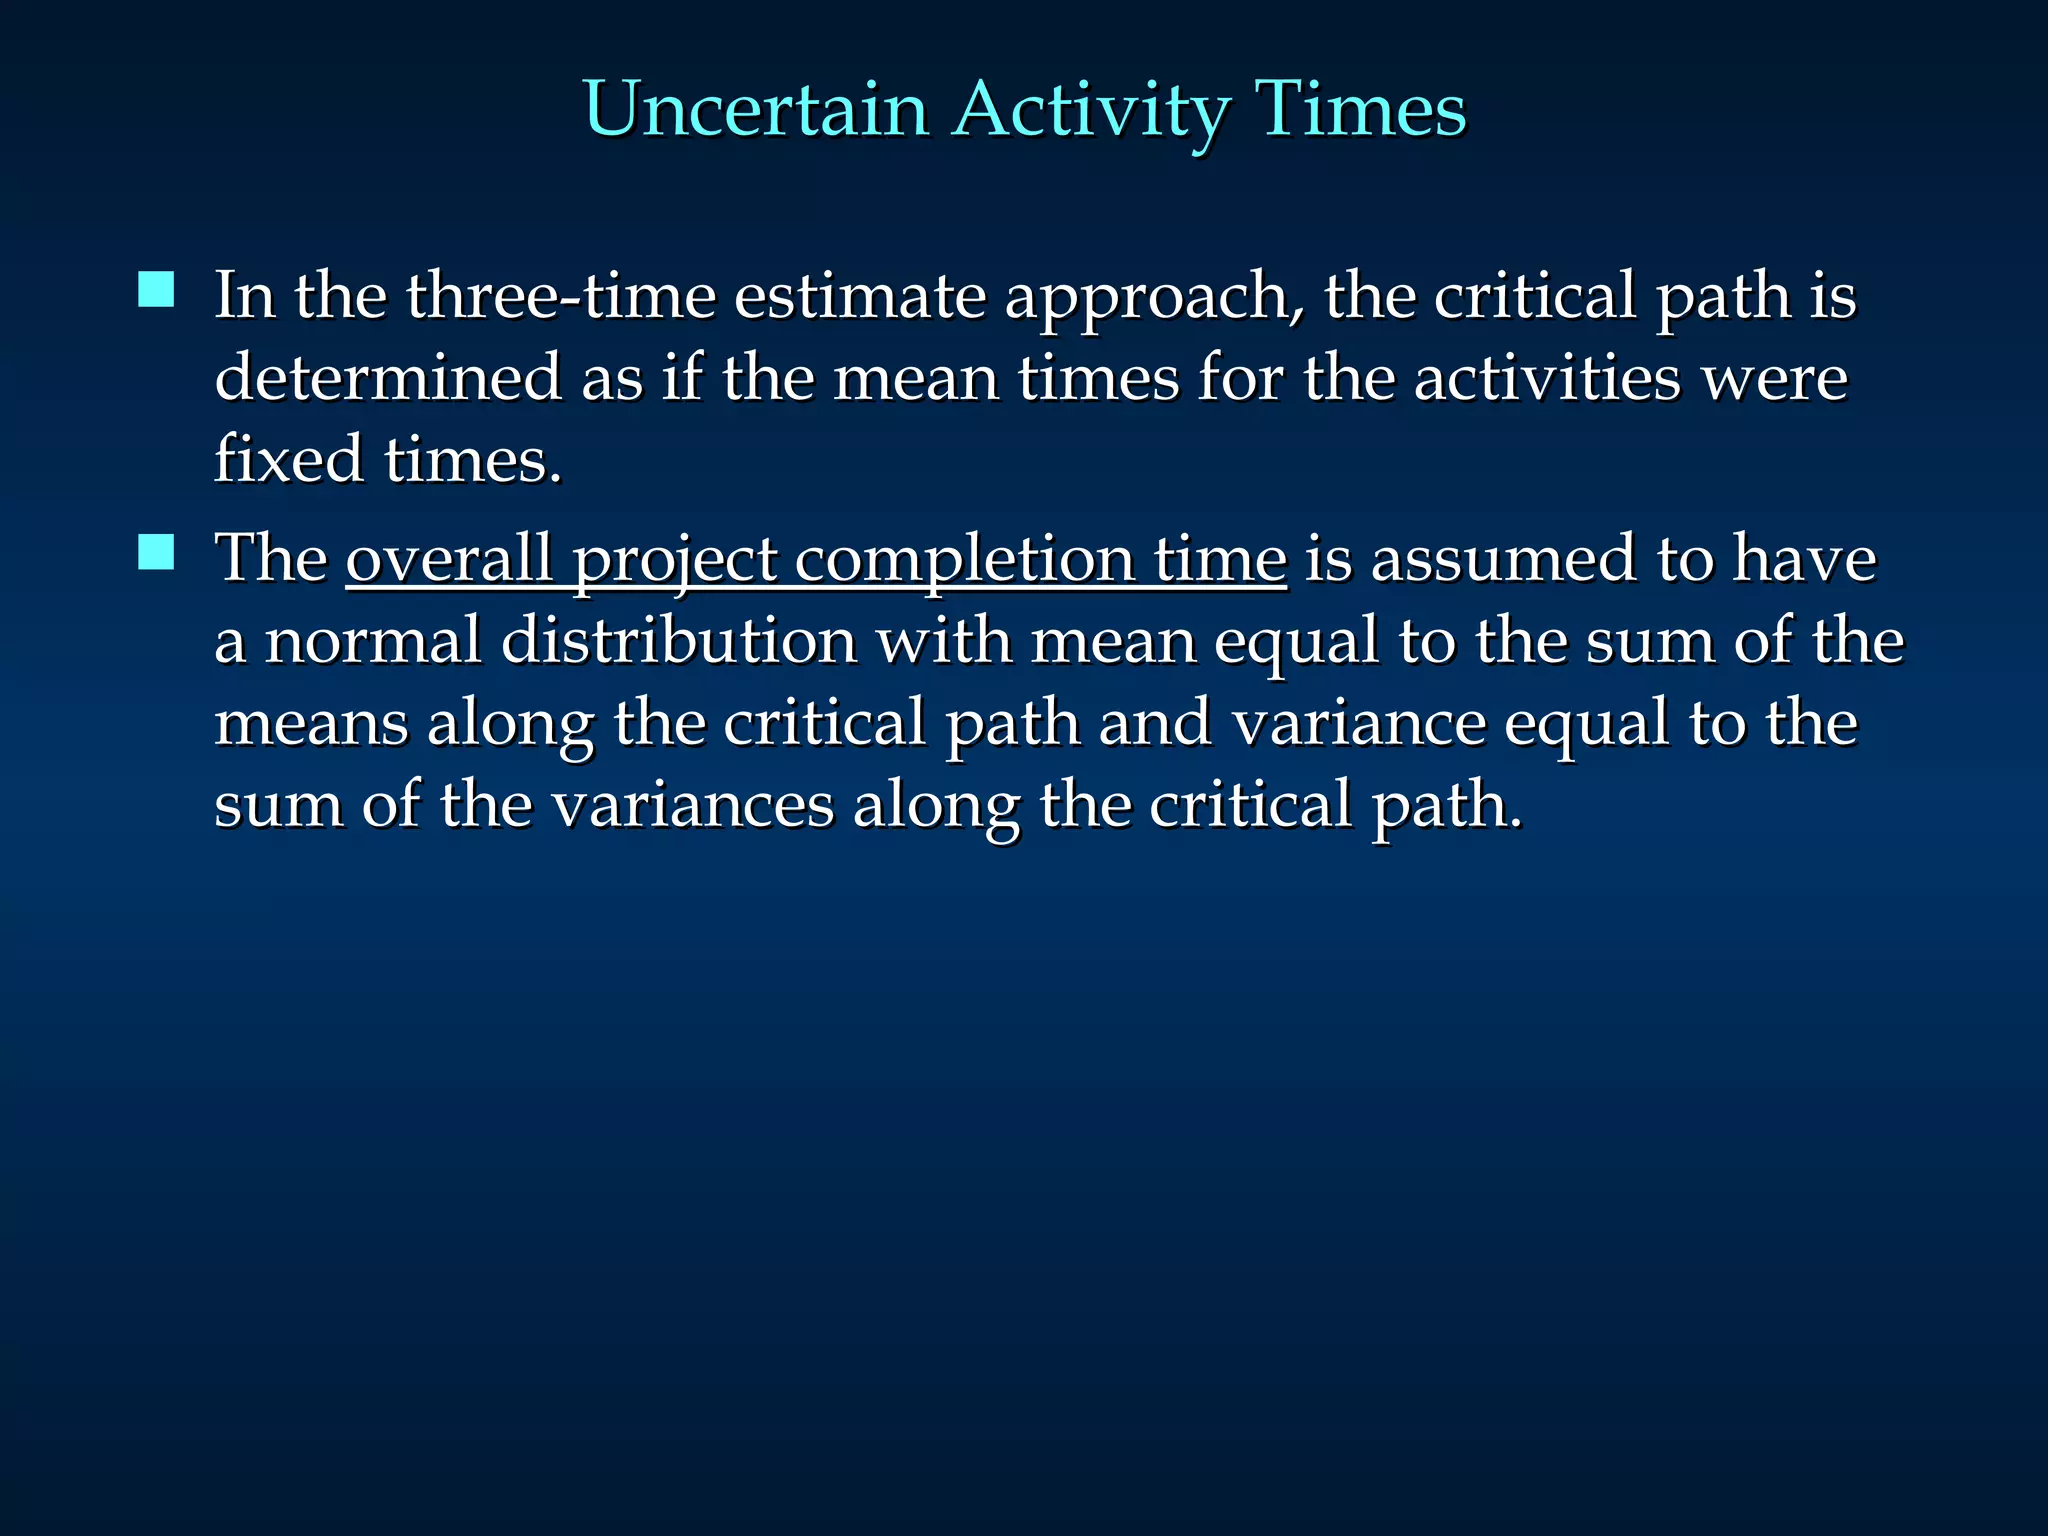
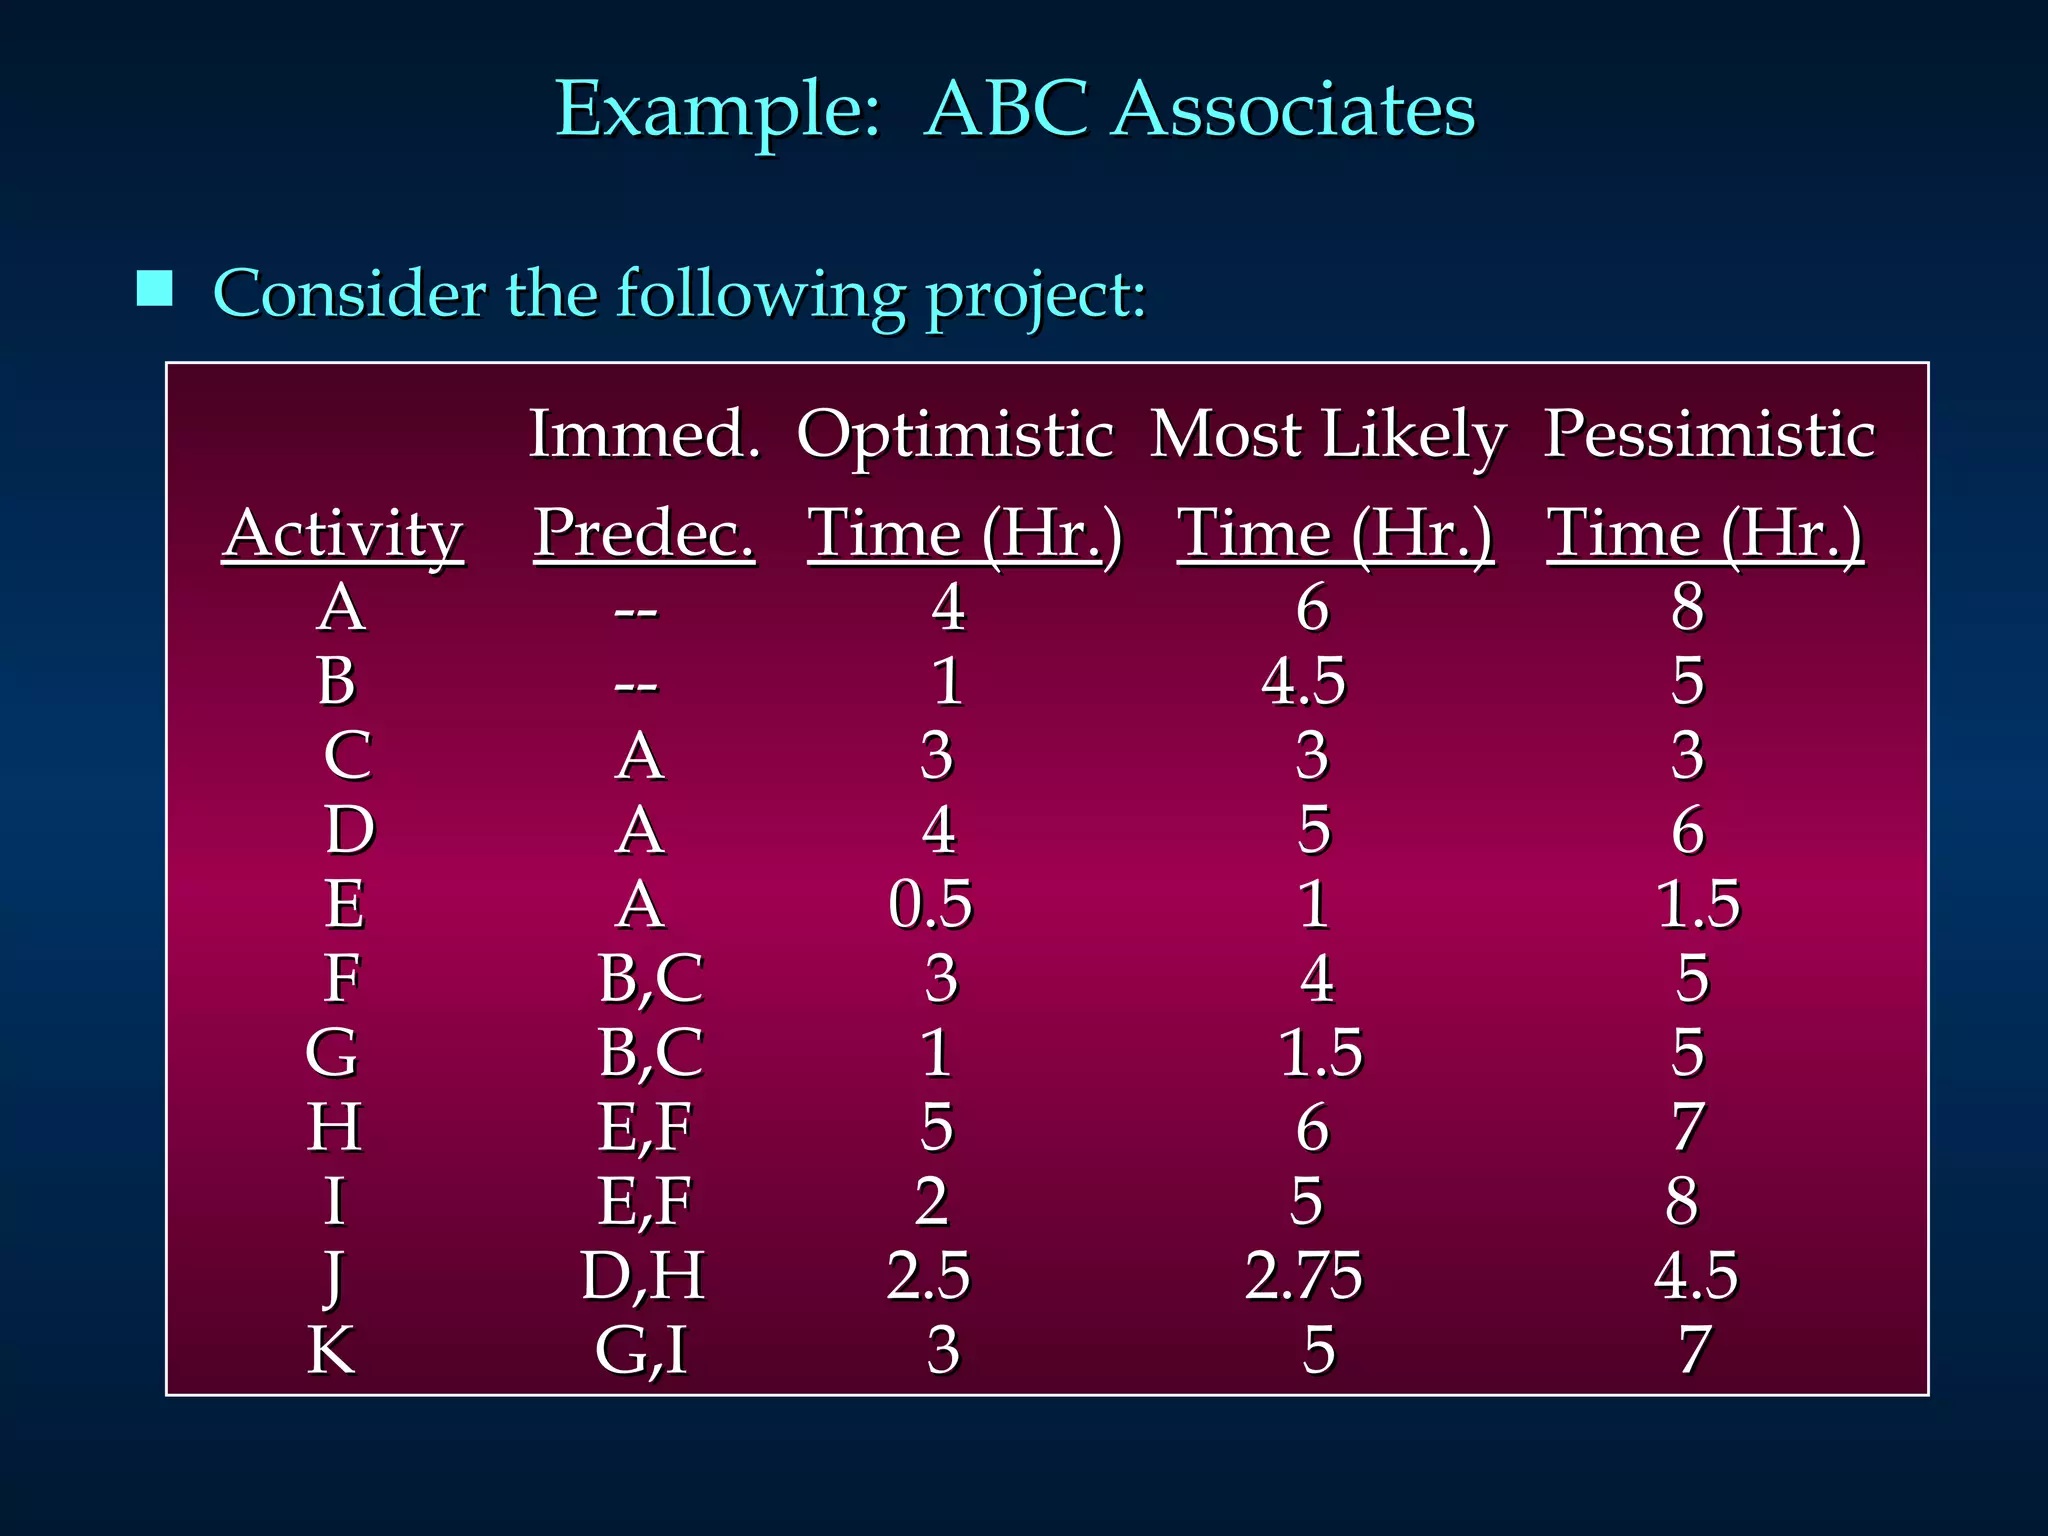
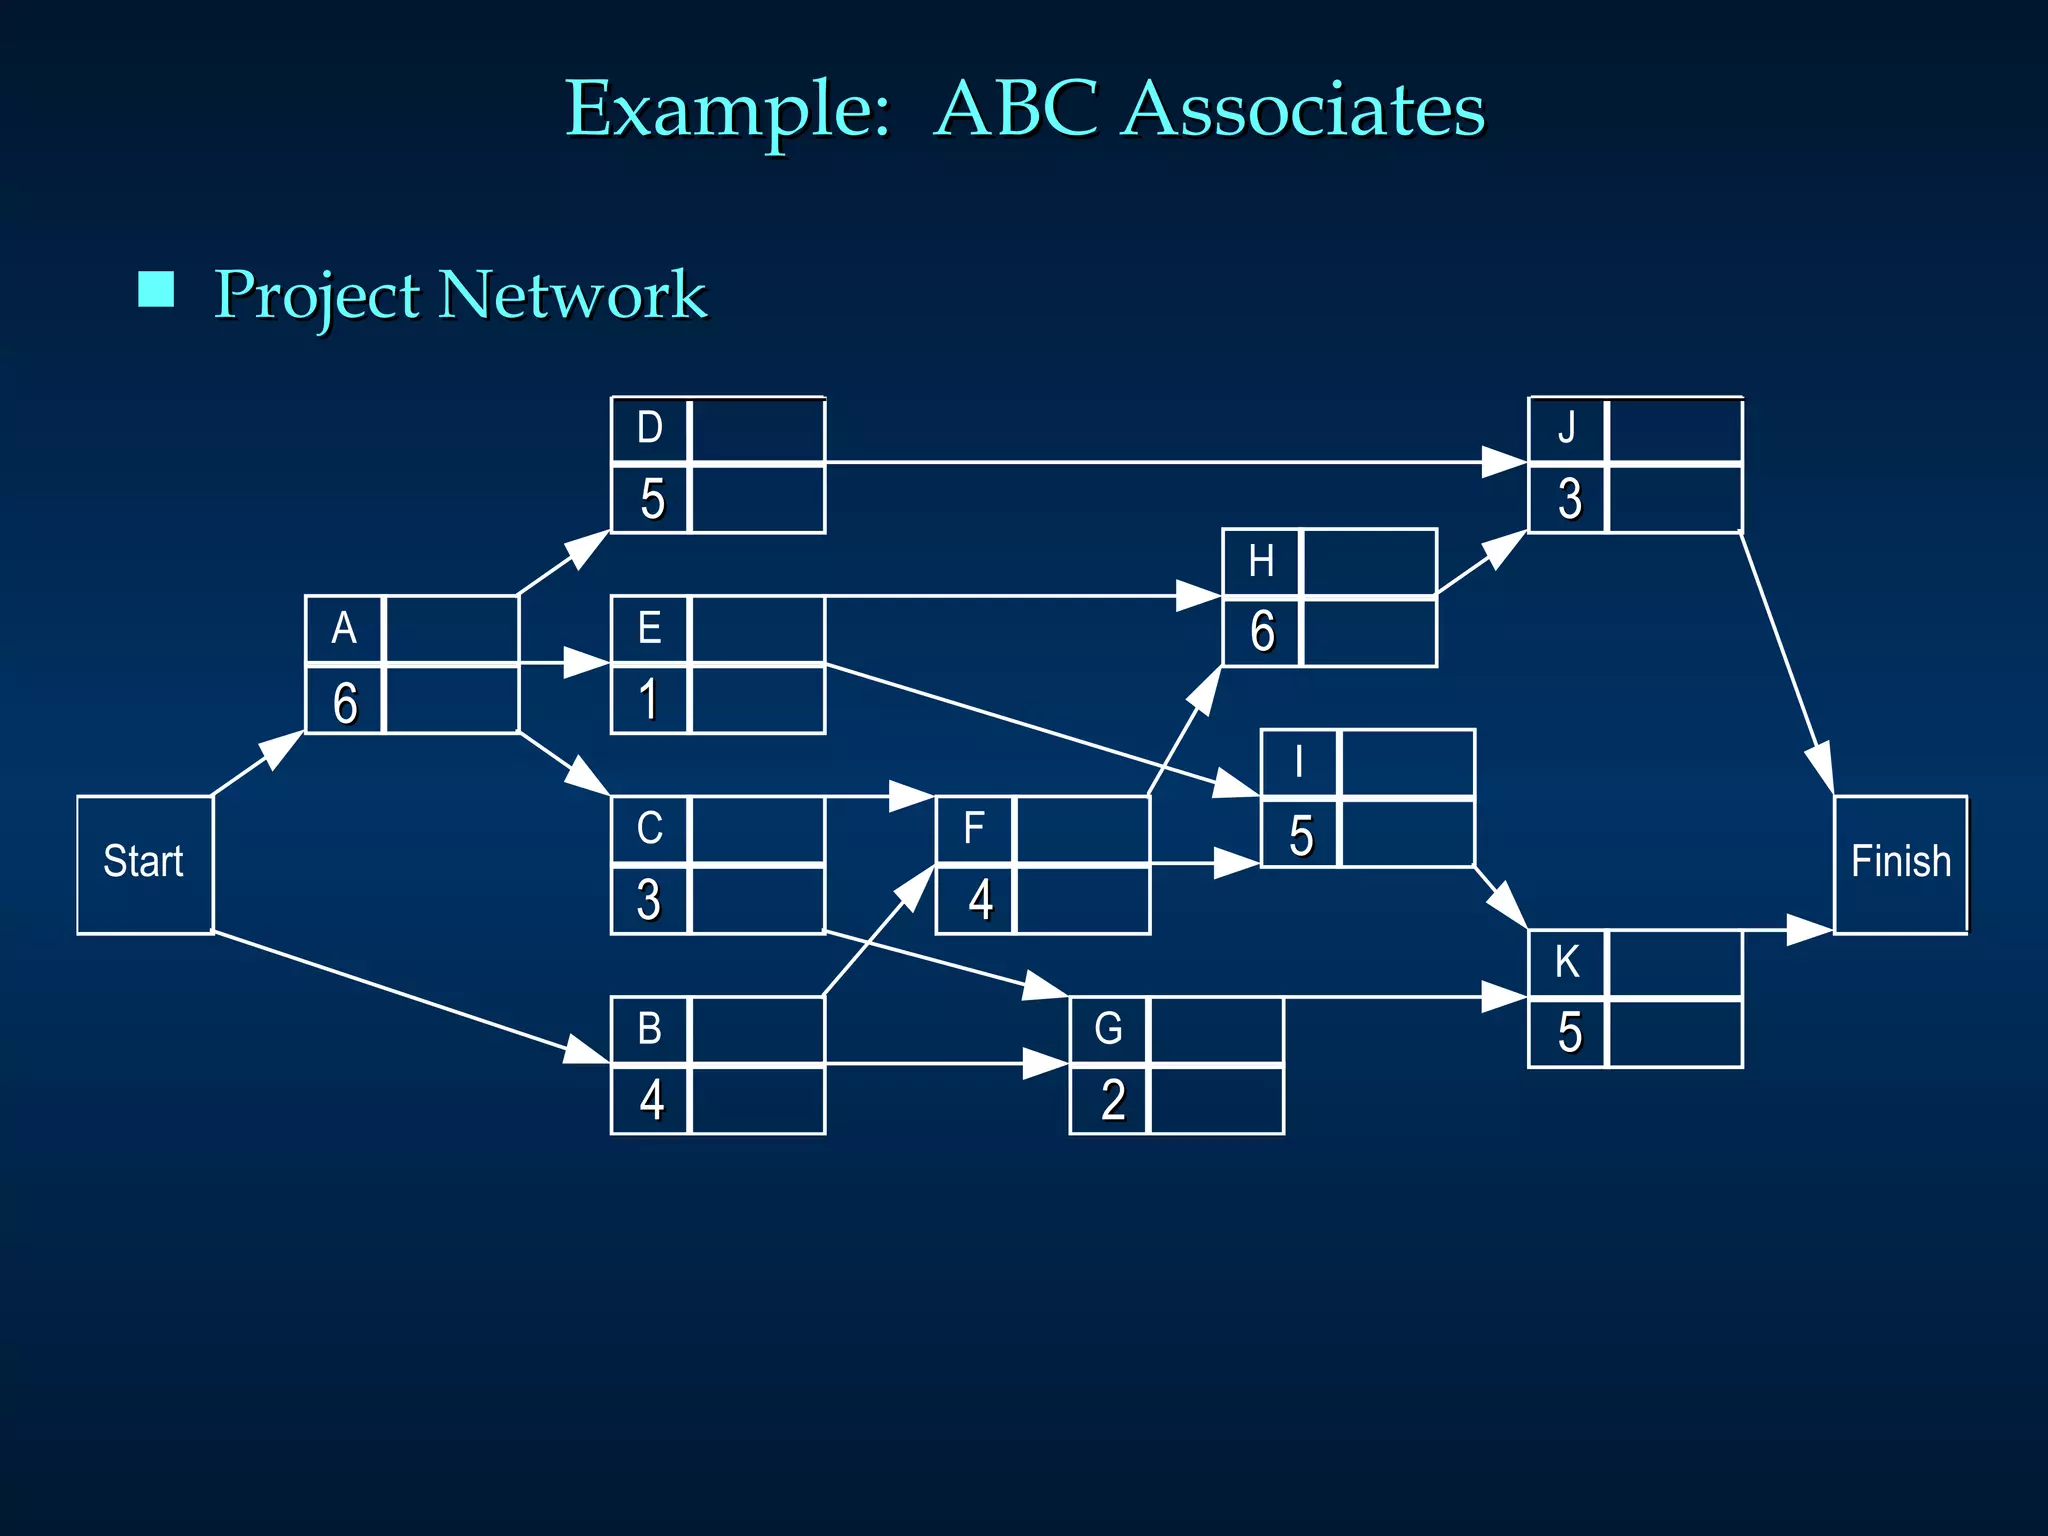
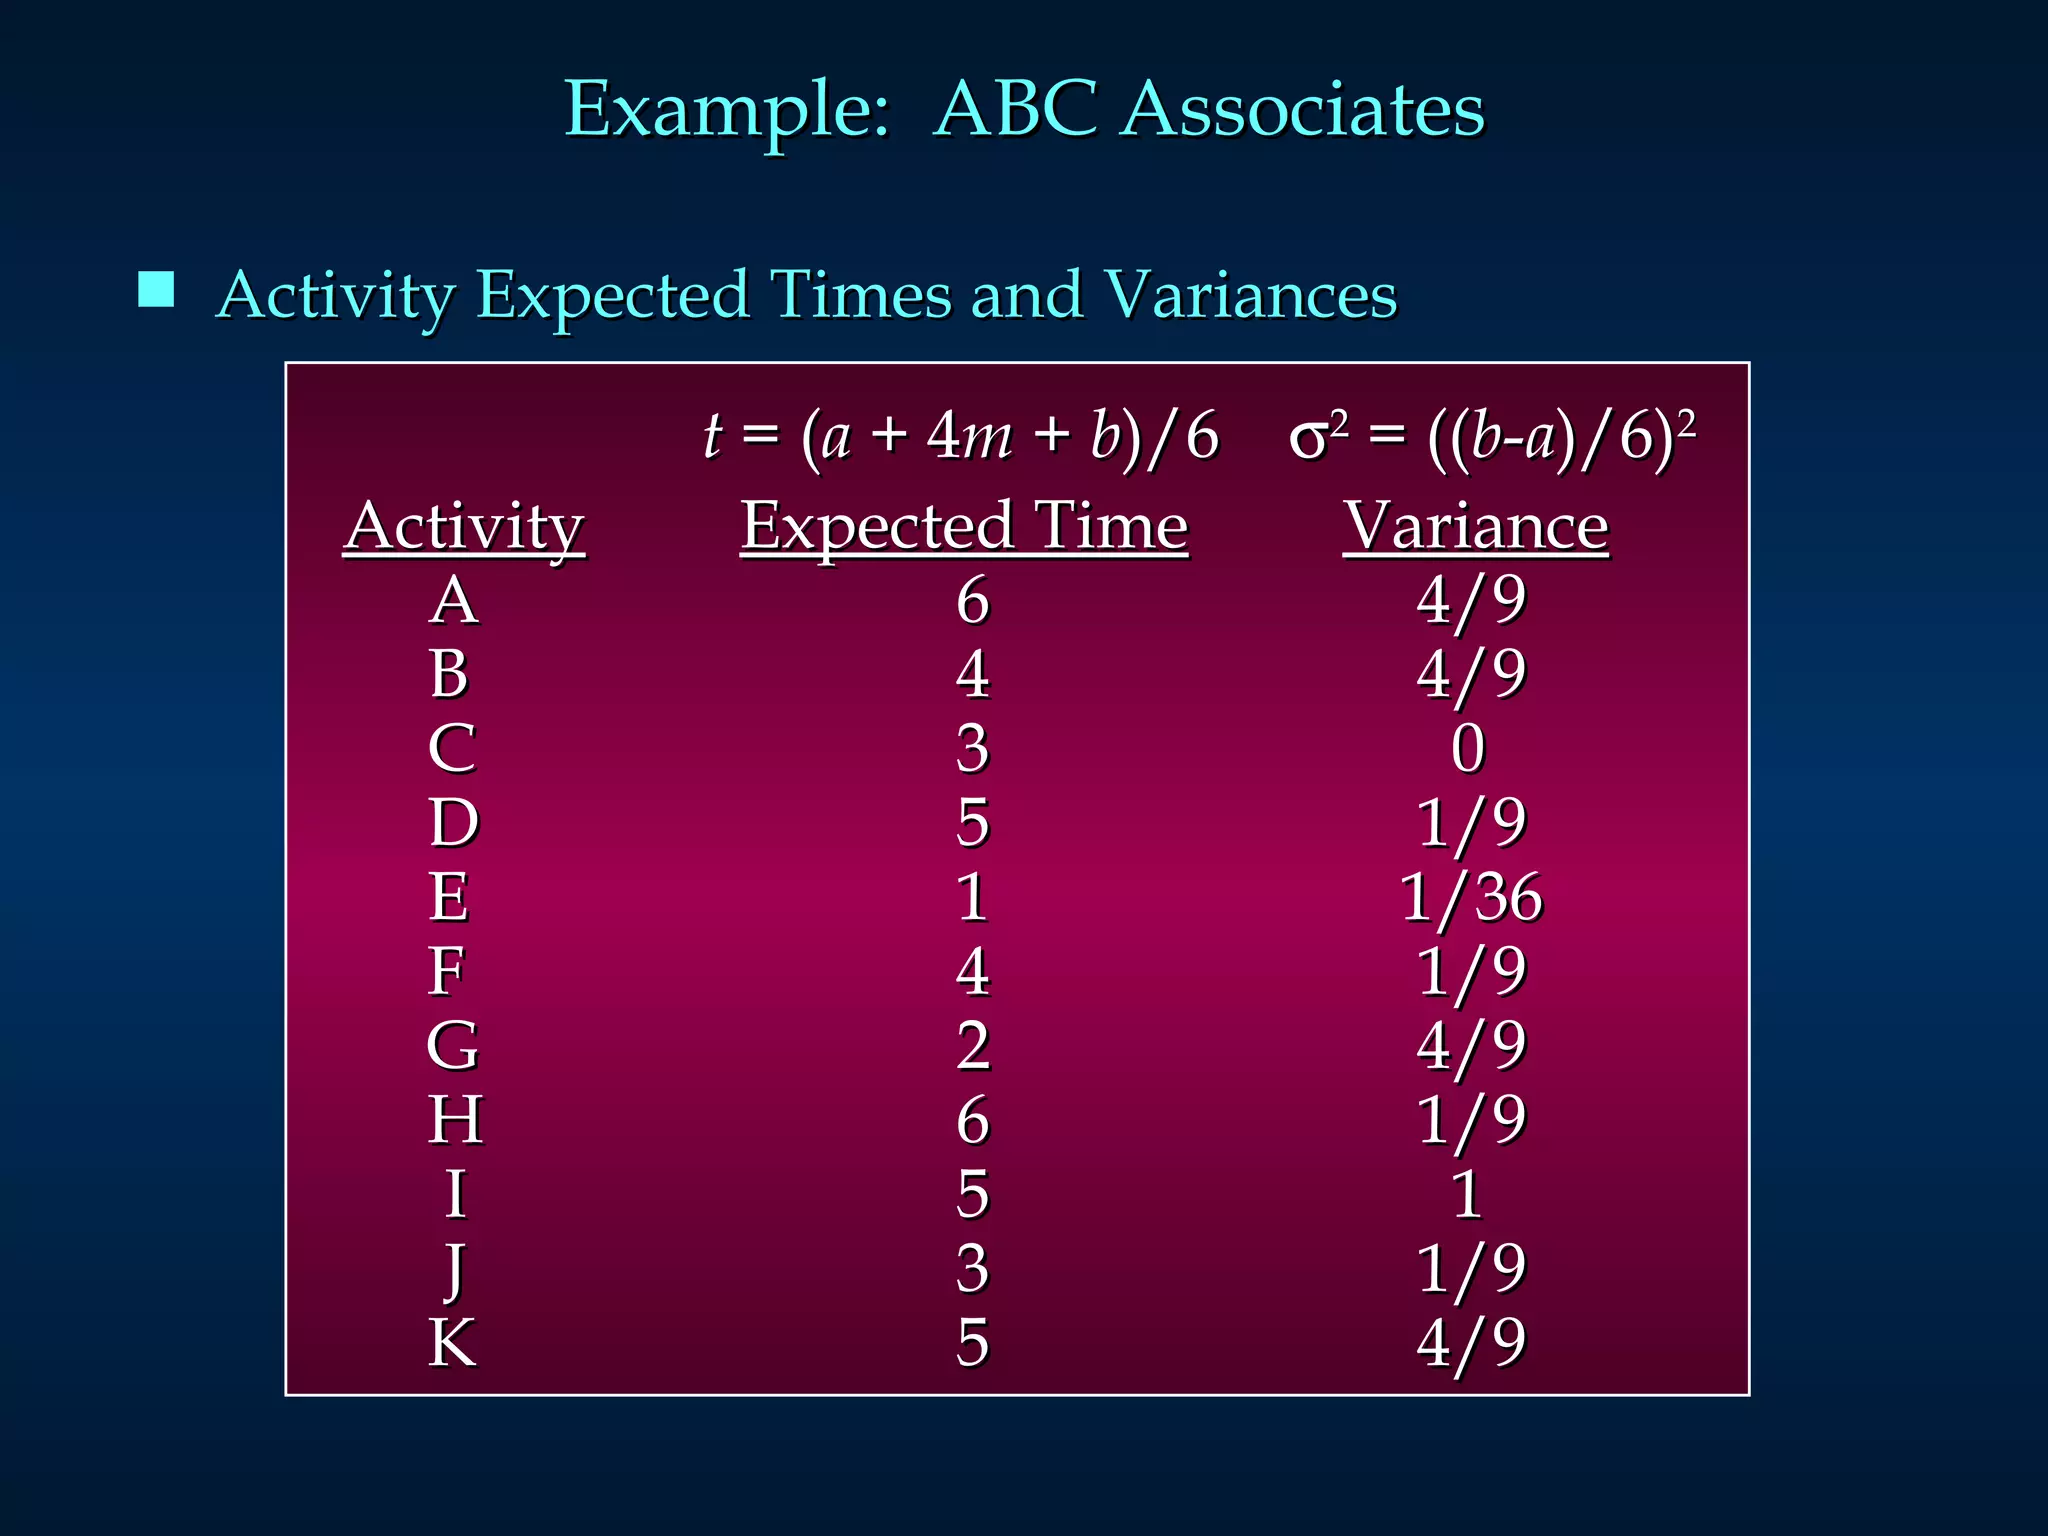
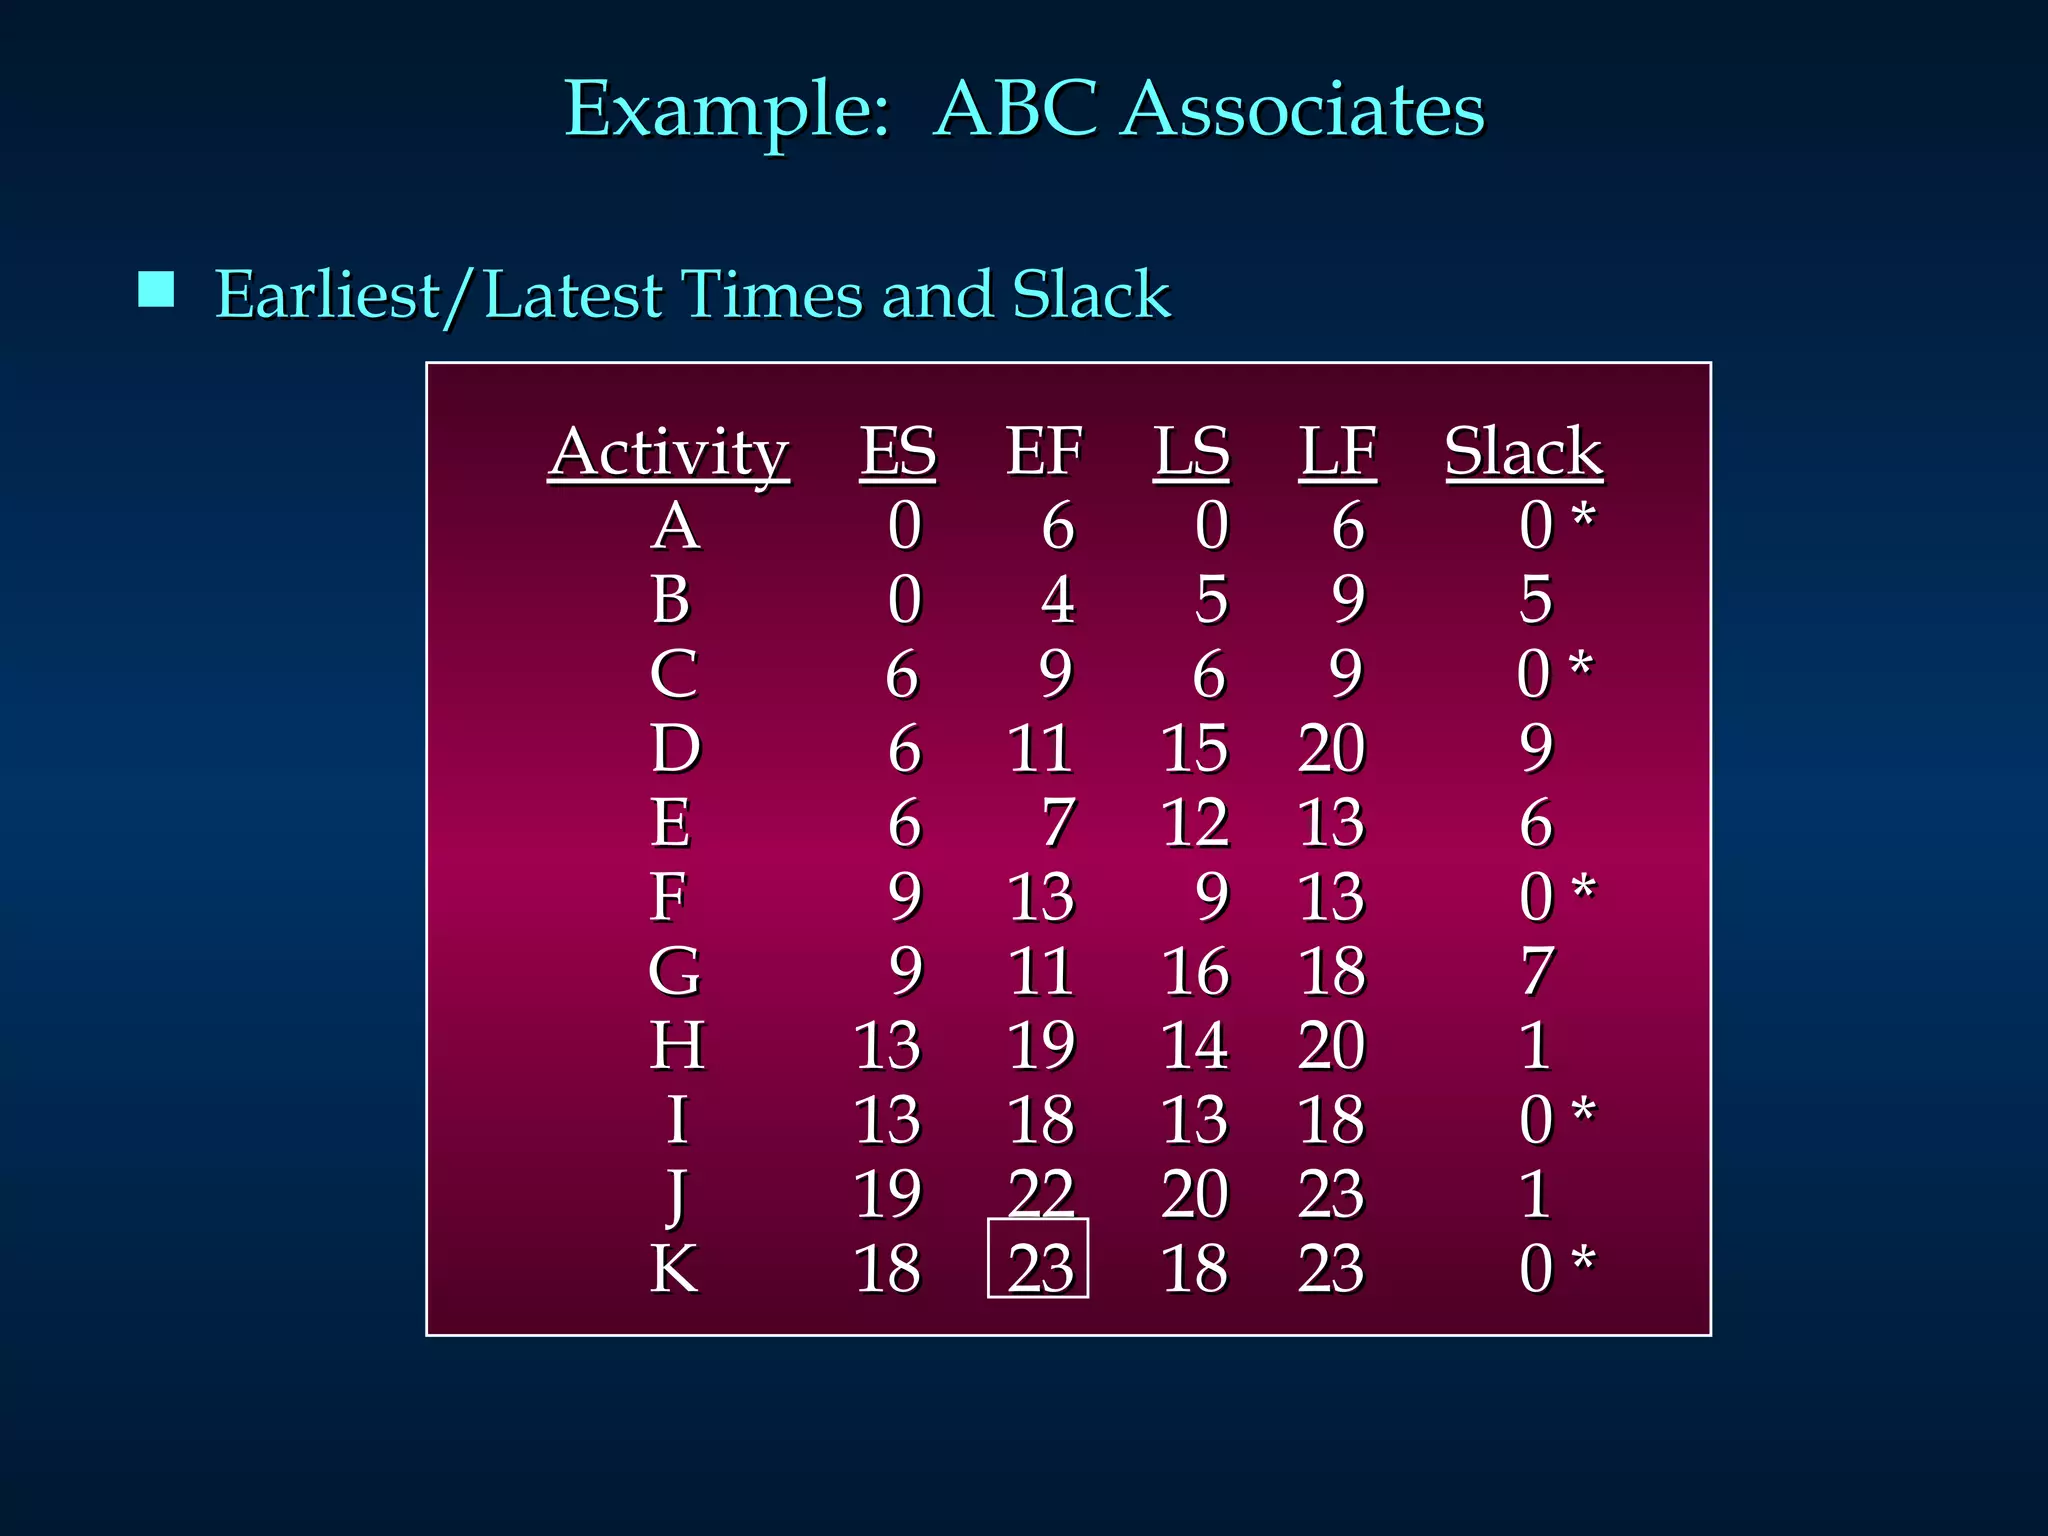
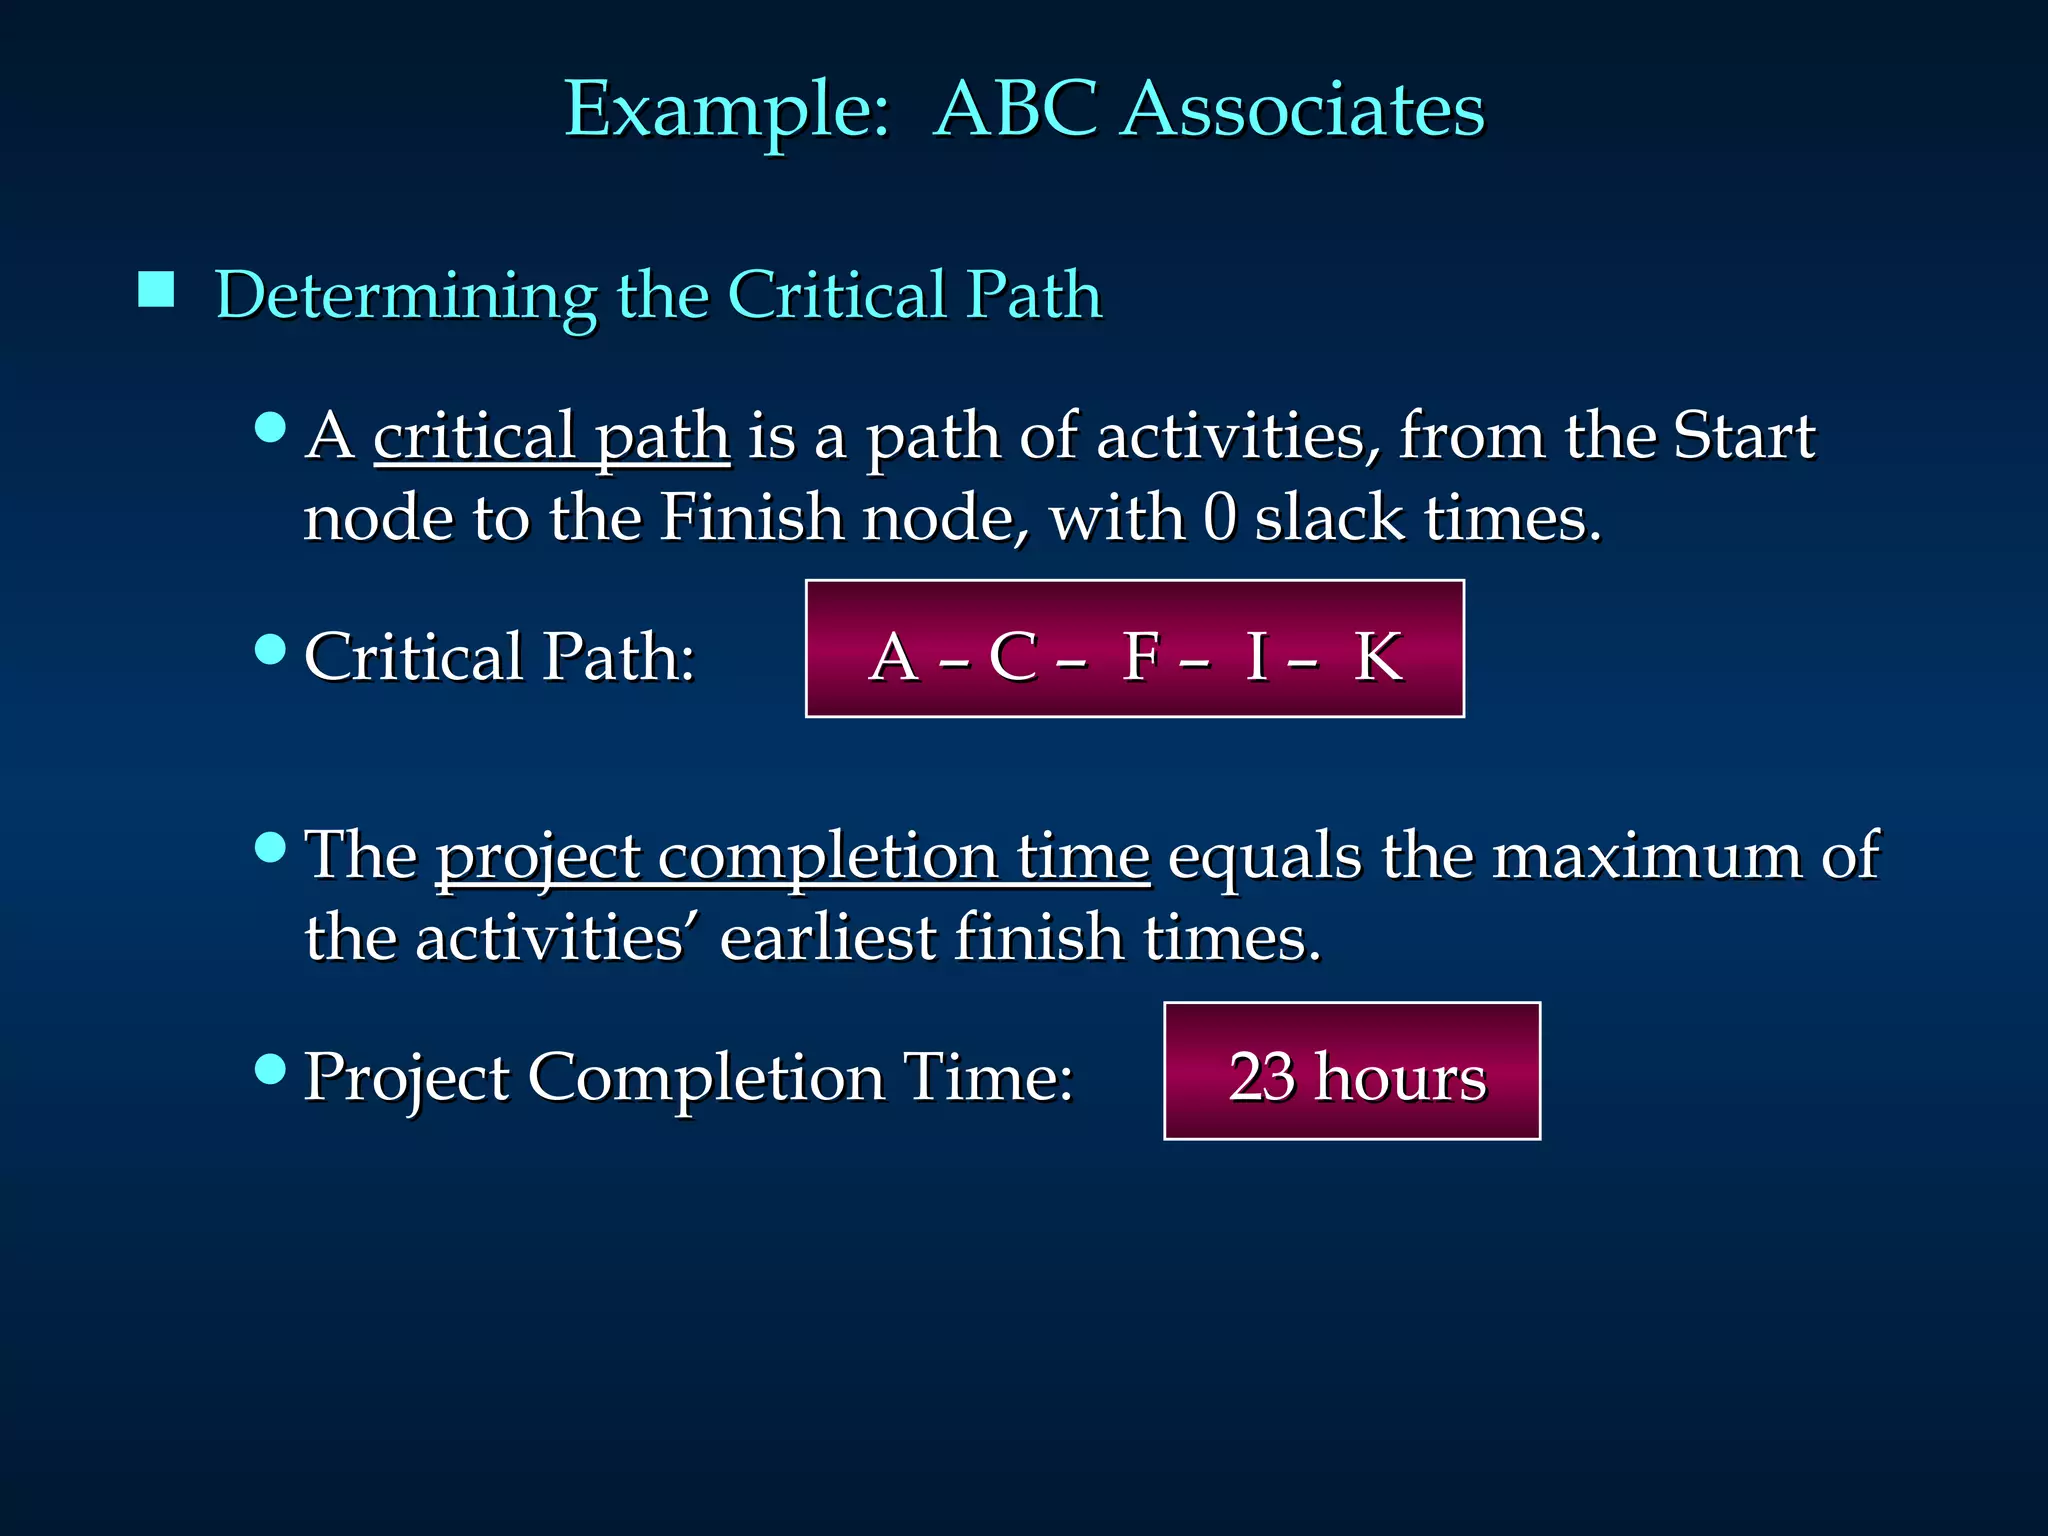
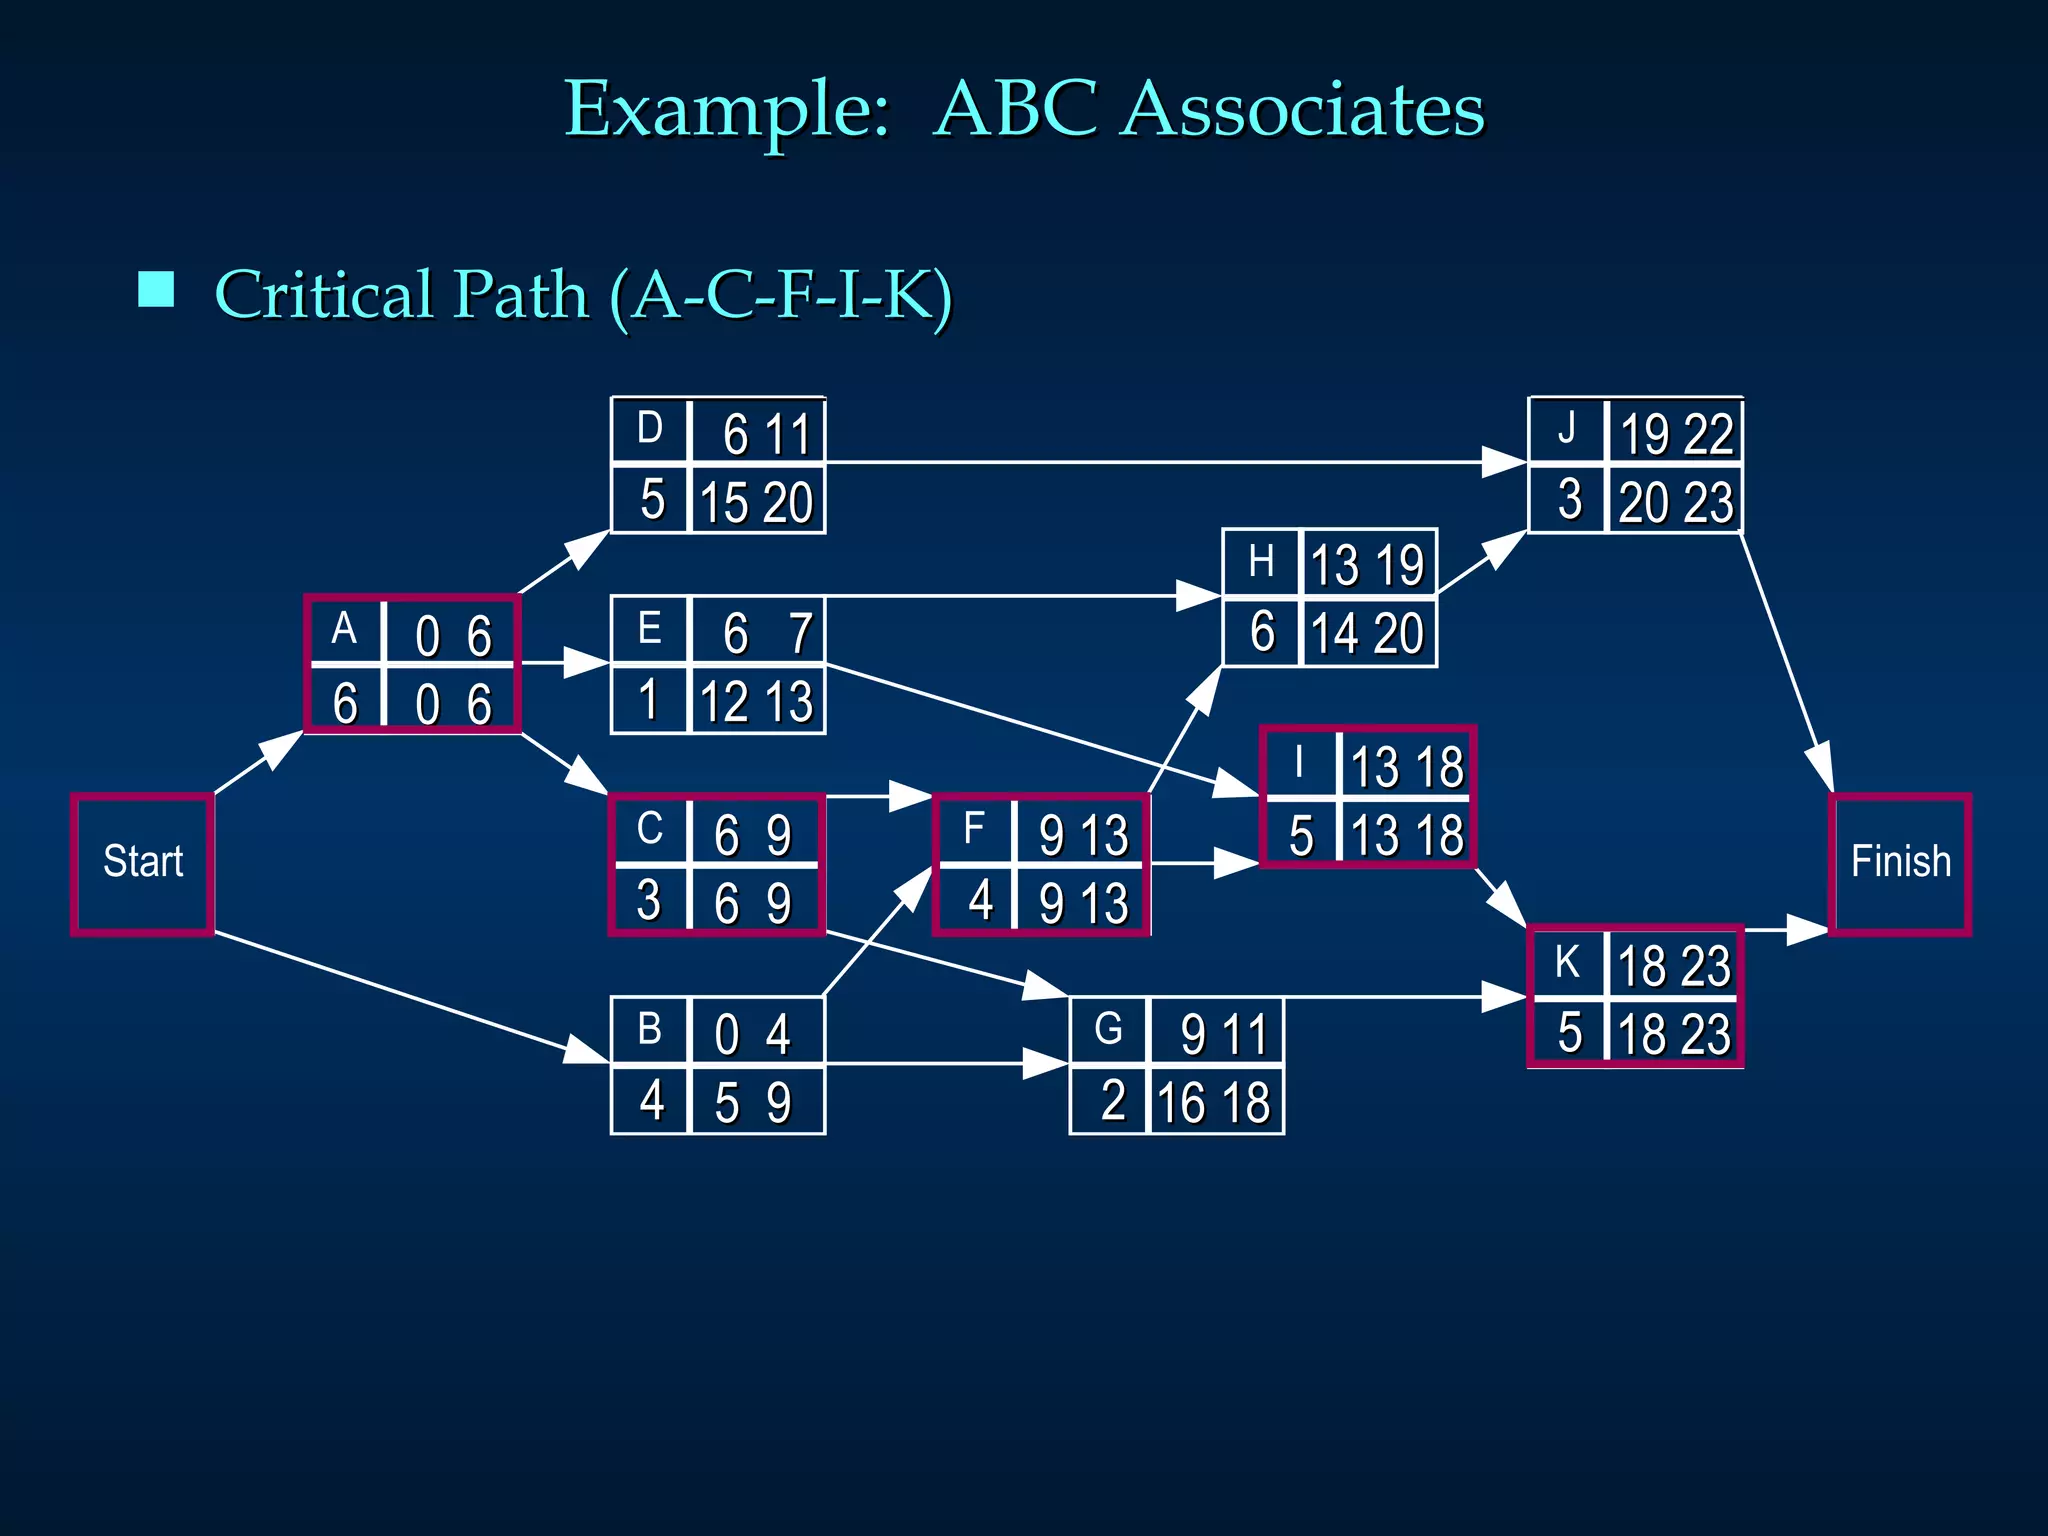
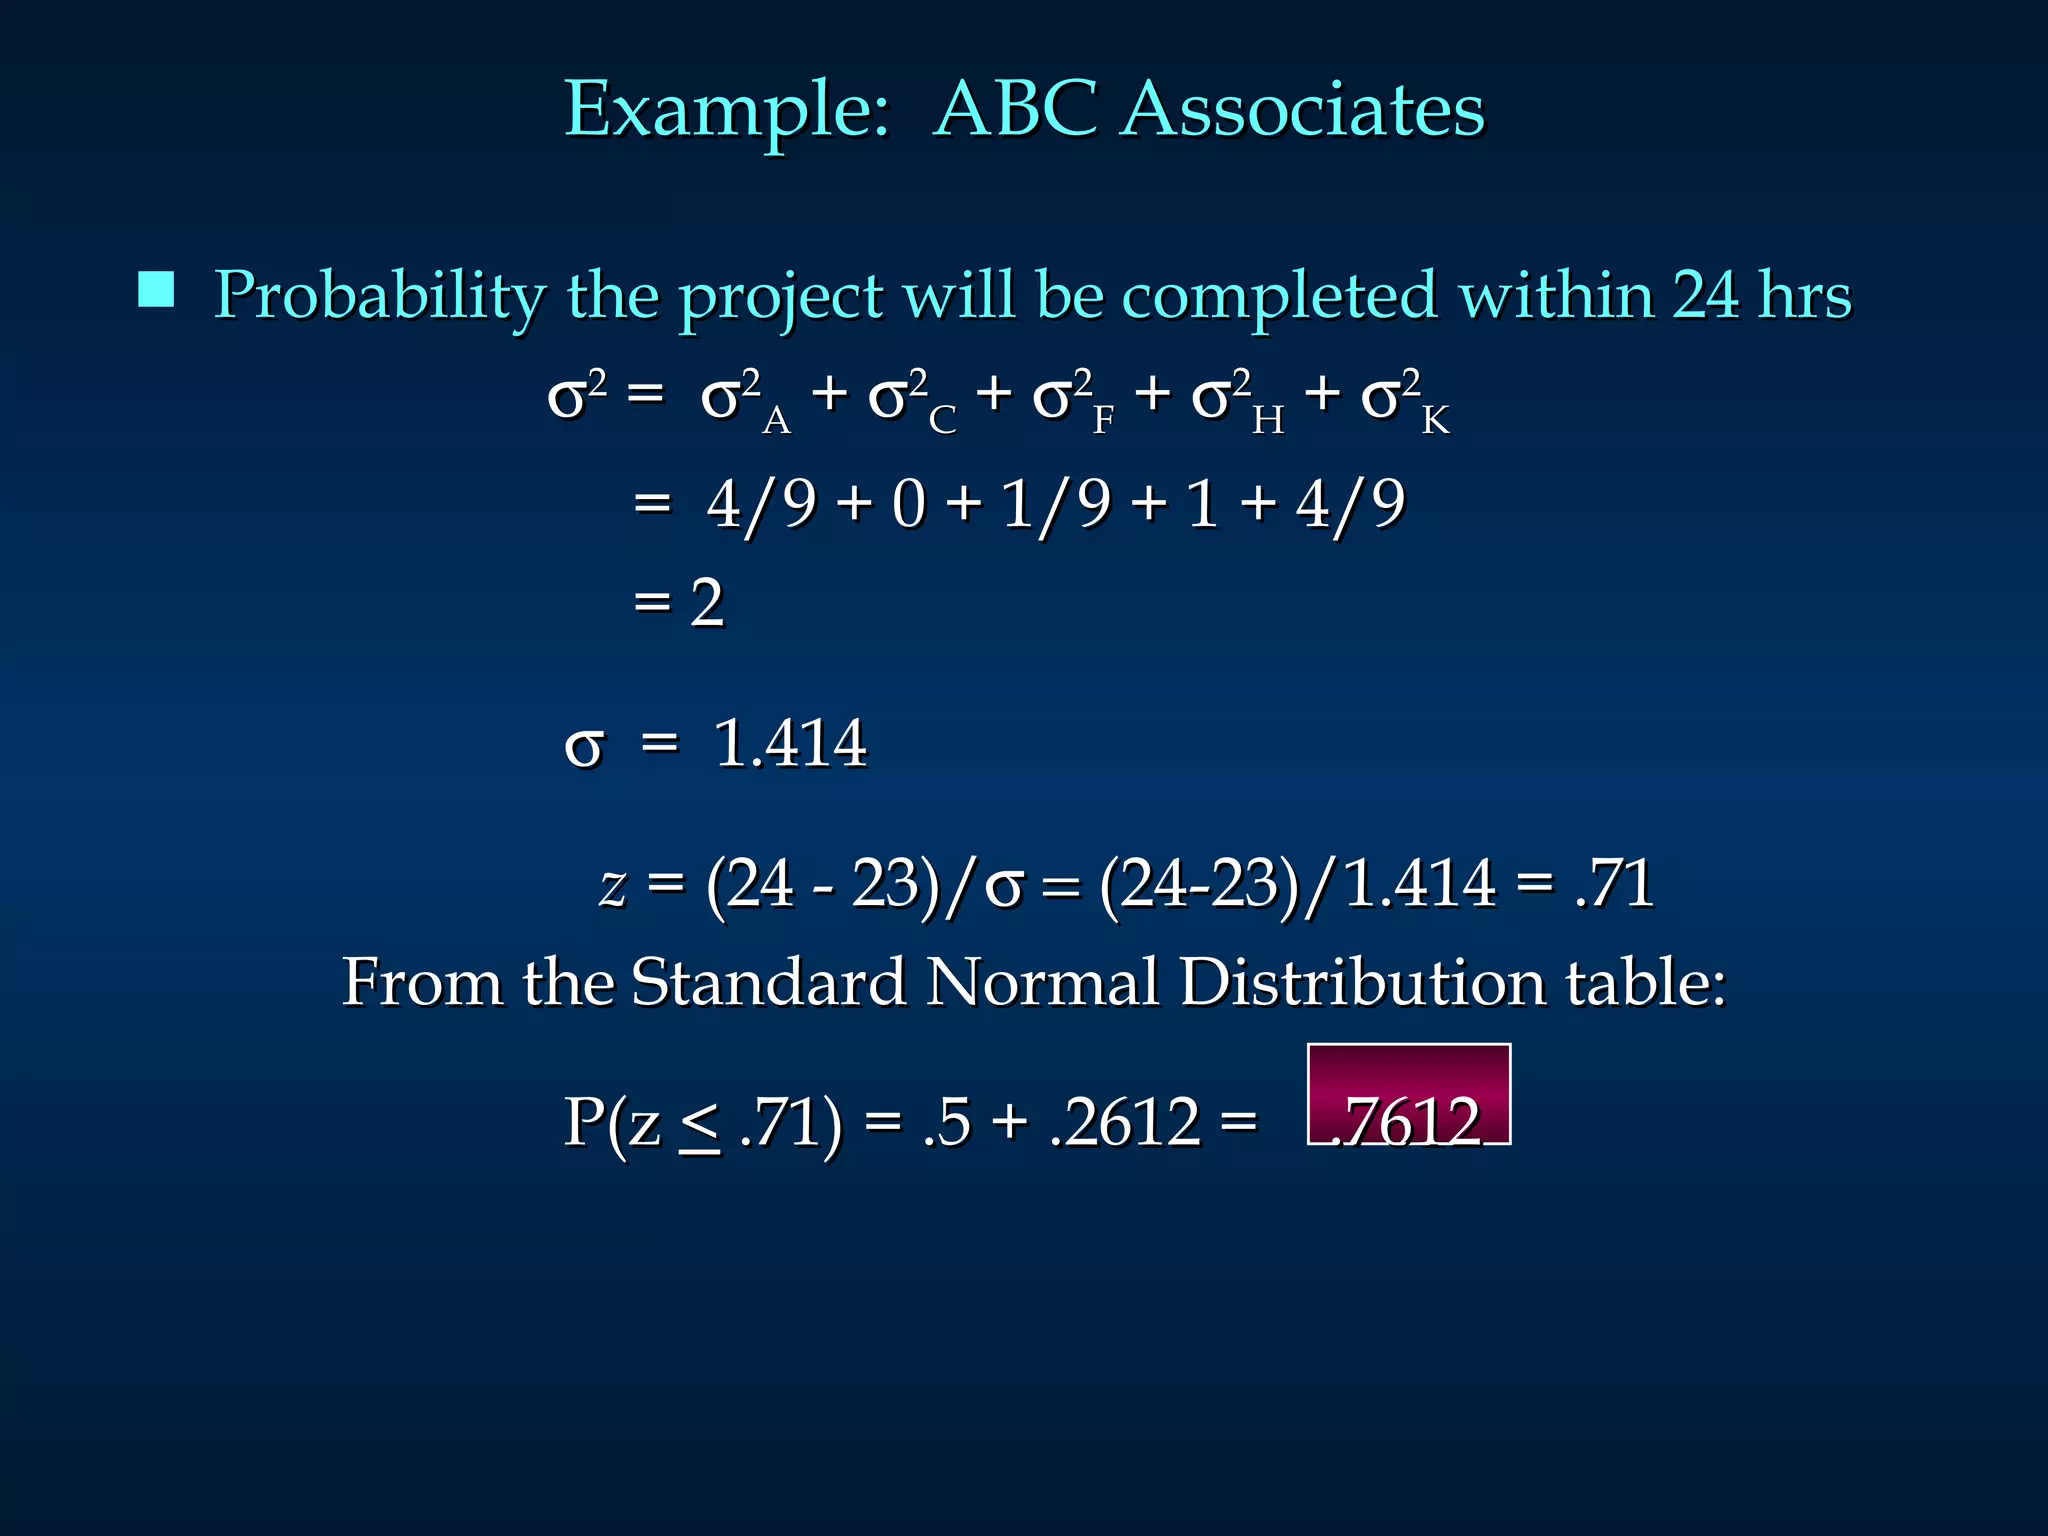
Slides Prepared by LEANDRO S. ESTADILLA Pamantasan ng Lungsod ng Maynila
Chapter 10 Project Scheduling: PERT/CPM Project Scheduling with Known Activity Times Project Scheduling with Uncertain Activity Times Considering Time-Cost Trade-Offs
PERT/CPM PERT Program Evaluation and Review Technique Developed by U.S. Navy for Polaris missile project Developed to handle uncertain activity times CPM Critical Path Method Developed by Du Pont & Remington Rand Developed for industrial projects for which activity times generally were known Today’s project management software packages have combined the best features of both approaches.
PERT/CPM PERT and CPM have been used to plan, schedule, and control a wide variety of projects: R&D of new products and processes Construction of buildings and highways Maintenance of large and complex equipment Design and installation of new systems
PERT/CPM PERT/CPM is used to plan the scheduling of individual  activities  that make up a project. Projects may have as many as several thousand activities. A complicating factor in carrying out the activities is that some activities depend on the completion of other activities before they can be started.
PERT/CPM Project managers rely on PERT/CPM to help them answer questions such as: What is the  total time  to complete the project? What are the  scheduled start and finish dates  for each specific activity? Which activities are  critical  and must be completed exactly as scheduled to keep the project on schedule? How long can  noncritical activities  be delayed before they cause an increase in the project completion time?
Project Network A  project network  can be constructed to model the precedence of the activities.  The  nodes  of the network represent the activities.  The  arcs  of the network reflect the precedence relationships of the activities.  A  critical path  for the network is a path consisting of activities with zero slack.
Example:  Frank’s Fine Floats Frank’s Fine Floats is in the business of building elaborate parade floats.  Frank and his crew have a new float to build and want to use PERT/CPM to help them manage the project  . The table on the next slide shows the activities that comprise the project.  Each activity’s estimated completion time (in days) and immediate predecessors are listed as well. Frank wants to know the total time to complete the project, which activities are critical, and the earliest and latest start and finish dates for each activity.
Example:  Frank’s Fine Floats   Immediate  Completion Activity   Description   Predecessors   Time (days)   A  Initial Paperwork    ---   3   B  Build Body    A   3   C  Build Frame    A   2   D  Finish Body    B     3   E  Finish Frame    C   7   F  Final Paperwork   B,C   3   G  Mount Body to Frame  D,E     6   H  Install Skirt on Frame  C   2
Example:  Frank’s Fine Floats Project Network Start Finish B 3 D 3 A 3 C 2 G 6 F 3 H 2 E 7
Earliest Start and Finish Times Step 1:   Make a forward pass through the network as follows:  For each activity  i  beginning at the Start  node ,  compute: Earliest Start Time  = the maximum of the earliest finish times of all activities immediately preceding activity  i . (This is 0 for an activity with no predecessors.) Earliest Finish Time  = (Earliest Start Time) + (Time to complete activity  i  ). The project completion time is the maximum of the Earliest Finish Times at the Finish node.
Example:  Frank’s Fine Floats Earliest Start and Finish Times Start Finish 3  6 B 3 6  9 D 3 0  3 A 3 3  5 C 2 12 18 G 6 6  9 F 3 5  7 H 2 5  12 E 7
Latest Start and Finish Times Step 2:   Make a backwards pass through the network as follows:  Move sequentially backwards from the Finish node to the Start node.  At a given node,  j , consider all activities ending at node  j .  For each of these activities,  i , compute: Latest Finish Time  = the minimum of the latest start times beginning at node  j .  (For node  N , this is the project completion time.) Latest Start Time  = (Latest Finish Time) - (Time to complete activity  i  ).
Example:  Frank’s Fine Floats Latest Start and Finish Times Start Finish 3  6 6  9 B 3 6  9 9  12 D 3 0  3 0  3 A 3 3  5 3  5 C 2 12 18 12 18 G 6 6  9 15 18 F 3 5  7 16 18 H 2 5  12 5  12 E 7
Determining the Critical Path Step 3:   Calculate the slack time for each activity by:  Slack  = (Latest Start) - (Earliest Start), or    = (Latest Finish) - (Earliest Finish).
Example:  Frank’s Fine Floats Activity Slack Time   Activity   ES   EF   LS   LF   Slack   A  0  3  0  3  0  (crit.)   B  3  6  6  9  3   C  3  5  3  5  0  (crit.)   D  6  9  9  12  3   E  5  12  5  12  0  (crit.)   F  6  9  15  18  9   G  12  18  12  18  0  (crit.)   H  5  7  16  18  11
Determining the Critical Path A  critical path  is a path of activities, from the Start node to the Finish node, with 0 slack times. Critical Path:  A – C – E – G The  project completion time  equals the maximum of the activities’ earliest finish times. Project Completion Time:  18 days Example:  Frank’s Fine Floats
Example:  Frank’s Fine Floats Critical Path Start Finish 3  6 6  9 B 3 6  9 9  12 D 3 0  3 0  3 A 3 3  5 3  5 C 2 12 18 12 18 G 6 6  9 15 18 F 3 5  7 16 18 H 2 5  12 5  12 E 7
In the  three-time estimate approach , the time to complete an activity is assumed to follow a Beta distribution.  An activity’s  mean completion time  is:       t   =  ( a  + 4 m  +  b )/6 An activity’s  completion time variance  is:    2   =  (( b - a )/6) 2 a   =  the  optimistic  completion time estimate b   =  the  pessimistic  completion time estimate m   =  the  most likely  completion time estimate Uncertain Activity Times
Uncertain Activity Times In the three-time estimate approach, the critical path is determined as if the mean times for the activities were fixed times.  The  overall project completion time  is assumed to have a normal distribution with mean equal to the sum of the means along the critical path and variance equal to the sum of the variances along the critical path.
Example:  ABC Associates  Consider the following project: Immed.  Optimistic  Most Likely  Pessimistic Activity   Predec.   Time (Hr. )  Time (Hr.)   Time (Hr.)   A    --  4    6    8   B    --  1    4.5  5 C    A    3  3  3 D    A  4  5    6  E    A  0.5  1  1.5 F    B,C  3  4  5 G    B,C    1  1.5  5 H    E,F    5  6  7 I    E,F  2  5  8 J    D,H    2.5  2.75  4.5 K    G,I  3  5  7
Example:  ABC Associates Project Network 6 4 3 5 5 2 4 1 6 3 5
Example:  ABC Associates Activity Expected Times and Variances   t  = ( a  + 4 m  +  b )/6   2  = (( b - a )/6) 2 Activity   Expected Time   Variance     A    6    4/9 B    4    4/9 C    3    0 D    5    1/9 E    1    1/36 F    4    1/9 G    2    4/9 H    6    1/9 I    5    1 J    3    1/9 K    5    4/9
Example:  ABC Associates Earliest/Latest Times and Slack Activity   ES   EF  LS   LF   Slack     A    0  6  0  6  0 * B    0  4  5  9  5 C  6  9  6  9  0 * D    6  11  15  20  9 E    6  7  12  13  6 F    9  13  9  13  0 * G  9  11  16  18  7 H    13  19  14  20  1 I    13  18  13  18  0 * J    19  22  20  23  1 K    18  23  18  23  0 *
Determining the Critical Path A  critical path  is a path of activities, from the Start node to the Finish node, with 0 slack times. Critical Path:  A – C –  F –  I –  K The  project completion time  equals the maximum of the activities’ earliest finish times. Project Completion Time:  23 hours Example:  ABC Associates
Example:  ABC Associates Critical Path (A-C-F-I-K) 0  6 0  6 9 13 9 13 13 18 13 18 9 11 16 18 13 19 14 20 19 22 20 23 18 23 18 23 6  7 12 13 6  9 6  9 0  4 5  9 6 11 15 20 6 4 3 5 5 2 4 1 6 3 5
Example:  ABC Associates Probability the project will be completed within 24 hrs  2  =   2 A  +   2 C  +   2 F  +   2 H  +   2 K   =  4/9 + 0 + 1/9 + 1 + 4/9    = 2      =  1.414   z  = (24 - 23)/  (24-23)/1.414 = .71 From the Standard Normal Distribution table:   P(z  <  .71) = .5 + .2612 =  .7612

Pert cpm

  • 1.
    Slides Prepared byLEANDRO S. ESTADILLA Pamantasan ng Lungsod ng Maynila
  • 2.
    Chapter 10 ProjectScheduling: PERT/CPM Project Scheduling with Known Activity Times Project Scheduling with Uncertain Activity Times Considering Time-Cost Trade-Offs
  • 3.
    PERT/CPM PERT ProgramEvaluation and Review Technique Developed by U.S. Navy for Polaris missile project Developed to handle uncertain activity times CPM Critical Path Method Developed by Du Pont & Remington Rand Developed for industrial projects for which activity times generally were known Today’s project management software packages have combined the best features of both approaches.
  • 4.
    PERT/CPM PERT andCPM have been used to plan, schedule, and control a wide variety of projects: R&D of new products and processes Construction of buildings and highways Maintenance of large and complex equipment Design and installation of new systems
  • 5.
    PERT/CPM PERT/CPM isused to plan the scheduling of individual activities that make up a project. Projects may have as many as several thousand activities. A complicating factor in carrying out the activities is that some activities depend on the completion of other activities before they can be started.
  • 6.
    PERT/CPM Project managersrely on PERT/CPM to help them answer questions such as: What is the total time to complete the project? What are the scheduled start and finish dates for each specific activity? Which activities are critical and must be completed exactly as scheduled to keep the project on schedule? How long can noncritical activities be delayed before they cause an increase in the project completion time?
  • 7.
    Project Network A project network can be constructed to model the precedence of the activities. The nodes of the network represent the activities. The arcs of the network reflect the precedence relationships of the activities. A critical path for the network is a path consisting of activities with zero slack.
  • 8.
    Example: Frank’sFine Floats Frank’s Fine Floats is in the business of building elaborate parade floats. Frank and his crew have a new float to build and want to use PERT/CPM to help them manage the project . The table on the next slide shows the activities that comprise the project. Each activity’s estimated completion time (in days) and immediate predecessors are listed as well. Frank wants to know the total time to complete the project, which activities are critical, and the earliest and latest start and finish dates for each activity.
  • 9.
    Example: Frank’sFine Floats Immediate Completion Activity Description Predecessors Time (days) A Initial Paperwork --- 3 B Build Body A 3 C Build Frame A 2 D Finish Body B 3 E Finish Frame C 7 F Final Paperwork B,C 3 G Mount Body to Frame D,E 6 H Install Skirt on Frame C 2
  • 10.
    Example: Frank’sFine Floats Project Network Start Finish B 3 D 3 A 3 C 2 G 6 F 3 H 2 E 7
  • 11.
    Earliest Start andFinish Times Step 1: Make a forward pass through the network as follows: For each activity i beginning at the Start node , compute: Earliest Start Time = the maximum of the earliest finish times of all activities immediately preceding activity i . (This is 0 for an activity with no predecessors.) Earliest Finish Time = (Earliest Start Time) + (Time to complete activity i ). The project completion time is the maximum of the Earliest Finish Times at the Finish node.
  • 12.
    Example: Frank’sFine Floats Earliest Start and Finish Times Start Finish 3 6 B 3 6 9 D 3 0 3 A 3 3 5 C 2 12 18 G 6 6 9 F 3 5 7 H 2 5 12 E 7
  • 13.
    Latest Start andFinish Times Step 2: Make a backwards pass through the network as follows: Move sequentially backwards from the Finish node to the Start node. At a given node, j , consider all activities ending at node j . For each of these activities, i , compute: Latest Finish Time = the minimum of the latest start times beginning at node j . (For node N , this is the project completion time.) Latest Start Time = (Latest Finish Time) - (Time to complete activity i ).
  • 14.
    Example: Frank’sFine Floats Latest Start and Finish Times Start Finish 3 6 6 9 B 3 6 9 9 12 D 3 0 3 0 3 A 3 3 5 3 5 C 2 12 18 12 18 G 6 6 9 15 18 F 3 5 7 16 18 H 2 5 12 5 12 E 7
  • 15.
    Determining the CriticalPath Step 3: Calculate the slack time for each activity by: Slack = (Latest Start) - (Earliest Start), or = (Latest Finish) - (Earliest Finish).
  • 16.
    Example: Frank’sFine Floats Activity Slack Time Activity ES EF LS LF Slack A 0 3 0 3 0 (crit.) B 3 6 6 9 3 C 3 5 3 5 0 (crit.) D 6 9 9 12 3 E 5 12 5 12 0 (crit.) F 6 9 15 18 9 G 12 18 12 18 0 (crit.) H 5 7 16 18 11
  • 17.
    Determining the CriticalPath A critical path is a path of activities, from the Start node to the Finish node, with 0 slack times. Critical Path: A – C – E – G The project completion time equals the maximum of the activities’ earliest finish times. Project Completion Time: 18 days Example: Frank’s Fine Floats
  • 18.
    Example: Frank’sFine Floats Critical Path Start Finish 3 6 6 9 B 3 6 9 9 12 D 3 0 3 0 3 A 3 3 5 3 5 C 2 12 18 12 18 G 6 6 9 15 18 F 3 5 7 16 18 H 2 5 12 5 12 E 7
  • 19.
    In the three-time estimate approach , the time to complete an activity is assumed to follow a Beta distribution. An activity’s mean completion time is: t = ( a + 4 m + b )/6 An activity’s completion time variance is:  2 = (( b - a )/6) 2 a = the optimistic completion time estimate b = the pessimistic completion time estimate m = the most likely completion time estimate Uncertain Activity Times
  • 20.
    Uncertain Activity TimesIn the three-time estimate approach, the critical path is determined as if the mean times for the activities were fixed times. The overall project completion time is assumed to have a normal distribution with mean equal to the sum of the means along the critical path and variance equal to the sum of the variances along the critical path.
  • 21.
    Example: ABCAssociates Consider the following project: Immed. Optimistic Most Likely Pessimistic Activity Predec. Time (Hr. ) Time (Hr.) Time (Hr.) A -- 4 6 8 B -- 1 4.5 5 C A 3 3 3 D A 4 5 6 E A 0.5 1 1.5 F B,C 3 4 5 G B,C 1 1.5 5 H E,F 5 6 7 I E,F 2 5 8 J D,H 2.5 2.75 4.5 K G,I 3 5 7
  • 22.
    Example: ABCAssociates Project Network 6 4 3 5 5 2 4 1 6 3 5
  • 23.
    Example: ABCAssociates Activity Expected Times and Variances t = ( a + 4 m + b )/6  2 = (( b - a )/6) 2 Activity Expected Time Variance A 6 4/9 B 4 4/9 C 3 0 D 5 1/9 E 1 1/36 F 4 1/9 G 2 4/9 H 6 1/9 I 5 1 J 3 1/9 K 5 4/9
  • 24.
    Example: ABCAssociates Earliest/Latest Times and Slack Activity ES EF LS LF Slack A 0 6 0 6 0 * B 0 4 5 9 5 C 6 9 6 9 0 * D 6 11 15 20 9 E 6 7 12 13 6 F 9 13 9 13 0 * G 9 11 16 18 7 H 13 19 14 20 1 I 13 18 13 18 0 * J 19 22 20 23 1 K 18 23 18 23 0 *
  • 25.
    Determining the CriticalPath A critical path is a path of activities, from the Start node to the Finish node, with 0 slack times. Critical Path: A – C – F – I – K The project completion time equals the maximum of the activities’ earliest finish times. Project Completion Time: 23 hours Example: ABC Associates
  • 26.
    Example: ABCAssociates Critical Path (A-C-F-I-K) 0 6 0 6 9 13 9 13 13 18 13 18 9 11 16 18 13 19 14 20 19 22 20 23 18 23 18 23 6 7 12 13 6 9 6 9 0 4 5 9 6 11 15 20 6 4 3 5 5 2 4 1 6 3 5
  • 27.
    Example: ABCAssociates Probability the project will be completed within 24 hrs  2 =  2 A +  2 C +  2 F +  2 H +  2 K = 4/9 + 0 + 1/9 + 1 + 4/9 = 2  = 1.414 z = (24 - 23)/  (24-23)/1.414 = .71 From the Standard Normal Distribution table: P(z < .71) = .5 + .2612 = .7612