Download to read offline
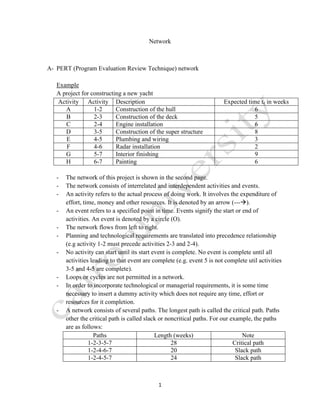


The document describes a project network for constructing a yacht. It includes 8 activities with expected times. The critical path through the network is activities 1-2, 2-3, 3-5, and 5-7, with an expected time of 28 weeks and standard deviation of 1.86 weeks. There is a 50% probability of completing the project in 28 weeks or less.


![Eric Schulken-Portfolio [11-8-16]](https://cdn.slidesharecdn.com/ss_thumbnails/eschulkenportfolio5-11-16-160512212543-thumbnail.jpg?width=640&height=640&fit=bounds)


