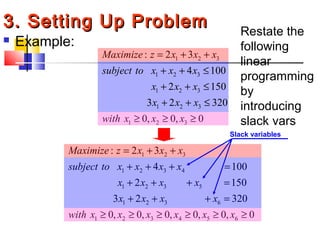
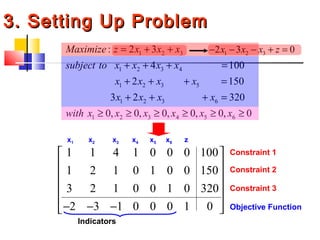
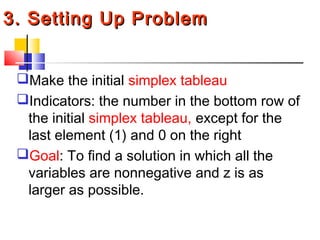
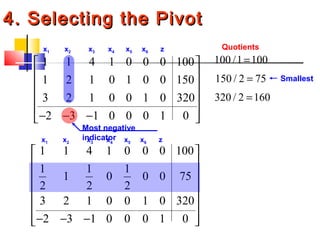
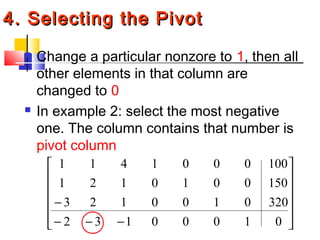
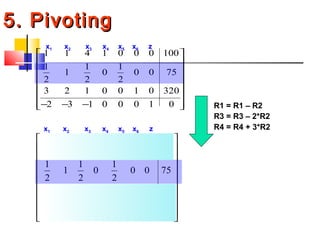
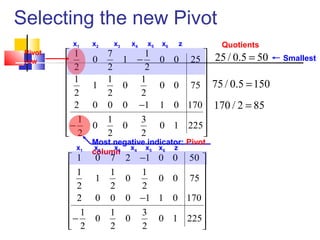
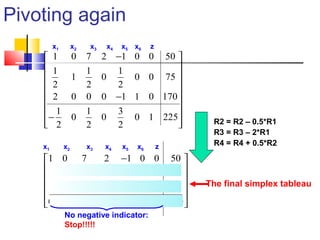
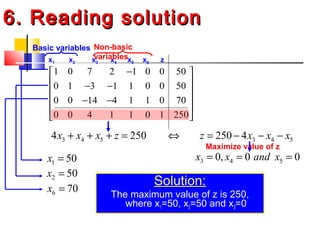
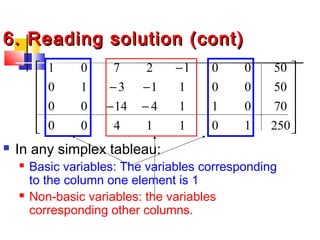
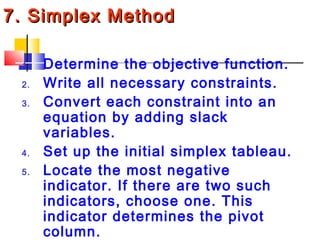
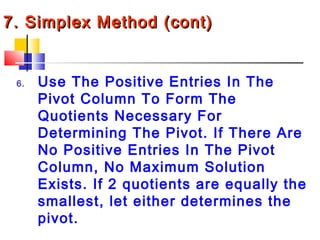
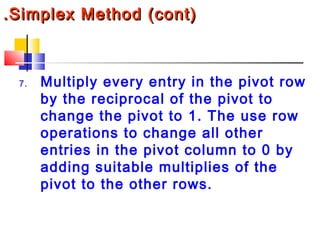
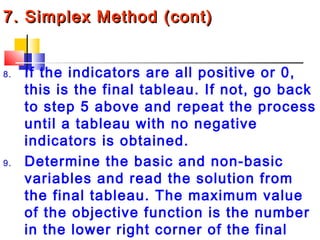
SIMPLEX
METHOD
SIMPLEX METHOD
 1. INTRODUCTION
 The graphical method is
usually inefficient or
impossible
  The Simplex method used.
 All constrains must be
expressed in the linear form:
SIMPLEX METHOD
2. Standard Maximum Form
The objective function is to be
maximized
All variables are nonnegative
(xi ≥ 0,i = 1, 2, 3 …)
All constraints involve ≤
The constants on the right side in the
constraints are all nonnegative (b ≥ 0)
SIMPLEX METHOD
3. Setting Up Problem3. Setting Up Problem
Convert x1+x2 10 in to
x1+x2+x3=10
x3 : slack variable
1 2 3
1 2 3
1 2 3
1 2 3
1 2 3
: 2 3
4 100
2 150
3 2 320
0, 0, 0
Maximize z x x x
subject to x x x
x x x
x x x
with x x x
= + +
+ + ≤
+ + ≤
+ + ≤
≥ ≥ ≥
 Example:
1 2 3
1 2 3 4
1 2 3 5
1 2 3 6
1 2 3 4 5 6
: 2 3
4 100
2 150
3 2 320
0, 0, 0, 0, 0, 0
Maximize z x x x
subject to x x x x
x x x x
x x x x
with x x x x x x
= + +
+ + + =
+ + + =
+ + + =
≥ ≥ ≥ ≥ ≥ ≥
Slack variables
3. Setting Up Problem3. Setting Up Problem Restate the
following
linear
programming
by
introducing
slack vars
1 2 3
1 2 3 4
1 2 3 5
1 2 3 6
1 2 3 4 5 6
: 2 3
4 100
2 150
3 2 320
0, 0, 0, 0, 0, 0
Maximize z x x x
subject to x x x x
x x x x
x x x x
with x x x x x x
= + +
+ + + =
+ + + =
+ + + =
≥ ≥ ≥ ≥ ≥ ≥
1 1 4 1 0 0 0 100
1 2 1 0 1 0 0 150
3 2 1 0 0 1 0 320
2 3 1 0 0 0 1 0
 
 
 
 
 
− − − 
x1 x2 x3 x4 x5 x6 z
Constraint 1
Constraint 2
Constraint 3
Objective Function
Indicators
1 2 32 3 0x x x z− − − + =
3. Setting Up Problem3. Setting Up Problem
Make the initial simplex tableau
Indicators: the number in the bottom row of
the initial simplex tableau, except for the
last element (1) and 0 on the right
Goal: To find a solution in which all the
variables are nonnegative and z is as
larger as possible.
Quotients
1 1 4 1 0 0 0 100
1 2 1 0 1 0 0 150
3 2 1 0 0 1 0 320
2 3 1 0 0 0 1 0
 
 
 
 
 
− − − 
x1 x2 x3 x4 x5 x6 z
Most negative
indicator
100 /1 100=
150 / 2 75=
320 / 2 160=
Smallest
1 1 4 1 0 0 0 100
1 1 1
1 0 0 0 75
2 2 2
3 2 1 0 0 1 0 320
2 3 1 0 0 0 1 0
 
 
 
 
 
 
− − −  
x1 x2 x3 x4 x5 x6 z
4. Selecting the Pivot4. Selecting the Pivot
 Change a particular nonzore to 1, then all
other elements in that column are
changed to 0
 In example 2: select the most negative
one. The column contains that number is
pivot column












−−−
−
01000132
3200100123
1500010121
1000001411
5. Pivoting5. Pivoting
1 1 4 1 0 0 0 100
1 1 1
1 0 0 0 75
2 2 2
3 2 1 0 0 1 0 320
2 3 1 0 0 0 1 0
 
 
 
 
 
 
− − −  
x1 x2 x3 x4 x5 x6 z
1 7 1
0 1 0 0 25
2 2 2
1 1 1
1 0 0 0 75
2 2 2
2 0 0 0 1 1 0 170
1 1 3
0 0 0 1 225
2 2 2
 
− 
 
 
 
 − 
 
− 
 
x1 x2 x3 x4 x5 x6 z
R1 = R1 – R2
R3 = R3 – 2*R2
R4 = R4 + 3*R2
Selecting the new Pivot
1 7 1
0 1 0 0 25
2 2 2
1 1 1
1 0 0 0 75
2 2 2
2 0 0 0 1 1 0 170
1 1 3
0 0 0 1 225
2 2 2
 
− 
 
 
 
 − 
 
− 
 
x1 x2 x3 x4 x5 x6 z
Most negative indicator: Pivot
column
Quotients
25 / 0.5 50=
75 / 0.5 150=
170 / 2 85=
Smallest
Pivot
row
1 0 7 2 1 0 0 50
1 1 1
1 0 0 0 75
2 2 2
2 0 0 0 1 1 0 170
1 1 3
0 0 0 1 225
2 2 2
− 
 
 
 
 −
 
 −  
x1 x2 x3 x4 x5 x6 z
Pivoting again
1 0 7 2 1 0 0 50
1 1 1
1 0 0 0 75
2 2 2
2 0 0 0 1 1 0 170
1 1 3
0 0 0 1 225
2 2 2
− 
 
 
 
 −
 
 −  
x1 x2 x3 x4 x5 x6 z
1 0 7 2 1 0 0 50
0 1 3 1 1 0 0 50
0 0 14 4 1 1 0 70
0 0 4 1 1 0 1 250
− 
 − − 
 − −
 
 
x1 x2 x3 x4 x5 x6 z
R2 = R2 – 0.5*R1
R3 = R3 – 2*R1
R4 = R4 + 0.5*R2
No negative indicator:
Stop!!!!!
The final simplex tableau
6. Reading solution6. Reading solution
Solution:
The maximum value of z is 250,
where x1=50, x2=50 and x3=0
1 0 7 2 1 0 0 50
0 1 3 1 1 0 0 50
0 0 14 4 1 1 0 70
0 0 4 1 1 0 1 250
− 
 − − 
 − −
 
 
x1 x2 x3 x4 x5 x6 z
3 4 54 250x x x z+ + + = 3 4 5250 4z x x x⇔ = − − −
3 4 50, 0 0x x and x= = =
Maximize value of z
1 50x =
2 50x =
6 70x =
Basic variables Non-basic
variables
6. Reading solution (cont)6. Reading solution (cont)
 In any simplex tableau:
 Basic variables: The variables corresponding
to the column one element is 1
 Non-basic variables: the variables
corresponding other columns.












−−
−−
−
2501011400
7001141400
500011310
500012701
7. Simplex Method7. Simplex Method
1. Determine the objective function.
2. Write all necessary constraints.
3. Convert each constraint into an
equation by adding slack
variables.
4. Set up the initial simplex tableau.
5. Locate the most negative
indicator. If there are two such
indicators, choose one. This
indicator determines the pivot
column.
7. Simplex Method (cont)7. Simplex Method (cont)
6. Use The Positive Entries In The
Pivot Column To Form The
Quotients Necessary For
Determining The Pivot. If There Are
No Positive Entries In The Pivot
Column, No Maximum Solution
Exists. If 2 quotients are equally the
smallest, let either determines the
pivot.
.Simplex Method (cont).Simplex Method (cont)
7. Multiply every entry in the pivot row
by the reciprocal of the pivot to
change the pivot to 1. The use row
operations to change all other
entries in the pivot column to 0 by
adding suitable multiplies of the
pivot to the other rows.
7. Simplex Method (cont)7. Simplex Method (cont)
8. If the indicators are all positive or 0,
this is the final tableau. If not, go back
to step 5 above and repeat the process
until a tableau with no negative
indicators is obtained.
9. Determine the basic and non-basic
variables and read the solution from
the final tableau. The maximum value
of the objective function is the number
in the lower right corner of the final

Simplex Method

  • 1.
  • 2.
    SIMPLEX METHOD  1.INTRODUCTION  The graphical method is usually inefficient or impossible   The Simplex method used.  All constrains must be expressed in the linear form:
  • 3.
    SIMPLEX METHOD 2. StandardMaximum Form The objective function is to be maximized All variables are nonnegative (xi ≥ 0,i = 1, 2, 3 …) All constraints involve ≤ The constants on the right side in the constraints are all nonnegative (b ≥ 0)
  • 4.
    SIMPLEX METHOD 3. SettingUp Problem3. Setting Up Problem Convert x1+x2 10 in to x1+x2+x3=10 x3 : slack variable
  • 5.
    1 2 3 12 3 1 2 3 1 2 3 1 2 3 : 2 3 4 100 2 150 3 2 320 0, 0, 0 Maximize z x x x subject to x x x x x x x x x with x x x = + + + + ≤ + + ≤ + + ≤ ≥ ≥ ≥  Example: 1 2 3 1 2 3 4 1 2 3 5 1 2 3 6 1 2 3 4 5 6 : 2 3 4 100 2 150 3 2 320 0, 0, 0, 0, 0, 0 Maximize z x x x subject to x x x x x x x x x x x x with x x x x x x = + + + + + = + + + = + + + = ≥ ≥ ≥ ≥ ≥ ≥ Slack variables 3. Setting Up Problem3. Setting Up Problem Restate the following linear programming by introducing slack vars
  • 6.
    1 2 3 12 3 4 1 2 3 5 1 2 3 6 1 2 3 4 5 6 : 2 3 4 100 2 150 3 2 320 0, 0, 0, 0, 0, 0 Maximize z x x x subject to x x x x x x x x x x x x with x x x x x x = + + + + + = + + + = + + + = ≥ ≥ ≥ ≥ ≥ ≥ 1 1 4 1 0 0 0 100 1 2 1 0 1 0 0 150 3 2 1 0 0 1 0 320 2 3 1 0 0 0 1 0           − − −  x1 x2 x3 x4 x5 x6 z Constraint 1 Constraint 2 Constraint 3 Objective Function Indicators 1 2 32 3 0x x x z− − − + = 3. Setting Up Problem3. Setting Up Problem
  • 7.
    3. Setting UpProblem3. Setting Up Problem Make the initial simplex tableau Indicators: the number in the bottom row of the initial simplex tableau, except for the last element (1) and 0 on the right Goal: To find a solution in which all the variables are nonnegative and z is as larger as possible.
  • 8.
    Quotients 1 1 41 0 0 0 100 1 2 1 0 1 0 0 150 3 2 1 0 0 1 0 320 2 3 1 0 0 0 1 0           − − −  x1 x2 x3 x4 x5 x6 z Most negative indicator 100 /1 100= 150 / 2 75= 320 / 2 160= Smallest 1 1 4 1 0 0 0 100 1 1 1 1 0 0 0 75 2 2 2 3 2 1 0 0 1 0 320 2 3 1 0 0 0 1 0             − − −   x1 x2 x3 x4 x5 x6 z 4. Selecting the Pivot4. Selecting the Pivot
  • 9.
    4. Selecting thePivot4. Selecting the Pivot  Change a particular nonzore to 1, then all other elements in that column are changed to 0  In example 2: select the most negative one. The column contains that number is pivot column             −−− − 01000132 3200100123 1500010121 1000001411
  • 10.
    5. Pivoting5. Pivoting 11 4 1 0 0 0 100 1 1 1 1 0 0 0 75 2 2 2 3 2 1 0 0 1 0 320 2 3 1 0 0 0 1 0             − − −   x1 x2 x3 x4 x5 x6 z 1 7 1 0 1 0 0 25 2 2 2 1 1 1 1 0 0 0 75 2 2 2 2 0 0 0 1 1 0 170 1 1 3 0 0 0 1 225 2 2 2   −         −    −    x1 x2 x3 x4 x5 x6 z R1 = R1 – R2 R3 = R3 – 2*R2 R4 = R4 + 3*R2
  • 11.
    Selecting the newPivot 1 7 1 0 1 0 0 25 2 2 2 1 1 1 1 0 0 0 75 2 2 2 2 0 0 0 1 1 0 170 1 1 3 0 0 0 1 225 2 2 2   −         −    −    x1 x2 x3 x4 x5 x6 z Most negative indicator: Pivot column Quotients 25 / 0.5 50= 75 / 0.5 150= 170 / 2 85= Smallest Pivot row 1 0 7 2 1 0 0 50 1 1 1 1 0 0 0 75 2 2 2 2 0 0 0 1 1 0 170 1 1 3 0 0 0 1 225 2 2 2 −         −    −   x1 x2 x3 x4 x5 x6 z
  • 12.
    Pivoting again 1 07 2 1 0 0 50 1 1 1 1 0 0 0 75 2 2 2 2 0 0 0 1 1 0 170 1 1 3 0 0 0 1 225 2 2 2 −         −    −   x1 x2 x3 x4 x5 x6 z 1 0 7 2 1 0 0 50 0 1 3 1 1 0 0 50 0 0 14 4 1 1 0 70 0 0 4 1 1 0 1 250 −   − −   − −     x1 x2 x3 x4 x5 x6 z R2 = R2 – 0.5*R1 R3 = R3 – 2*R1 R4 = R4 + 0.5*R2 No negative indicator: Stop!!!!! The final simplex tableau
  • 13.
    6. Reading solution6.Reading solution Solution: The maximum value of z is 250, where x1=50, x2=50 and x3=0 1 0 7 2 1 0 0 50 0 1 3 1 1 0 0 50 0 0 14 4 1 1 0 70 0 0 4 1 1 0 1 250 −   − −   − −     x1 x2 x3 x4 x5 x6 z 3 4 54 250x x x z+ + + = 3 4 5250 4z x x x⇔ = − − − 3 4 50, 0 0x x and x= = = Maximize value of z 1 50x = 2 50x = 6 70x = Basic variables Non-basic variables
  • 14.
    6. Reading solution(cont)6. Reading solution (cont)  In any simplex tableau:  Basic variables: The variables corresponding to the column one element is 1  Non-basic variables: the variables corresponding other columns.             −− −− − 2501011400 7001141400 500011310 500012701
  • 15.
    7. Simplex Method7.Simplex Method 1. Determine the objective function. 2. Write all necessary constraints. 3. Convert each constraint into an equation by adding slack variables. 4. Set up the initial simplex tableau. 5. Locate the most negative indicator. If there are two such indicators, choose one. This indicator determines the pivot column.
  • 16.
    7. Simplex Method(cont)7. Simplex Method (cont) 6. Use The Positive Entries In The Pivot Column To Form The Quotients Necessary For Determining The Pivot. If There Are No Positive Entries In The Pivot Column, No Maximum Solution Exists. If 2 quotients are equally the smallest, let either determines the pivot.
  • 17.
    .Simplex Method (cont).SimplexMethod (cont) 7. Multiply every entry in the pivot row by the reciprocal of the pivot to change the pivot to 1. The use row operations to change all other entries in the pivot column to 0 by adding suitable multiplies of the pivot to the other rows.
  • 18.
    7. Simplex Method(cont)7. Simplex Method (cont) 8. If the indicators are all positive or 0, this is the final tableau. If not, go back to step 5 above and repeat the process until a tableau with no negative indicators is obtained. 9. Determine the basic and non-basic variables and read the solution from the final tableau. The maximum value of the objective function is the number in the lower right corner of the final