The document discusses project scheduling techniques like the Critical Path Method (CPM) and Program Evaluation and Review Technique (PERT). It explains how a network diagram shows the logical dependencies and sequence of tasks in a project. Calculating earliest and latest start/finish times helps identify the critical path and float for activities. PERT is useful for projects with uncertain durations, using 3 time estimates. The critical path determines the minimum project duration, and monitoring it helps complete the project on schedule.
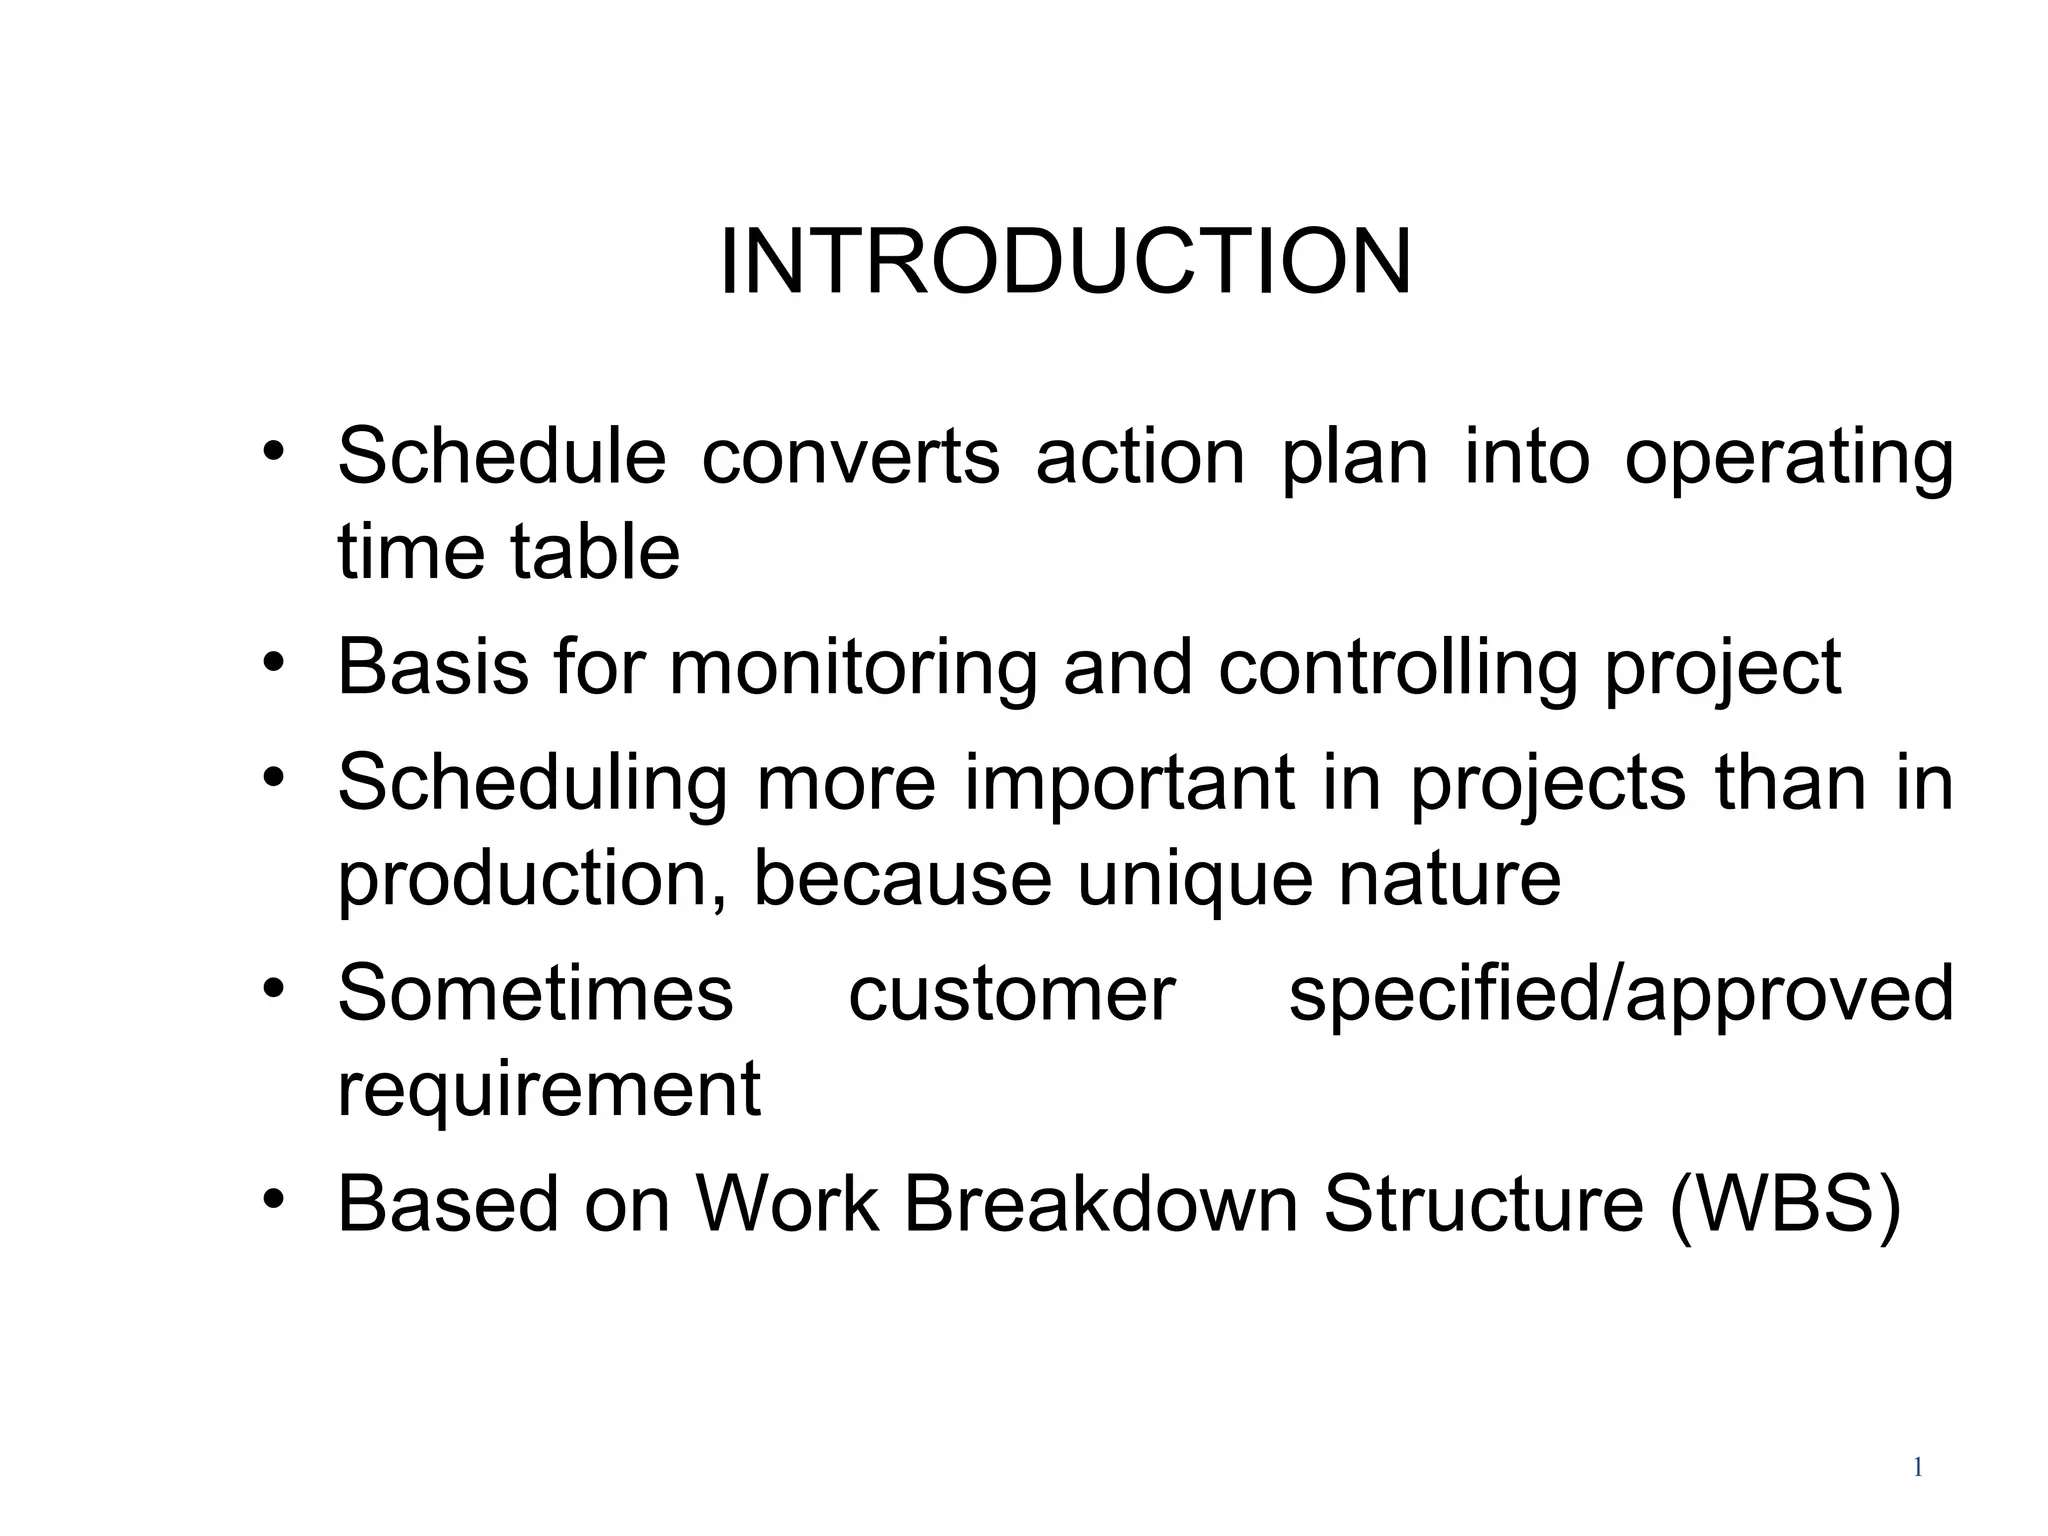
INTRODUCTION
• Schedule convertsaction plan into operating
time table
• Basis for monitoring and controlling project
• Scheduling more important in projects than in
production, because unique nature
• Sometimes customer specified/approved
requirement
• Based on Work Breakdown Structure (WBS)
1
2.
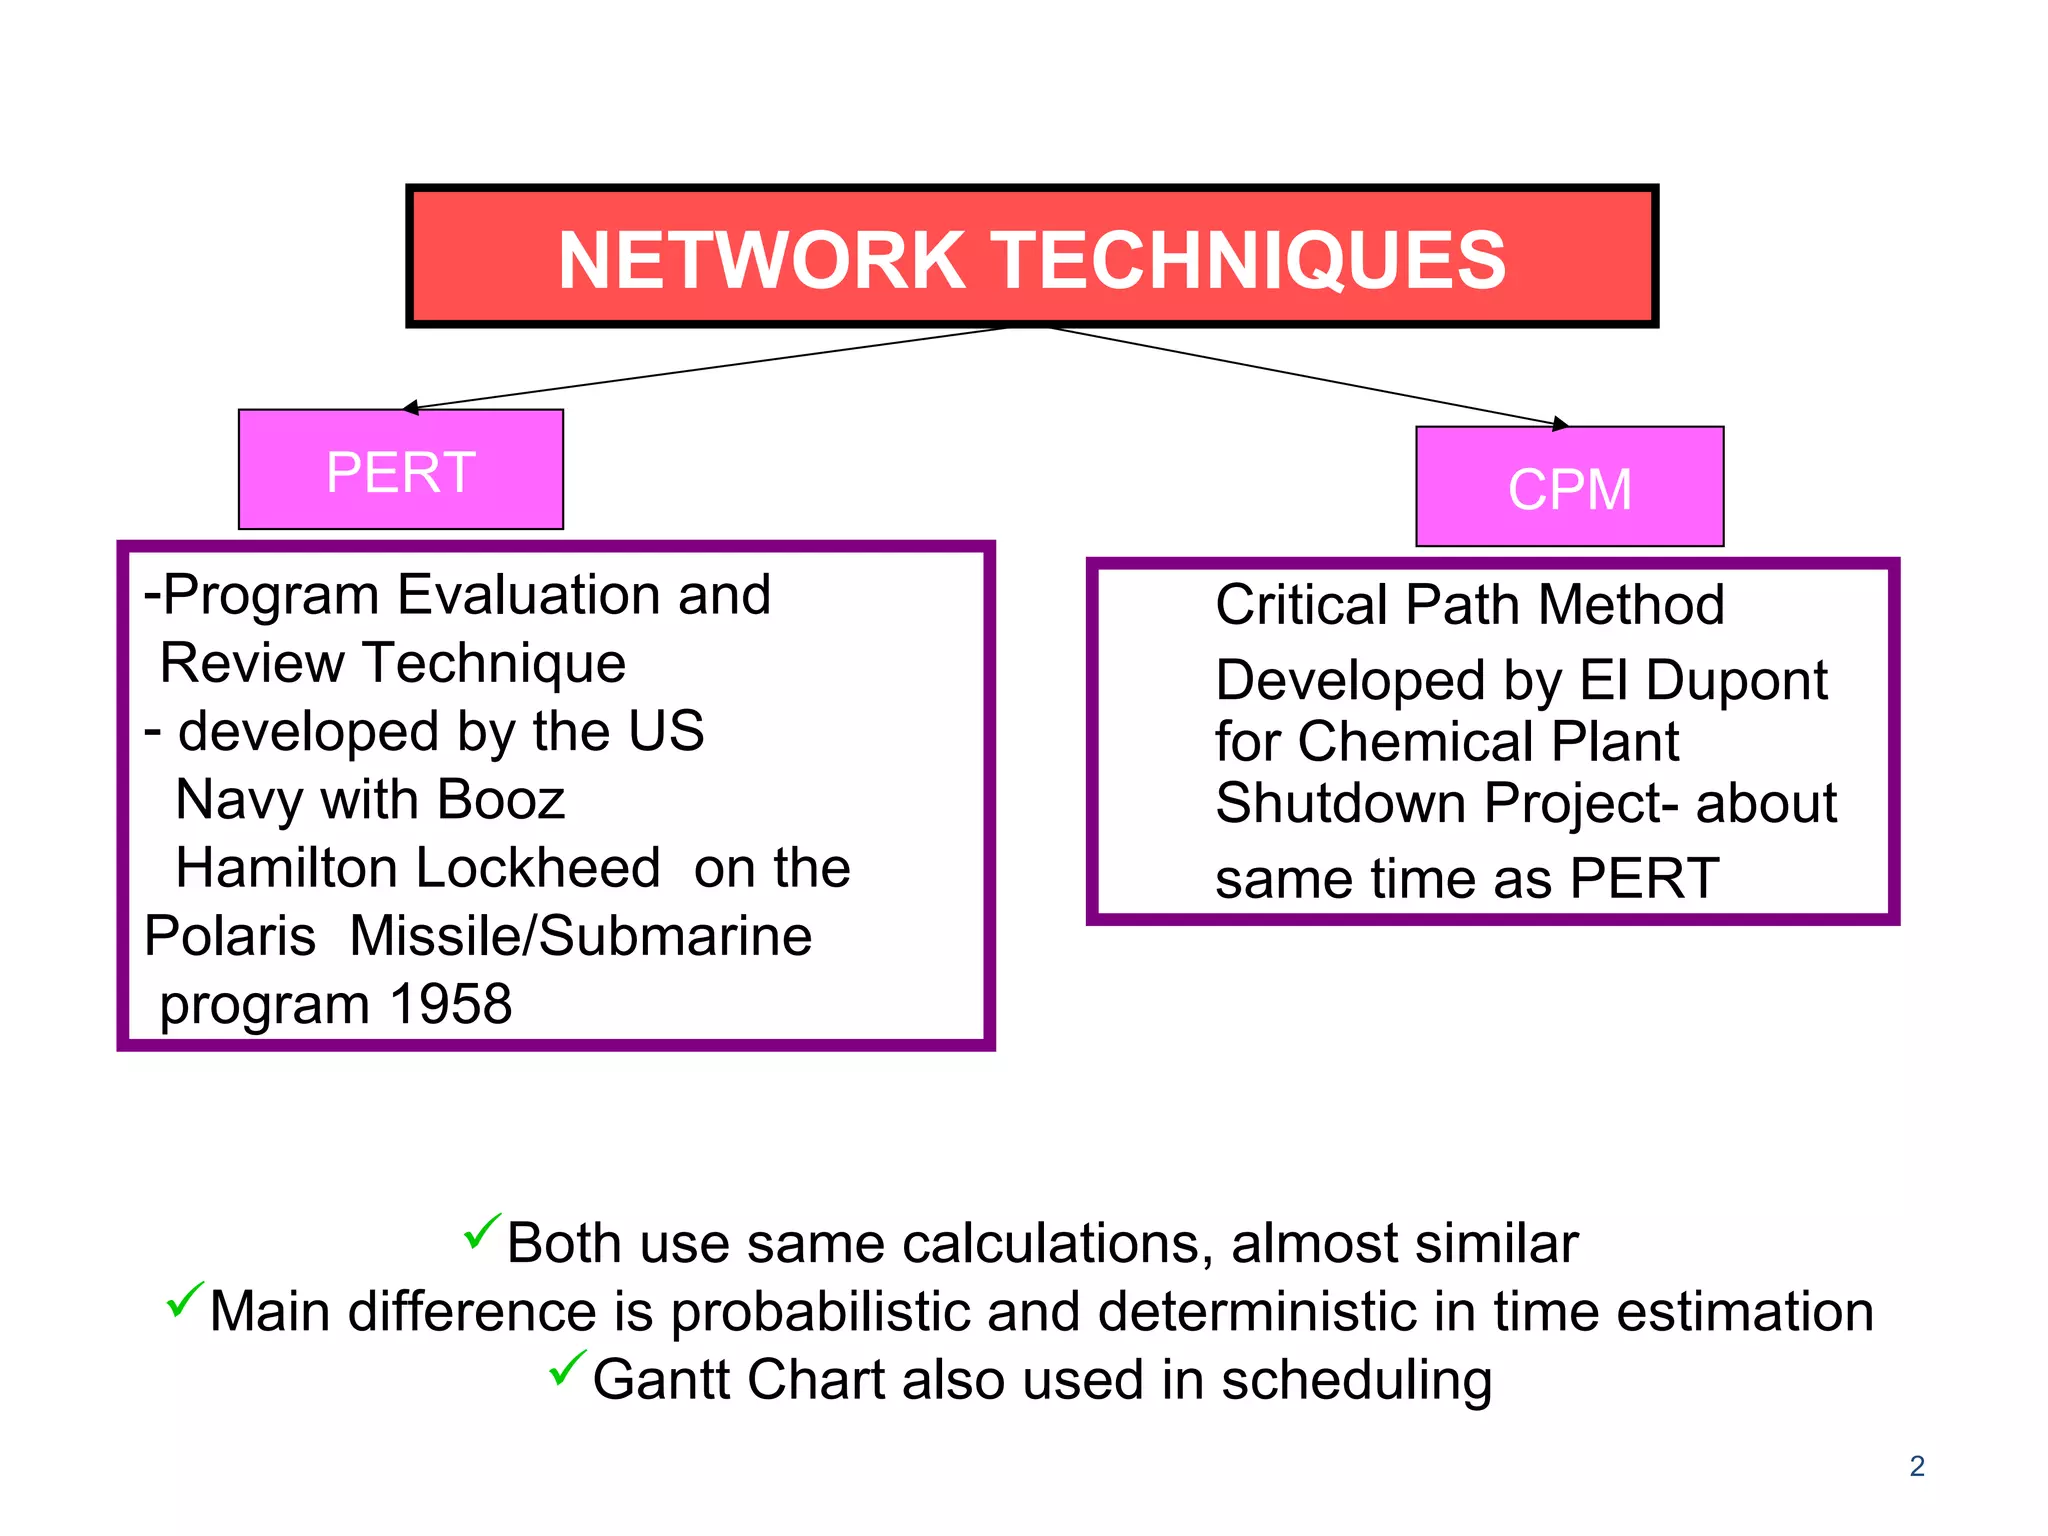
NETWORK TECHNIQUES
2
PERT CPM
-ProgramEvaluation and
Review Technique
- developed by the US
Navy with Booz
Hamilton Lockheed on the
Polaris Missile/Submarine
program 1958
Critical Path Method
Developed by El Dupont
for Chemical Plant
Shutdown Project- about
same time as PERT
Both use same calculations, almost similar
Main difference is probabilistic and deterministic in time estimation
Gantt Chart also used in scheduling
3.
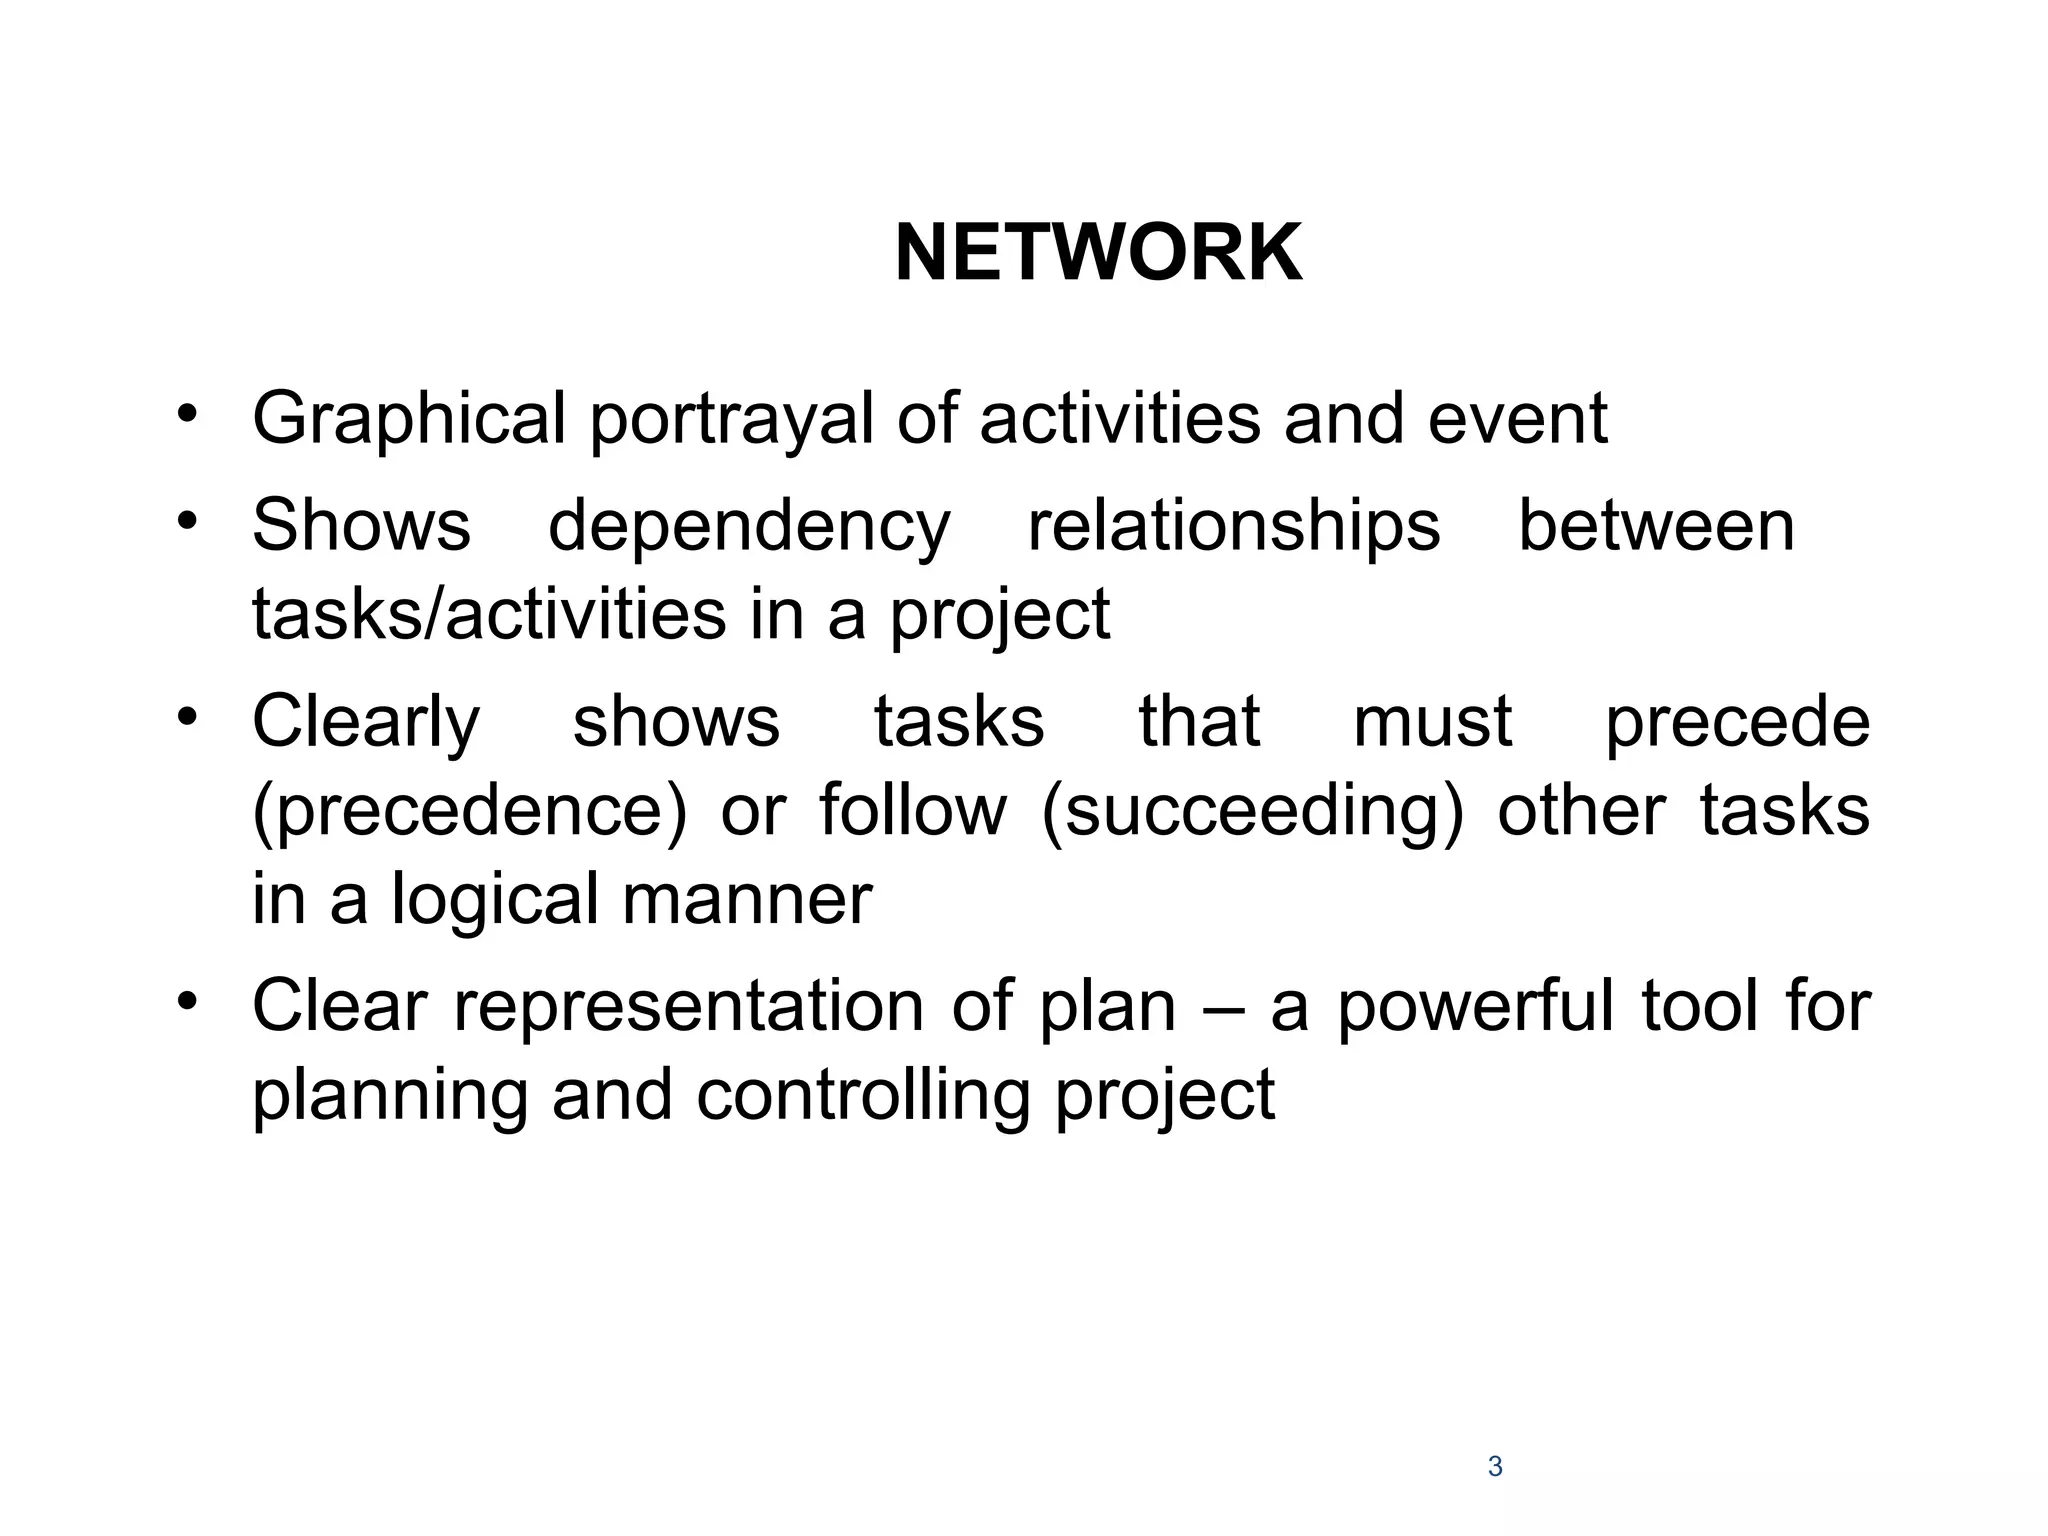
NETWORK
• Graphical portrayalof activities and event
• Shows dependency relationships between
tasks/activities in a project
• Clearly shows tasks that must precede
(precedence) or follow (succeeding) other tasks
in a logical manner
• Clear representation of plan – a powerful tool for
planning and controlling project
3
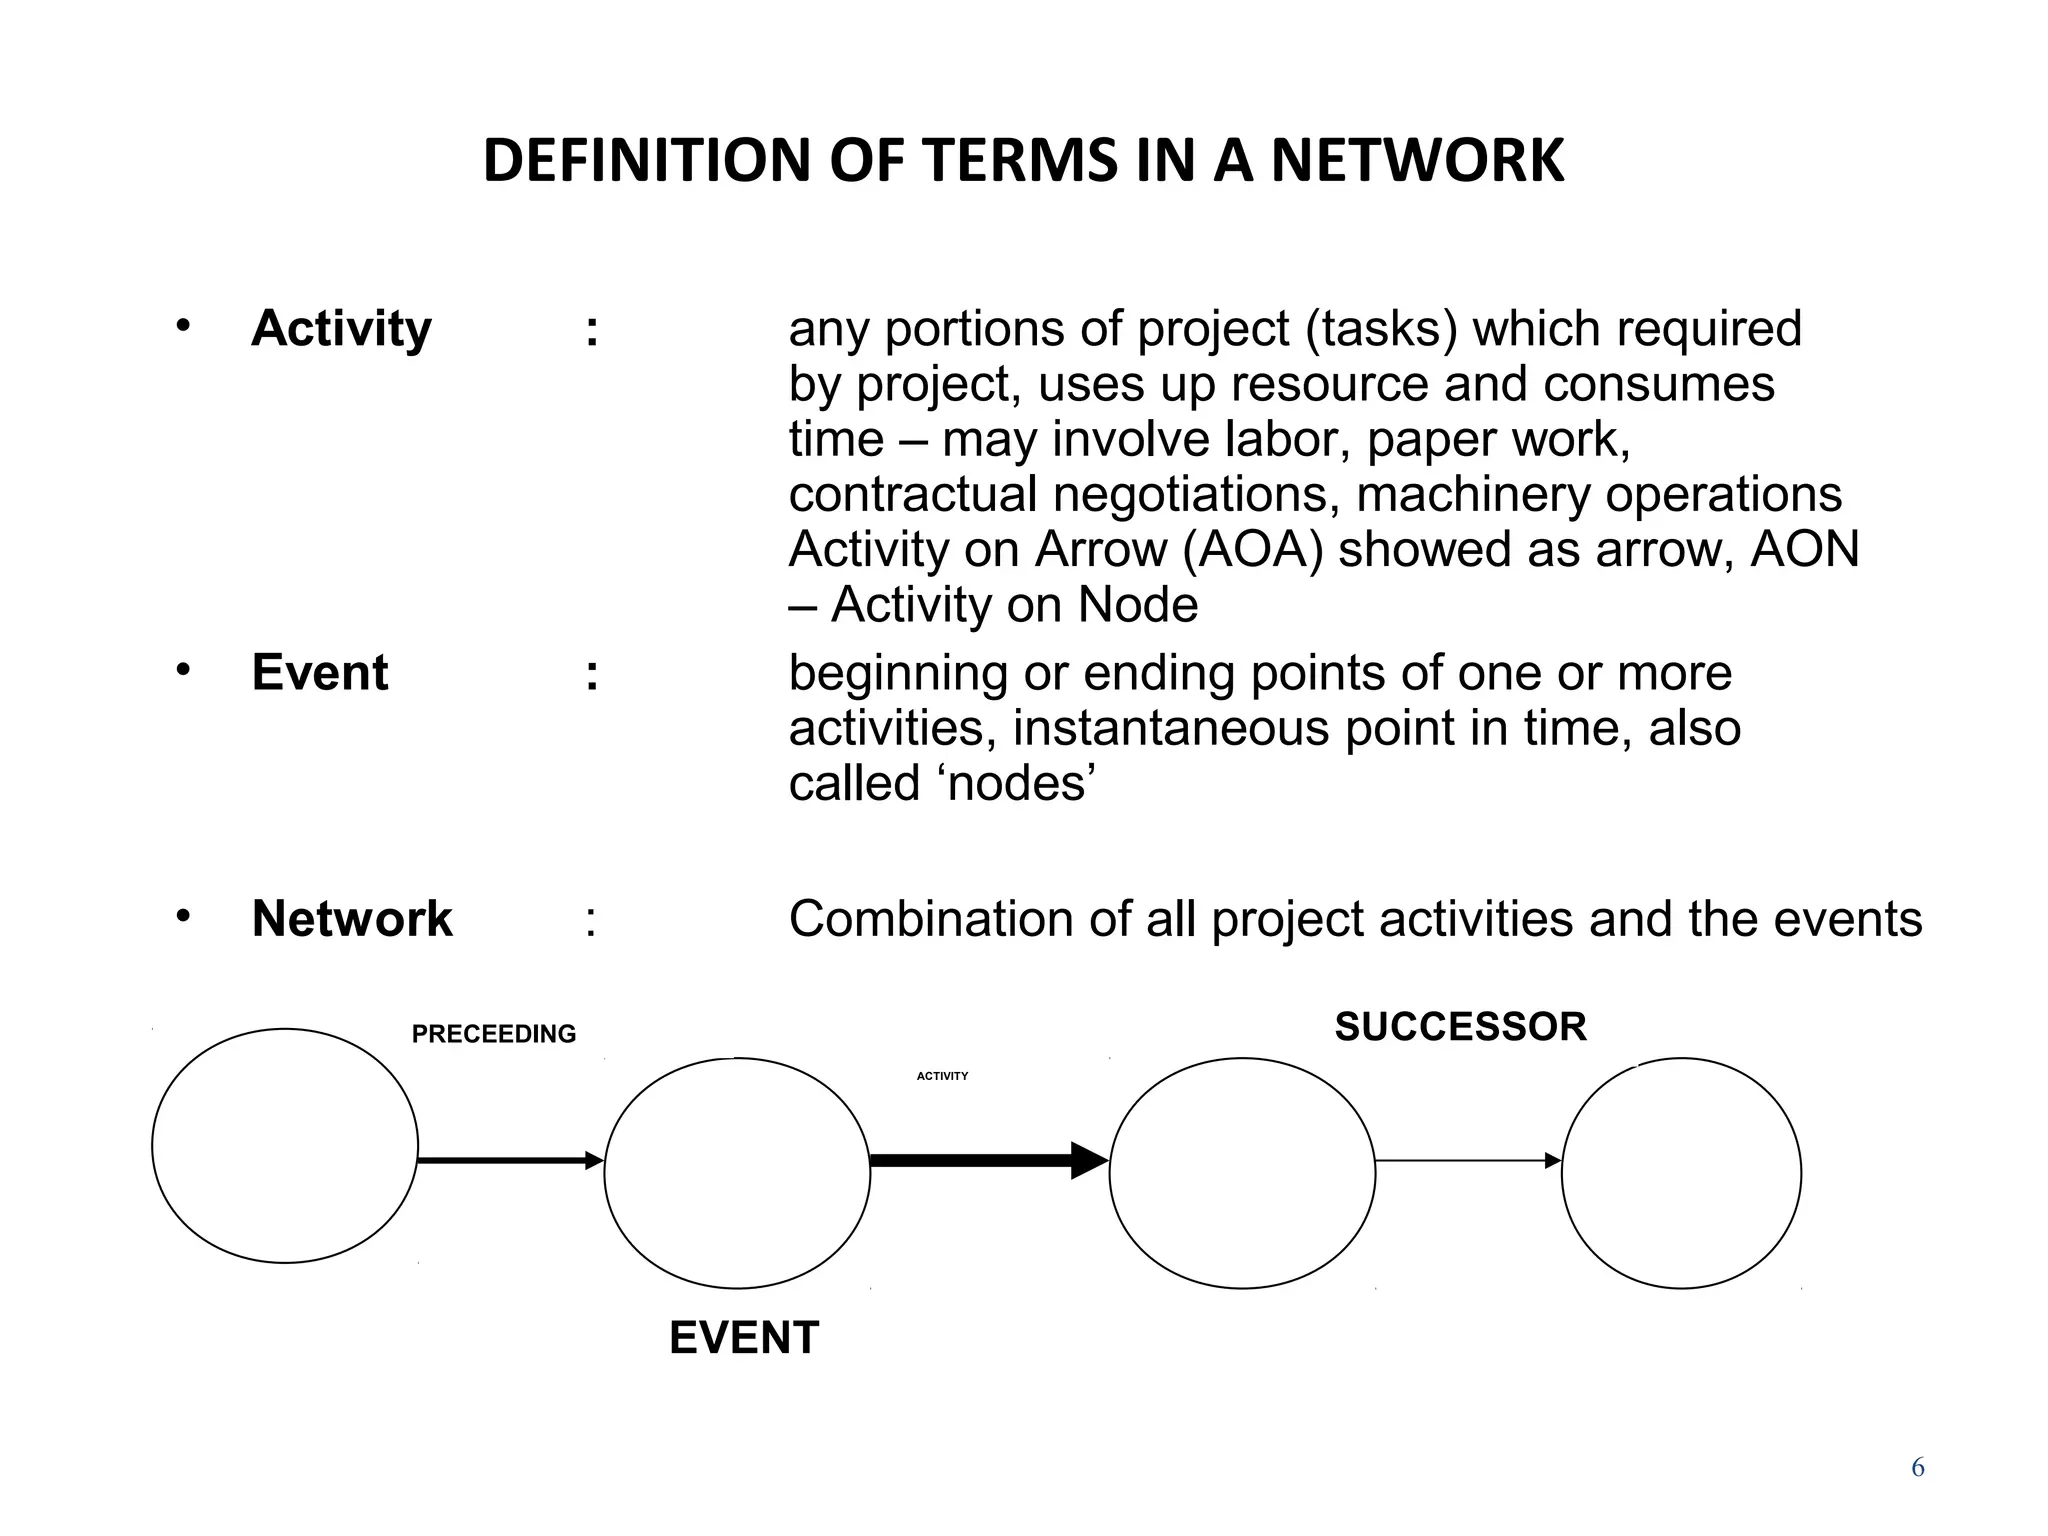
DEFINITION OF TERMSIN A NETWORK
• Activity : any portions of project (tasks) which required
by project, uses up resource and consumes
time – may involve labor, paper work,
contractual negotiations, machinery operations
Activity on Arrow (AOA) showed as arrow, AON
– Activity on Node
• Event : beginning or ending points of one or more
activities, instantaneous point in time, also
called ‘nodes’
• Network : Combination of all project activities and the events
6
ACTIVITY
PRECEEDING SUCCESSOR
EVENT
7.
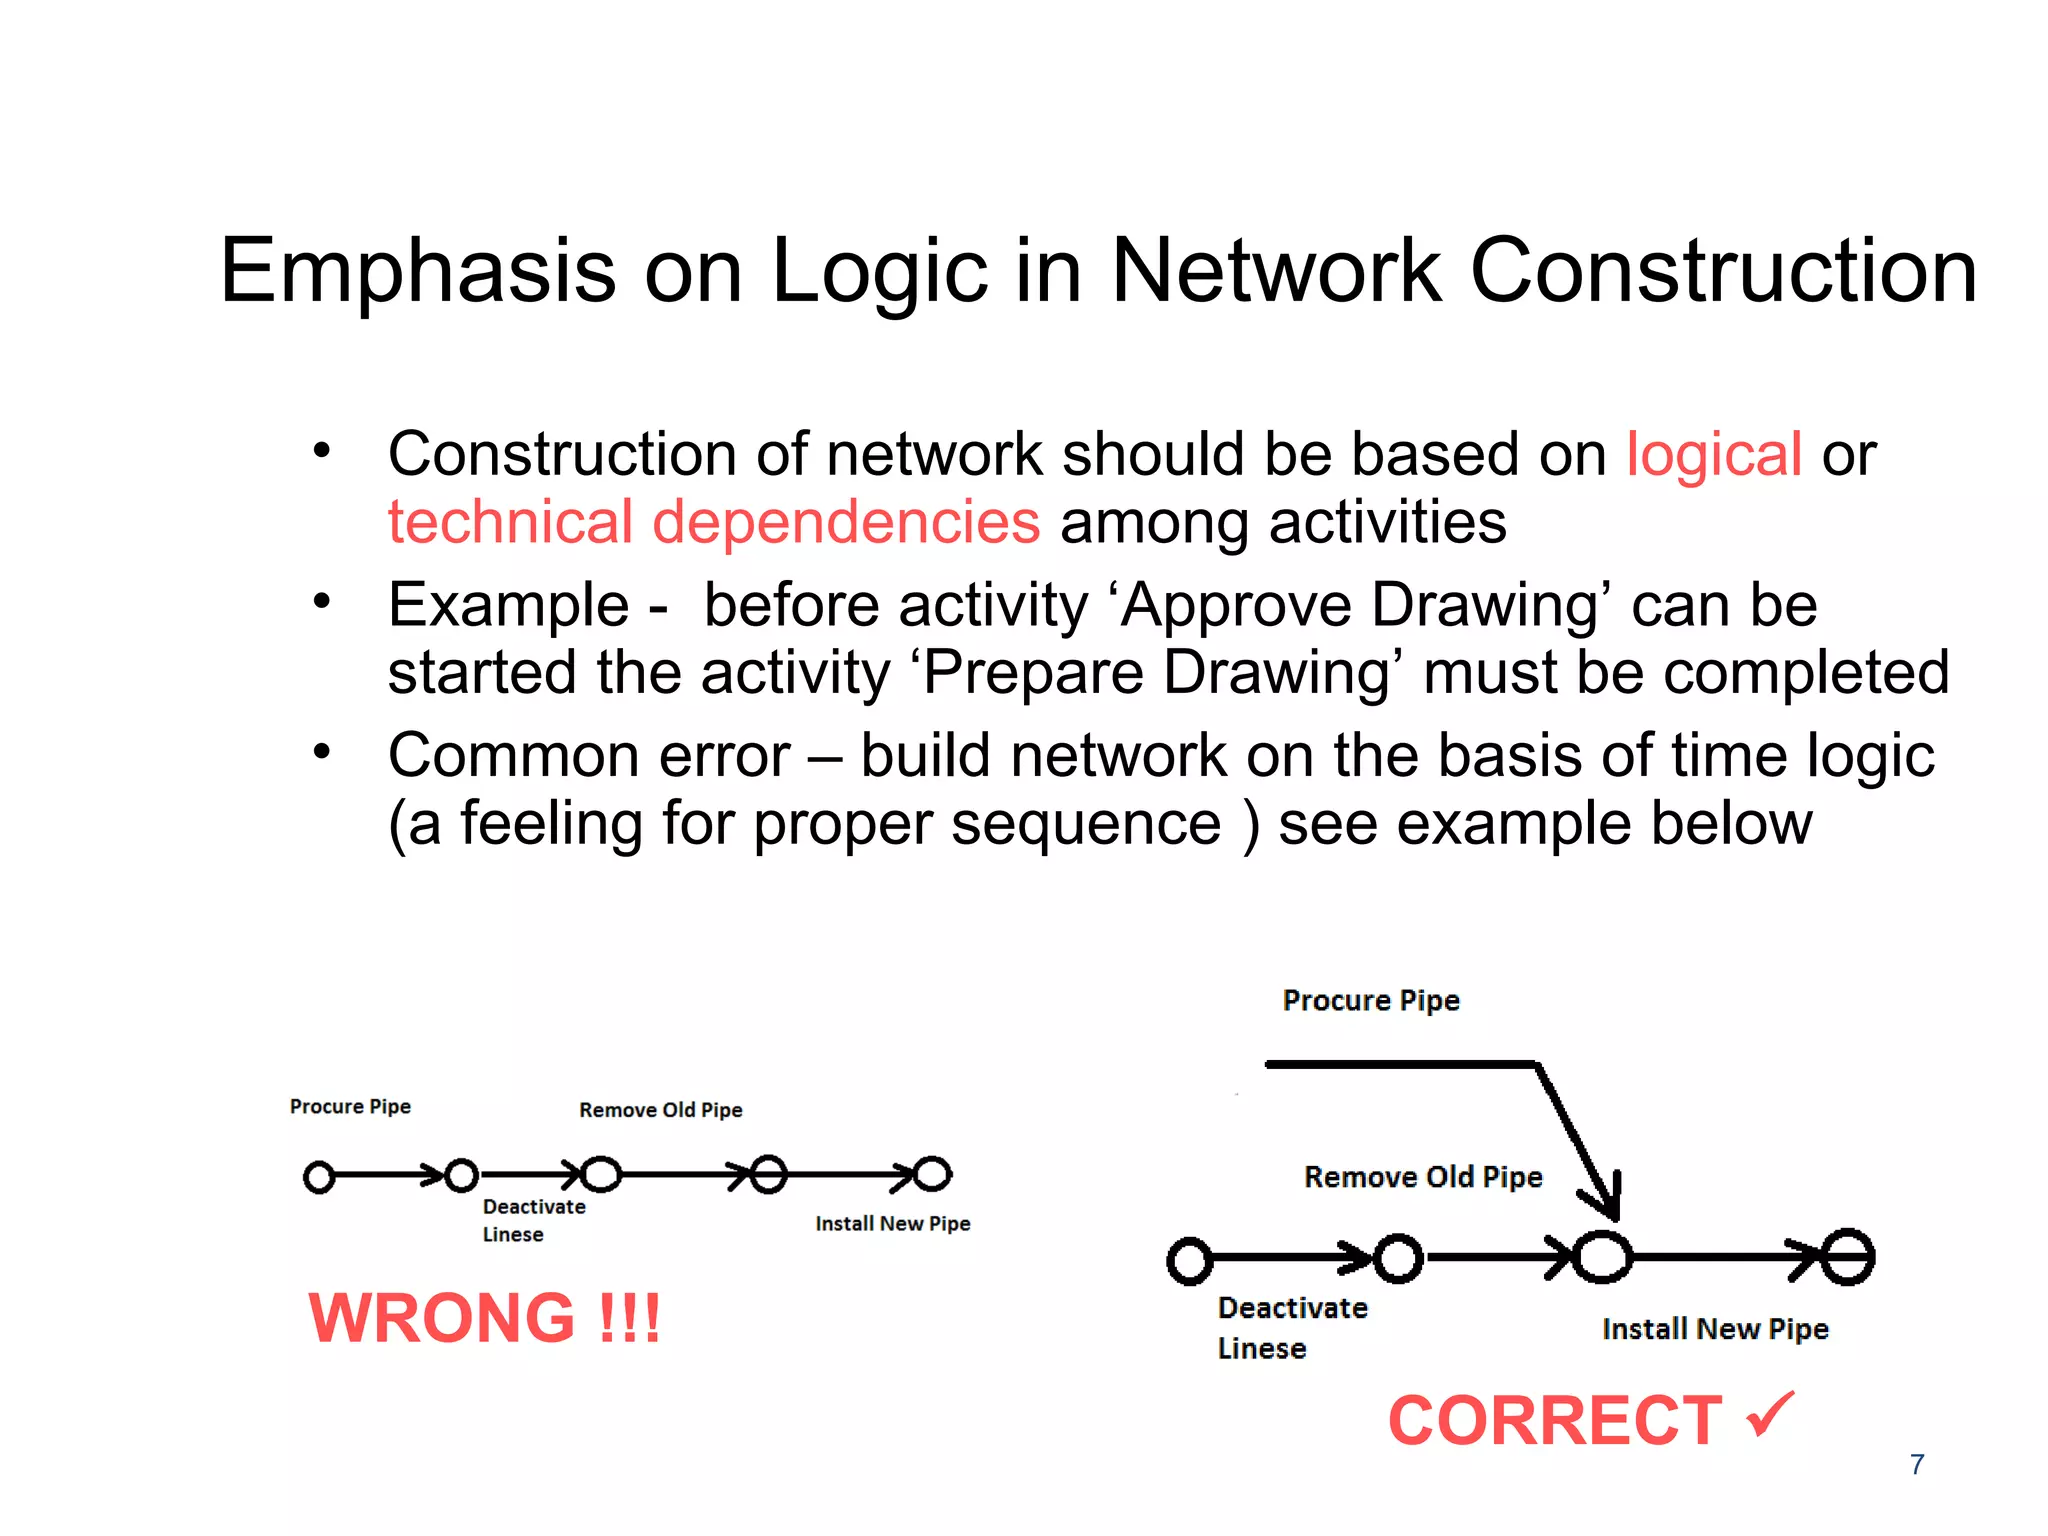
Emphasis on Logicin Network Construction
• Construction of network should be based on logical or
technical dependencies among activities
• Example - before activity ‘Approve Drawing’ can be
started the activity ‘Prepare Drawing’ must be completed
• Common error – build network on the basis of time logic
(a feeling for proper sequence ) see example below
7
WRONG !!!
CORRECT
8.
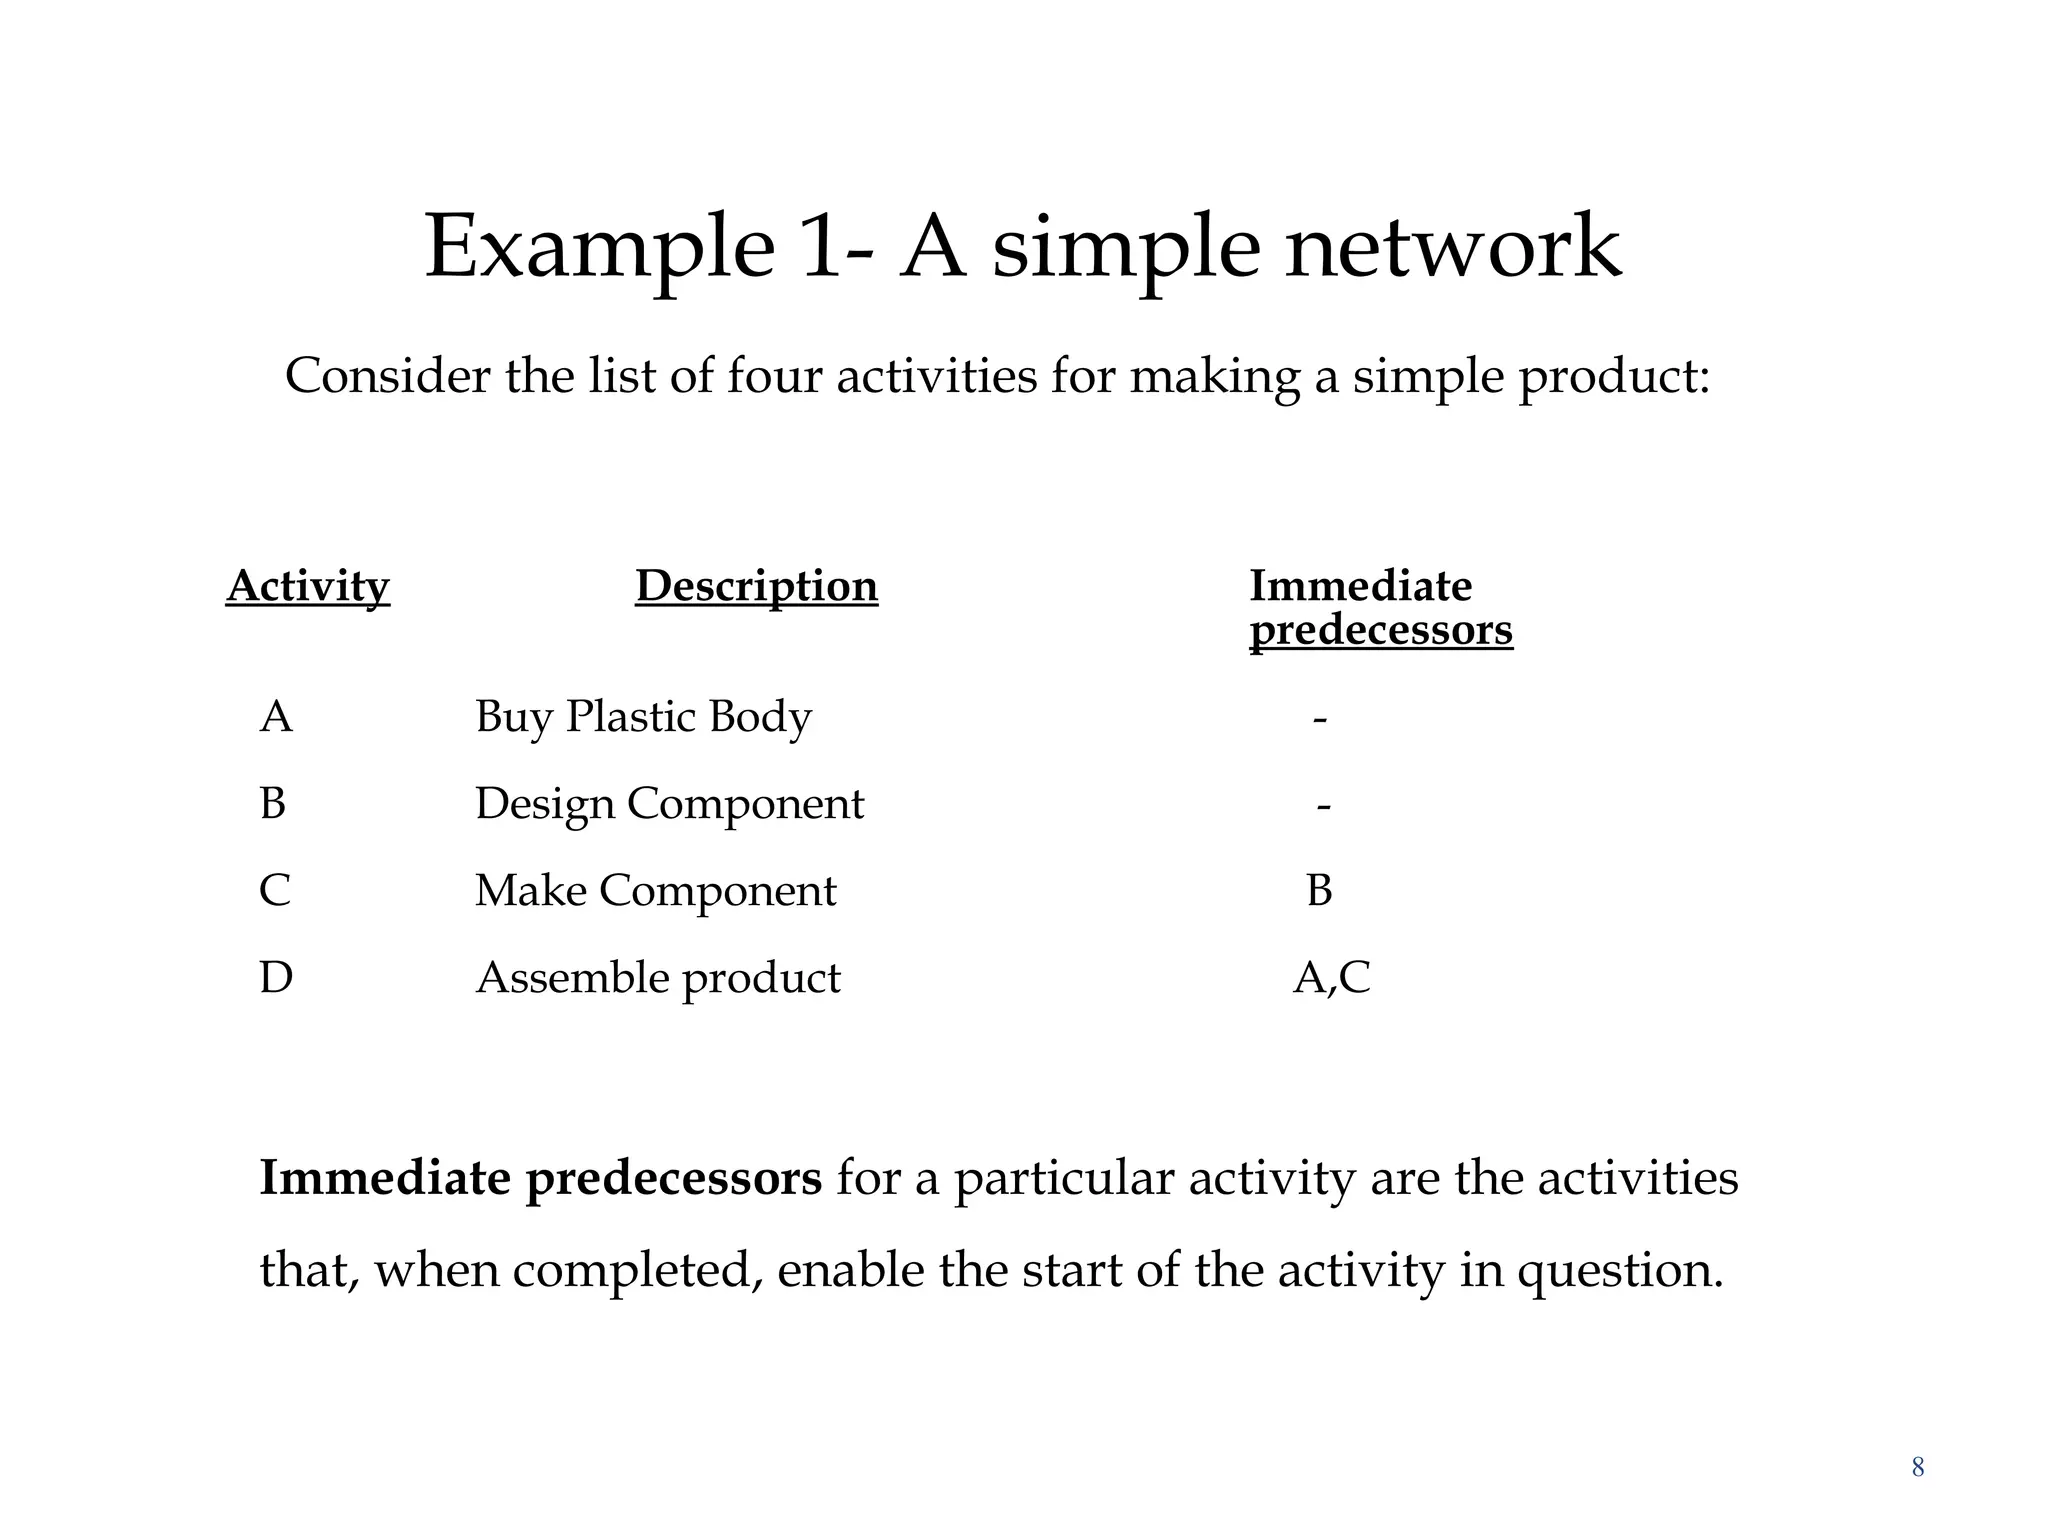
Example 1- Asimple network
Consider the list of four activities for making a simple product:
8
Activity Description Immediate
predecessors
A Buy Plastic Body -
B Design Component -
C Make Component B
D Assemble product A,C
Immediate predecessors for a particular activity are the activities
that, when completed, enable the start of the activity in question.
9.
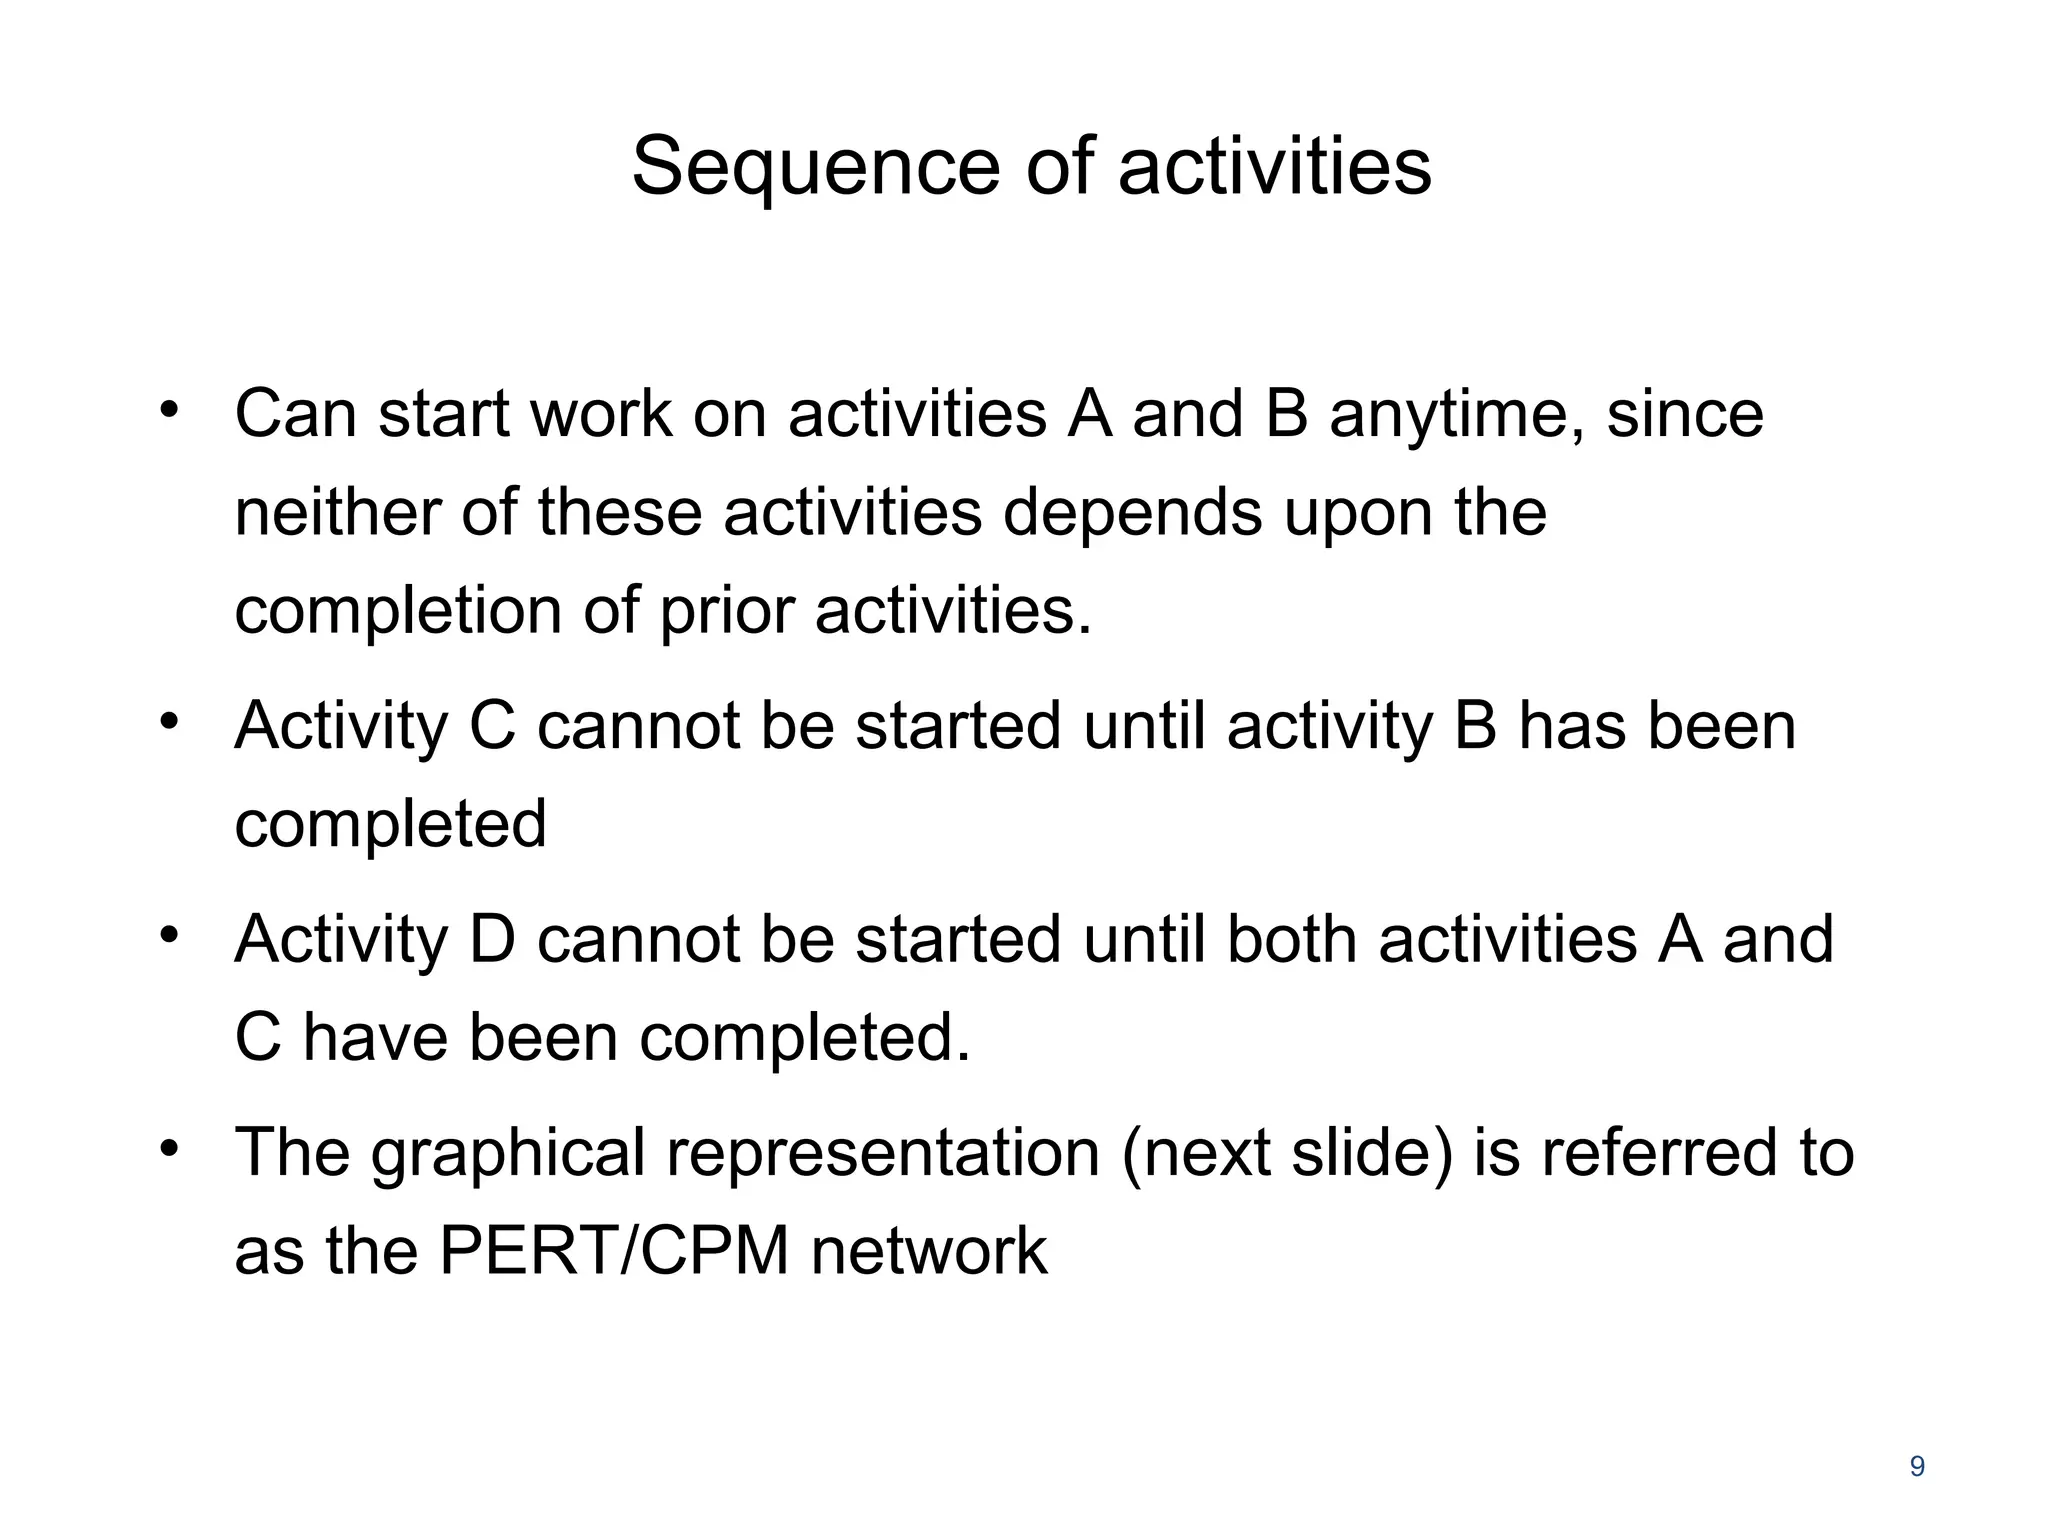
Sequence of activities
•Can start work on activities A and B anytime, since
neither of these activities depends upon the
completion of prior activities.
• Activity C cannot be started until activity B has been
completed
• Activity D cannot be started until both activities A and
C have been completed.
• The graphical representation (next slide) is referred to
as the PERT/CPM network
9
10.
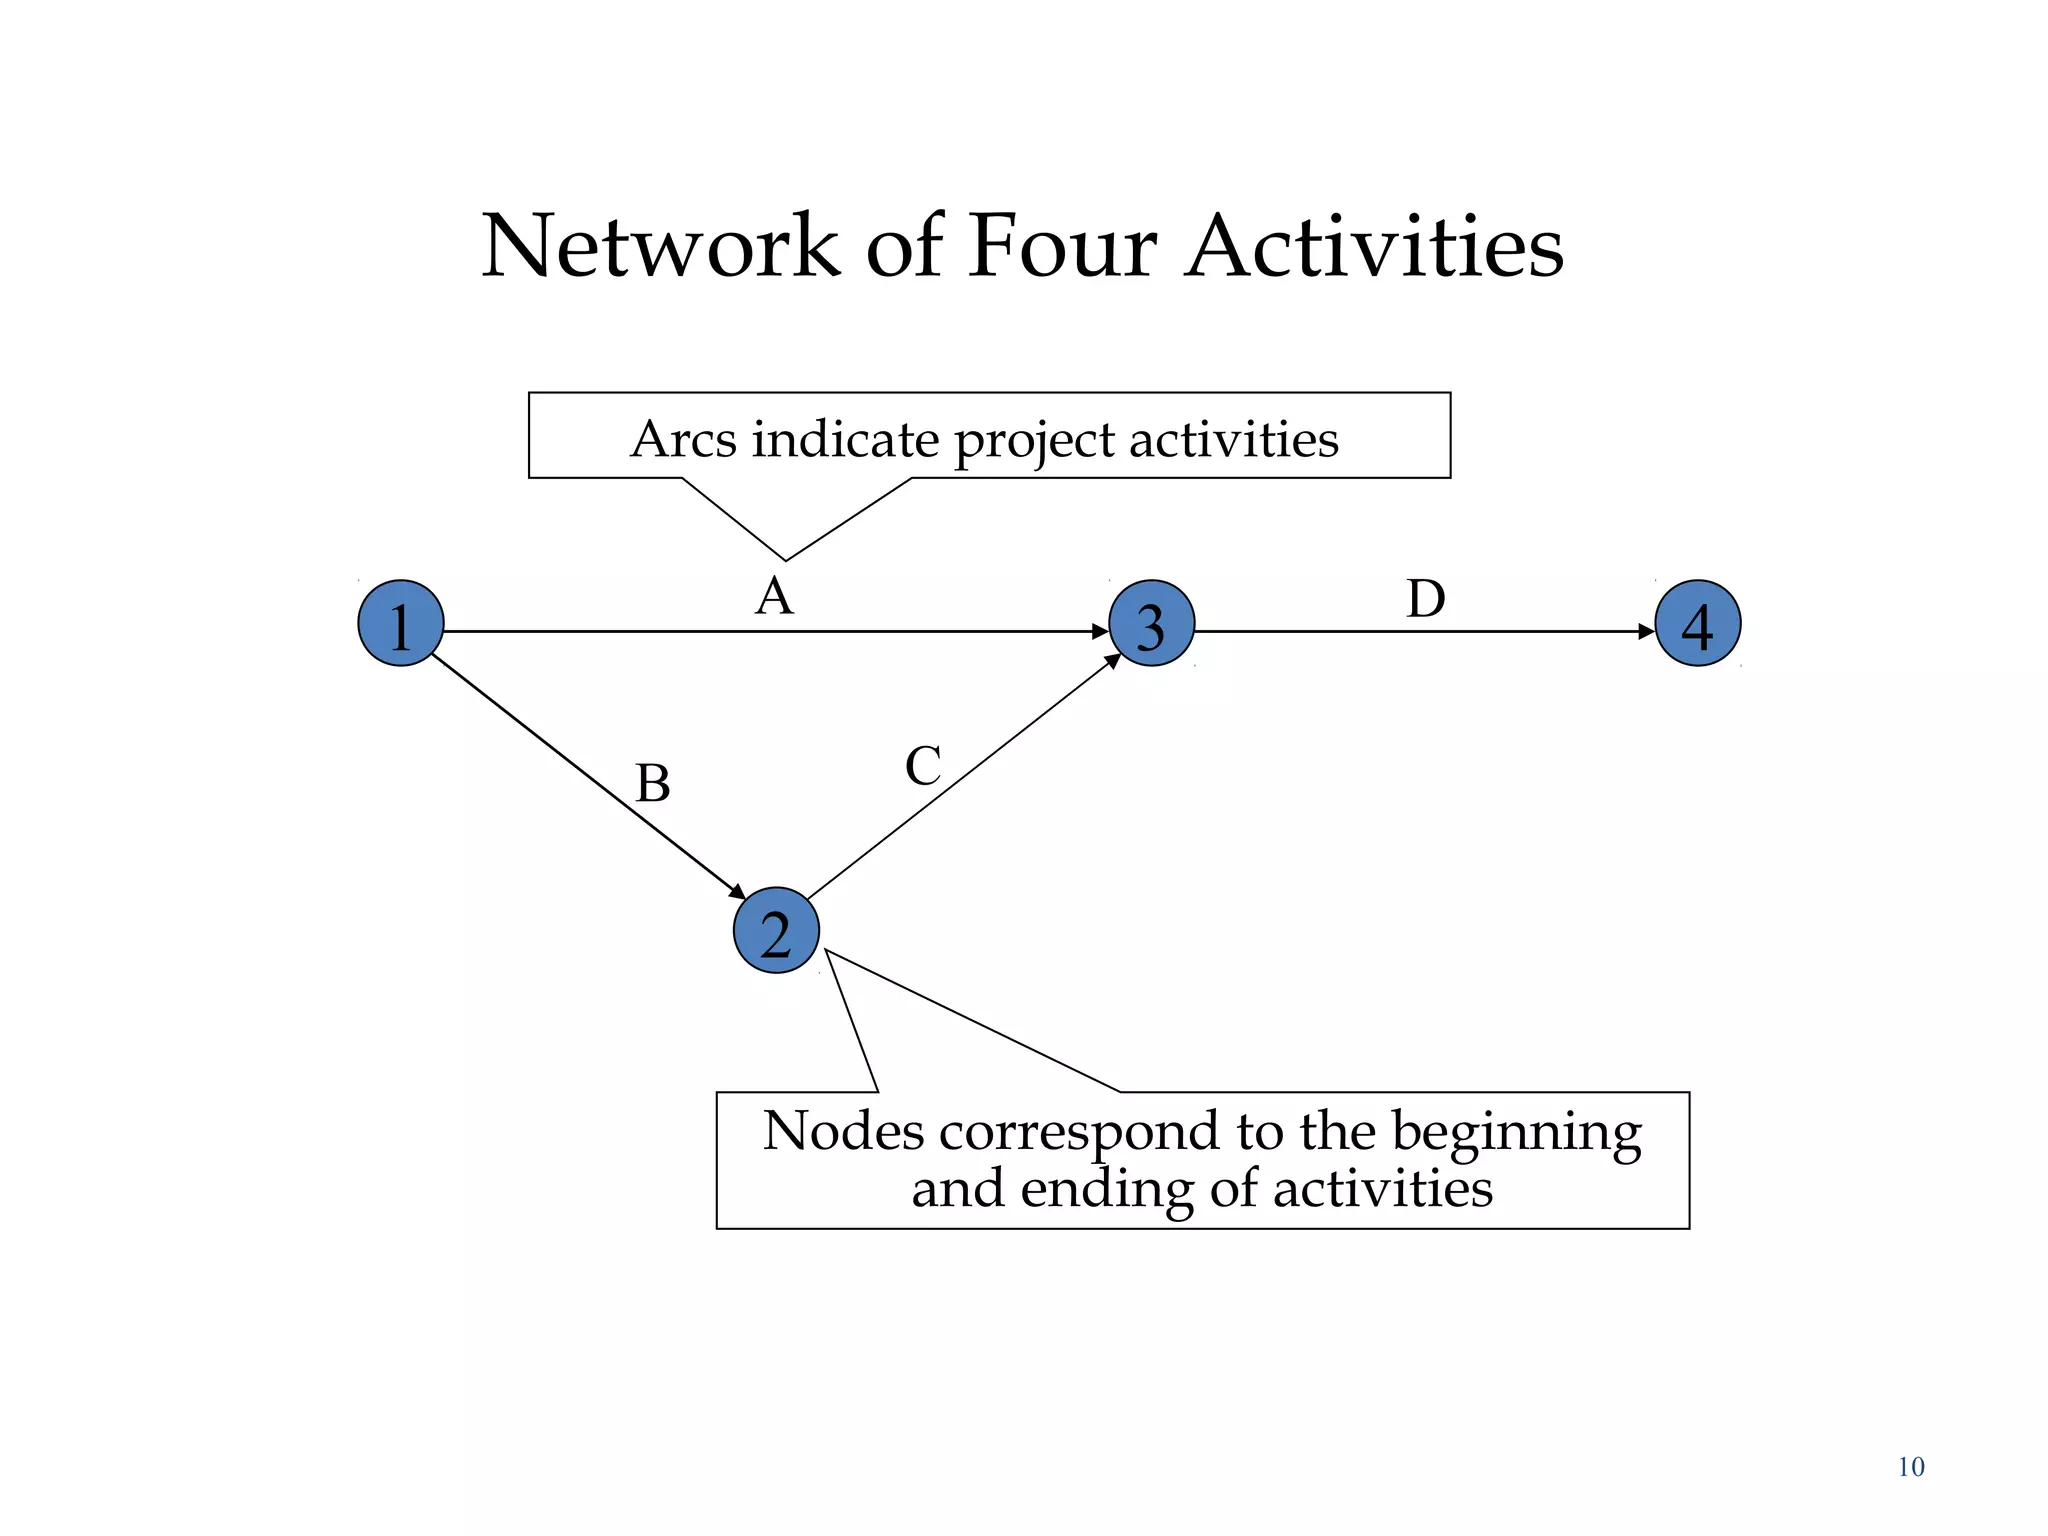
Network of FourActivities
10
1 3 4
2
A
B C
D
Arcs indicate project activities
Nodes correspond to the beginning
and ending of activities
11.
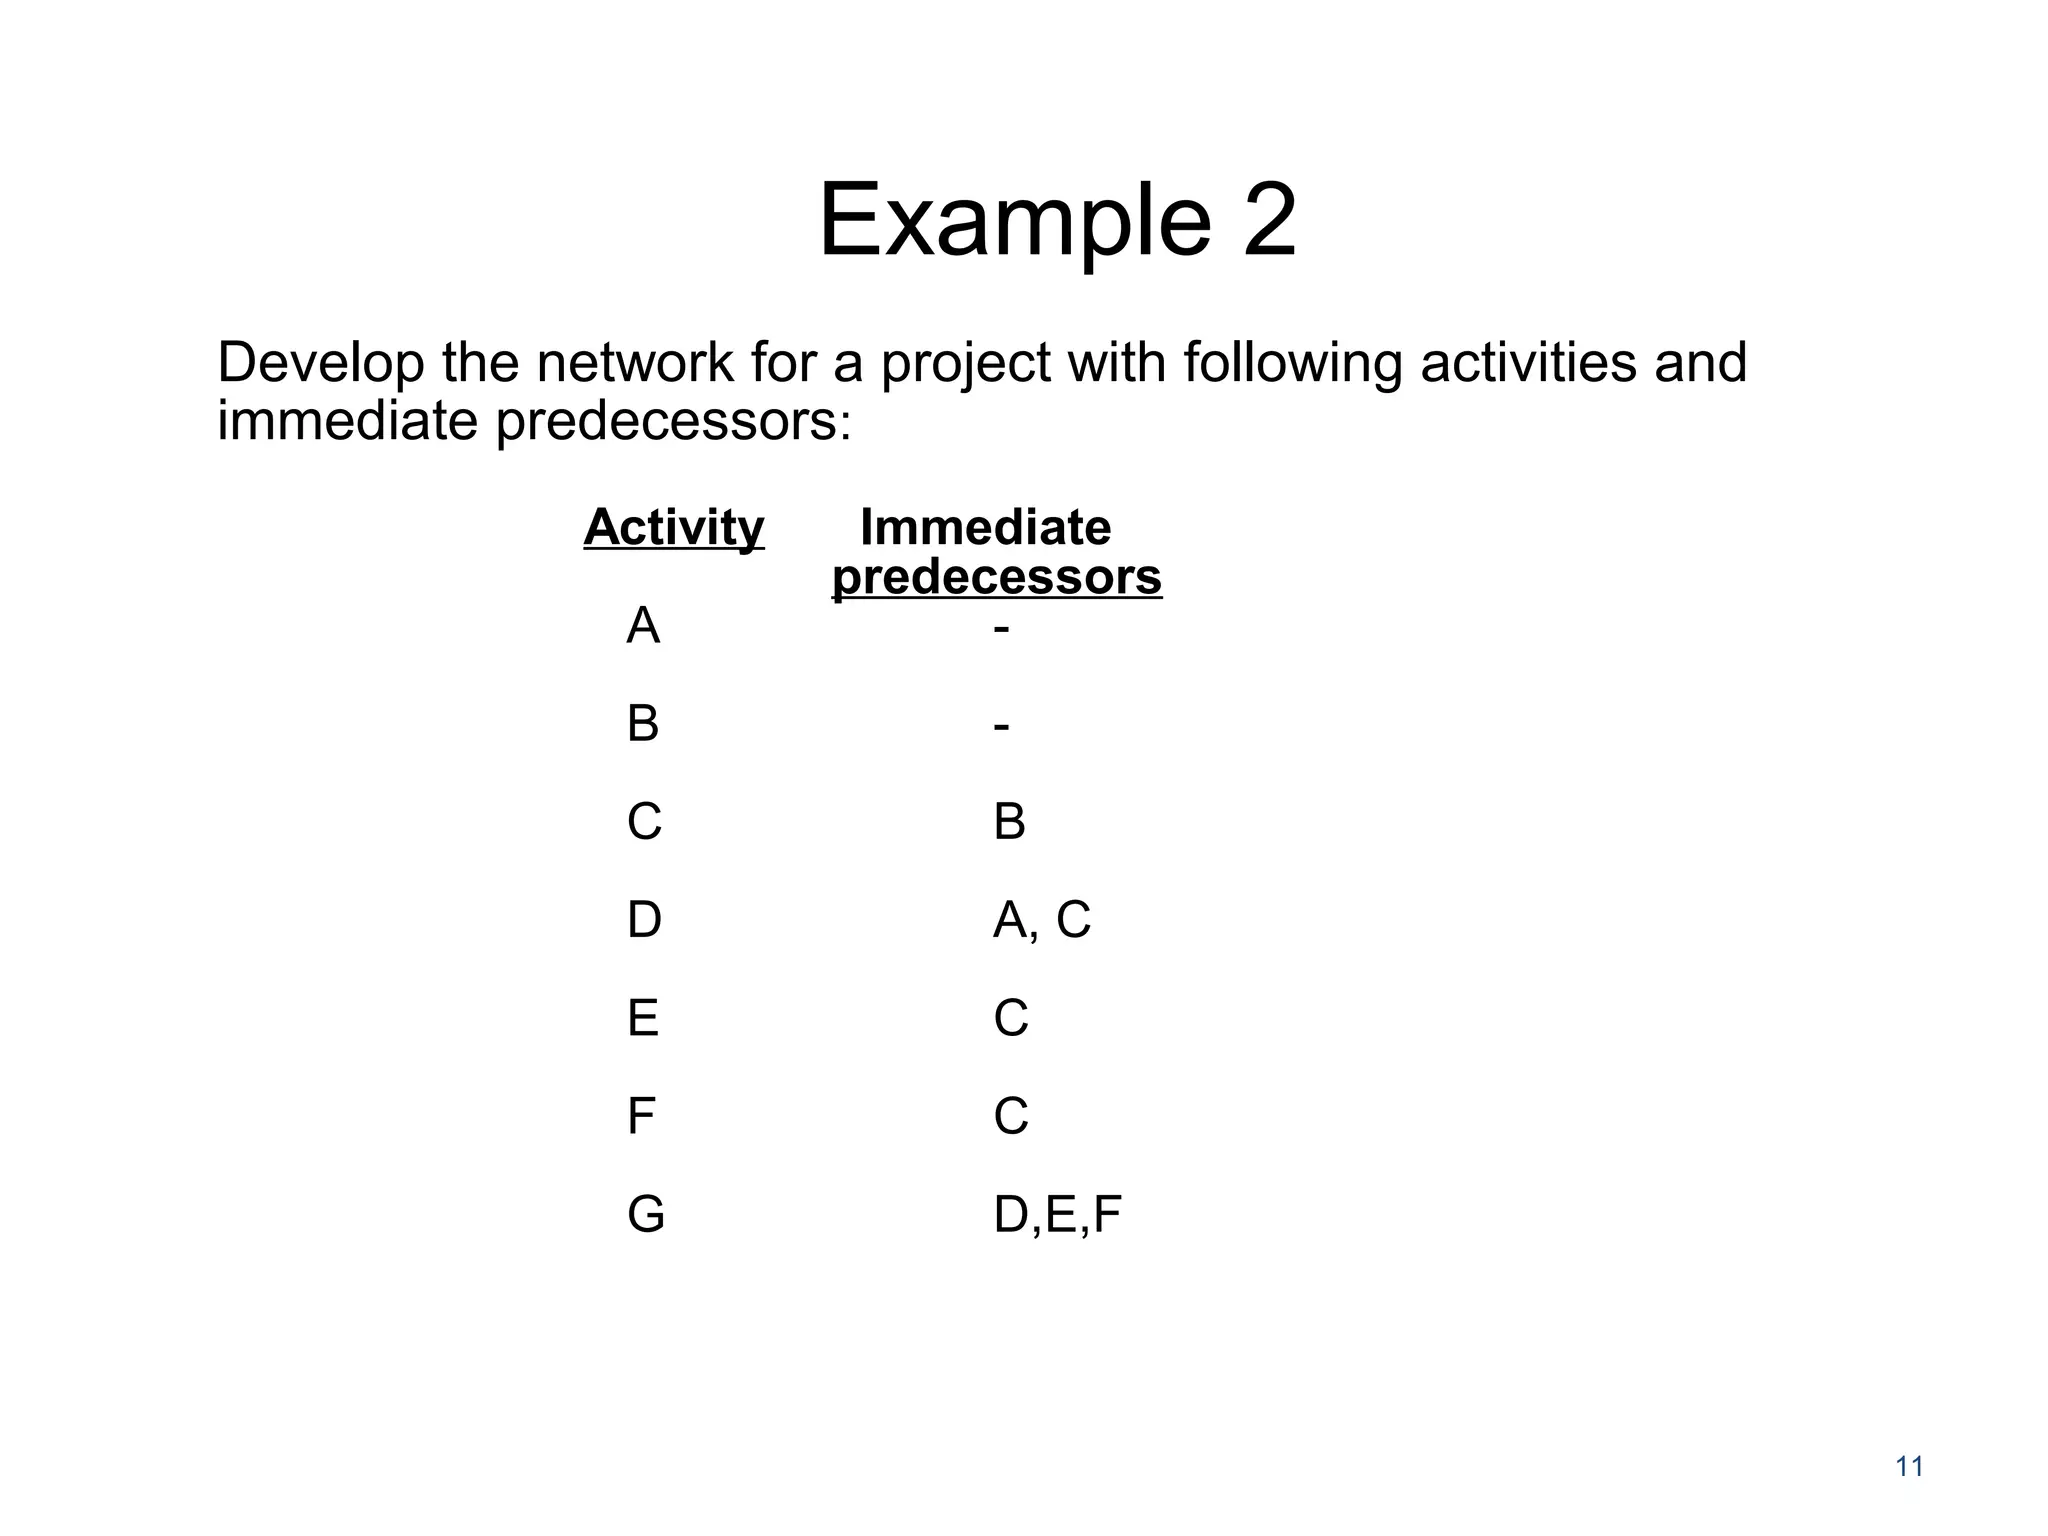
Example 2
Develop thenetwork for a project with following activities and
immediate predecessors:
11
Activity Immediate
predecessors
A -
B -
C B
D A, C
E C
F C
G D,E,F
12.
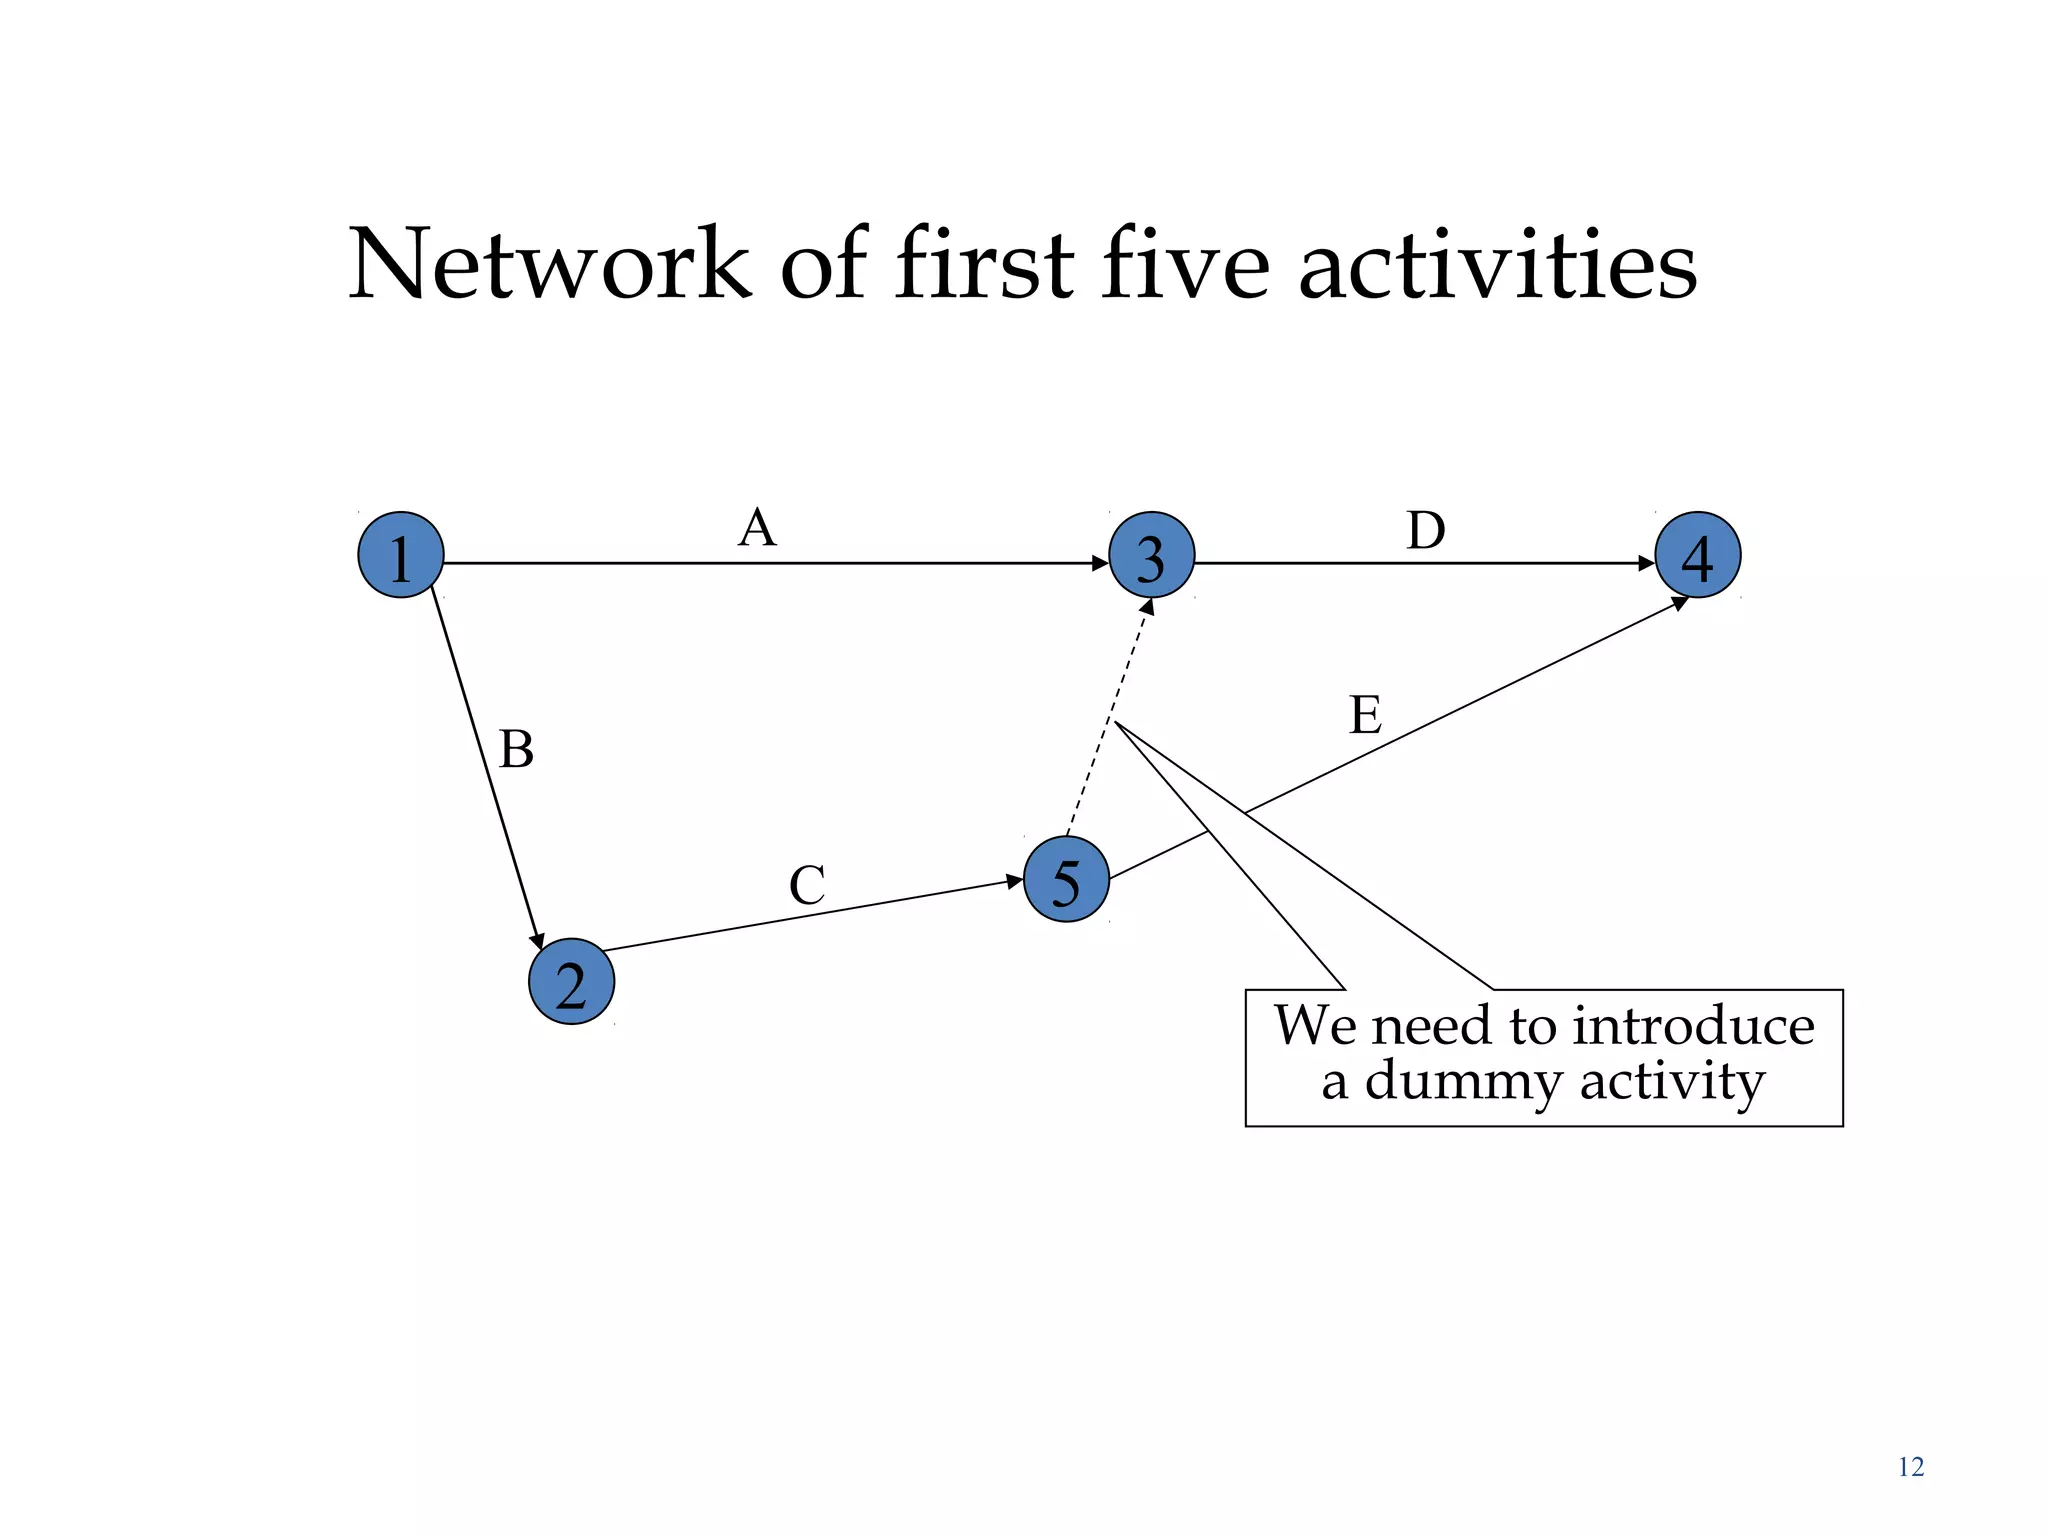
Network of firstfive activities
12
1 3 4
2
A
B
C
D
5
E
We need to introduce
a dummy activity
13.
13
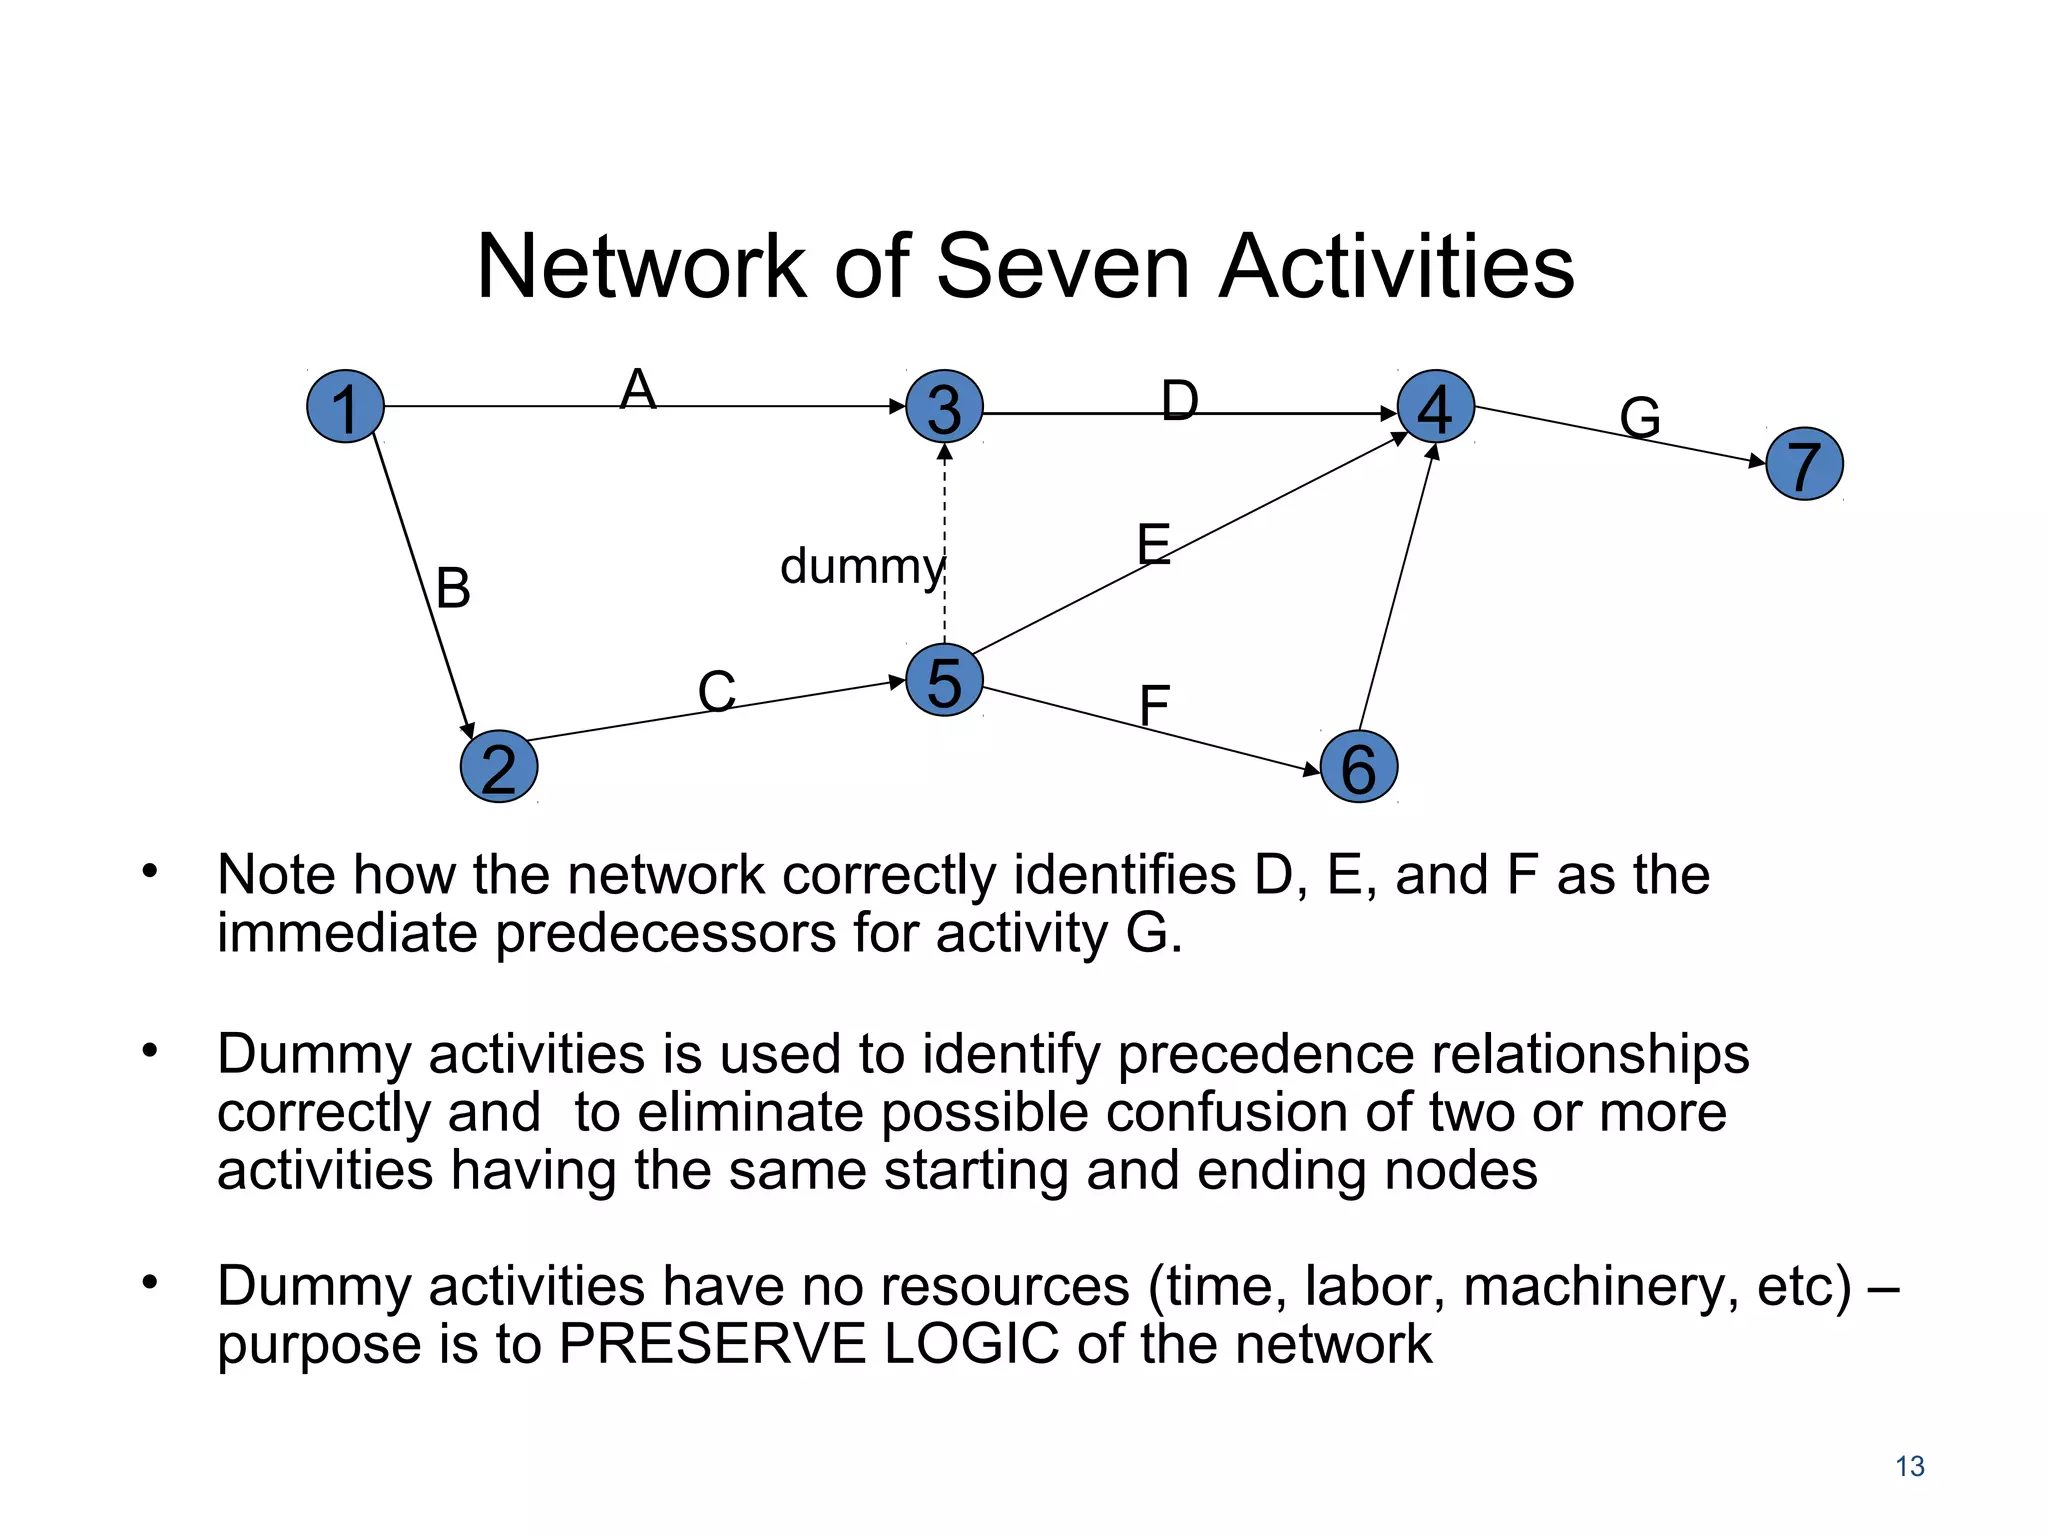
• Note howthe network correctly identifies D, E, and F as the
immediate predecessors for activity G.
• Dummy activities is used to identify precedence relationships
correctly and to eliminate possible confusion of two or more
activities having the same starting and ending nodes
• Dummy activities have no resources (time, labor, machinery, etc) –
purpose is to PRESERVE LOGIC of the network
Network of Seven Activities
1 3 4
2
A
B
C
D
5
E
7
6
F
G
dummy
14.
14
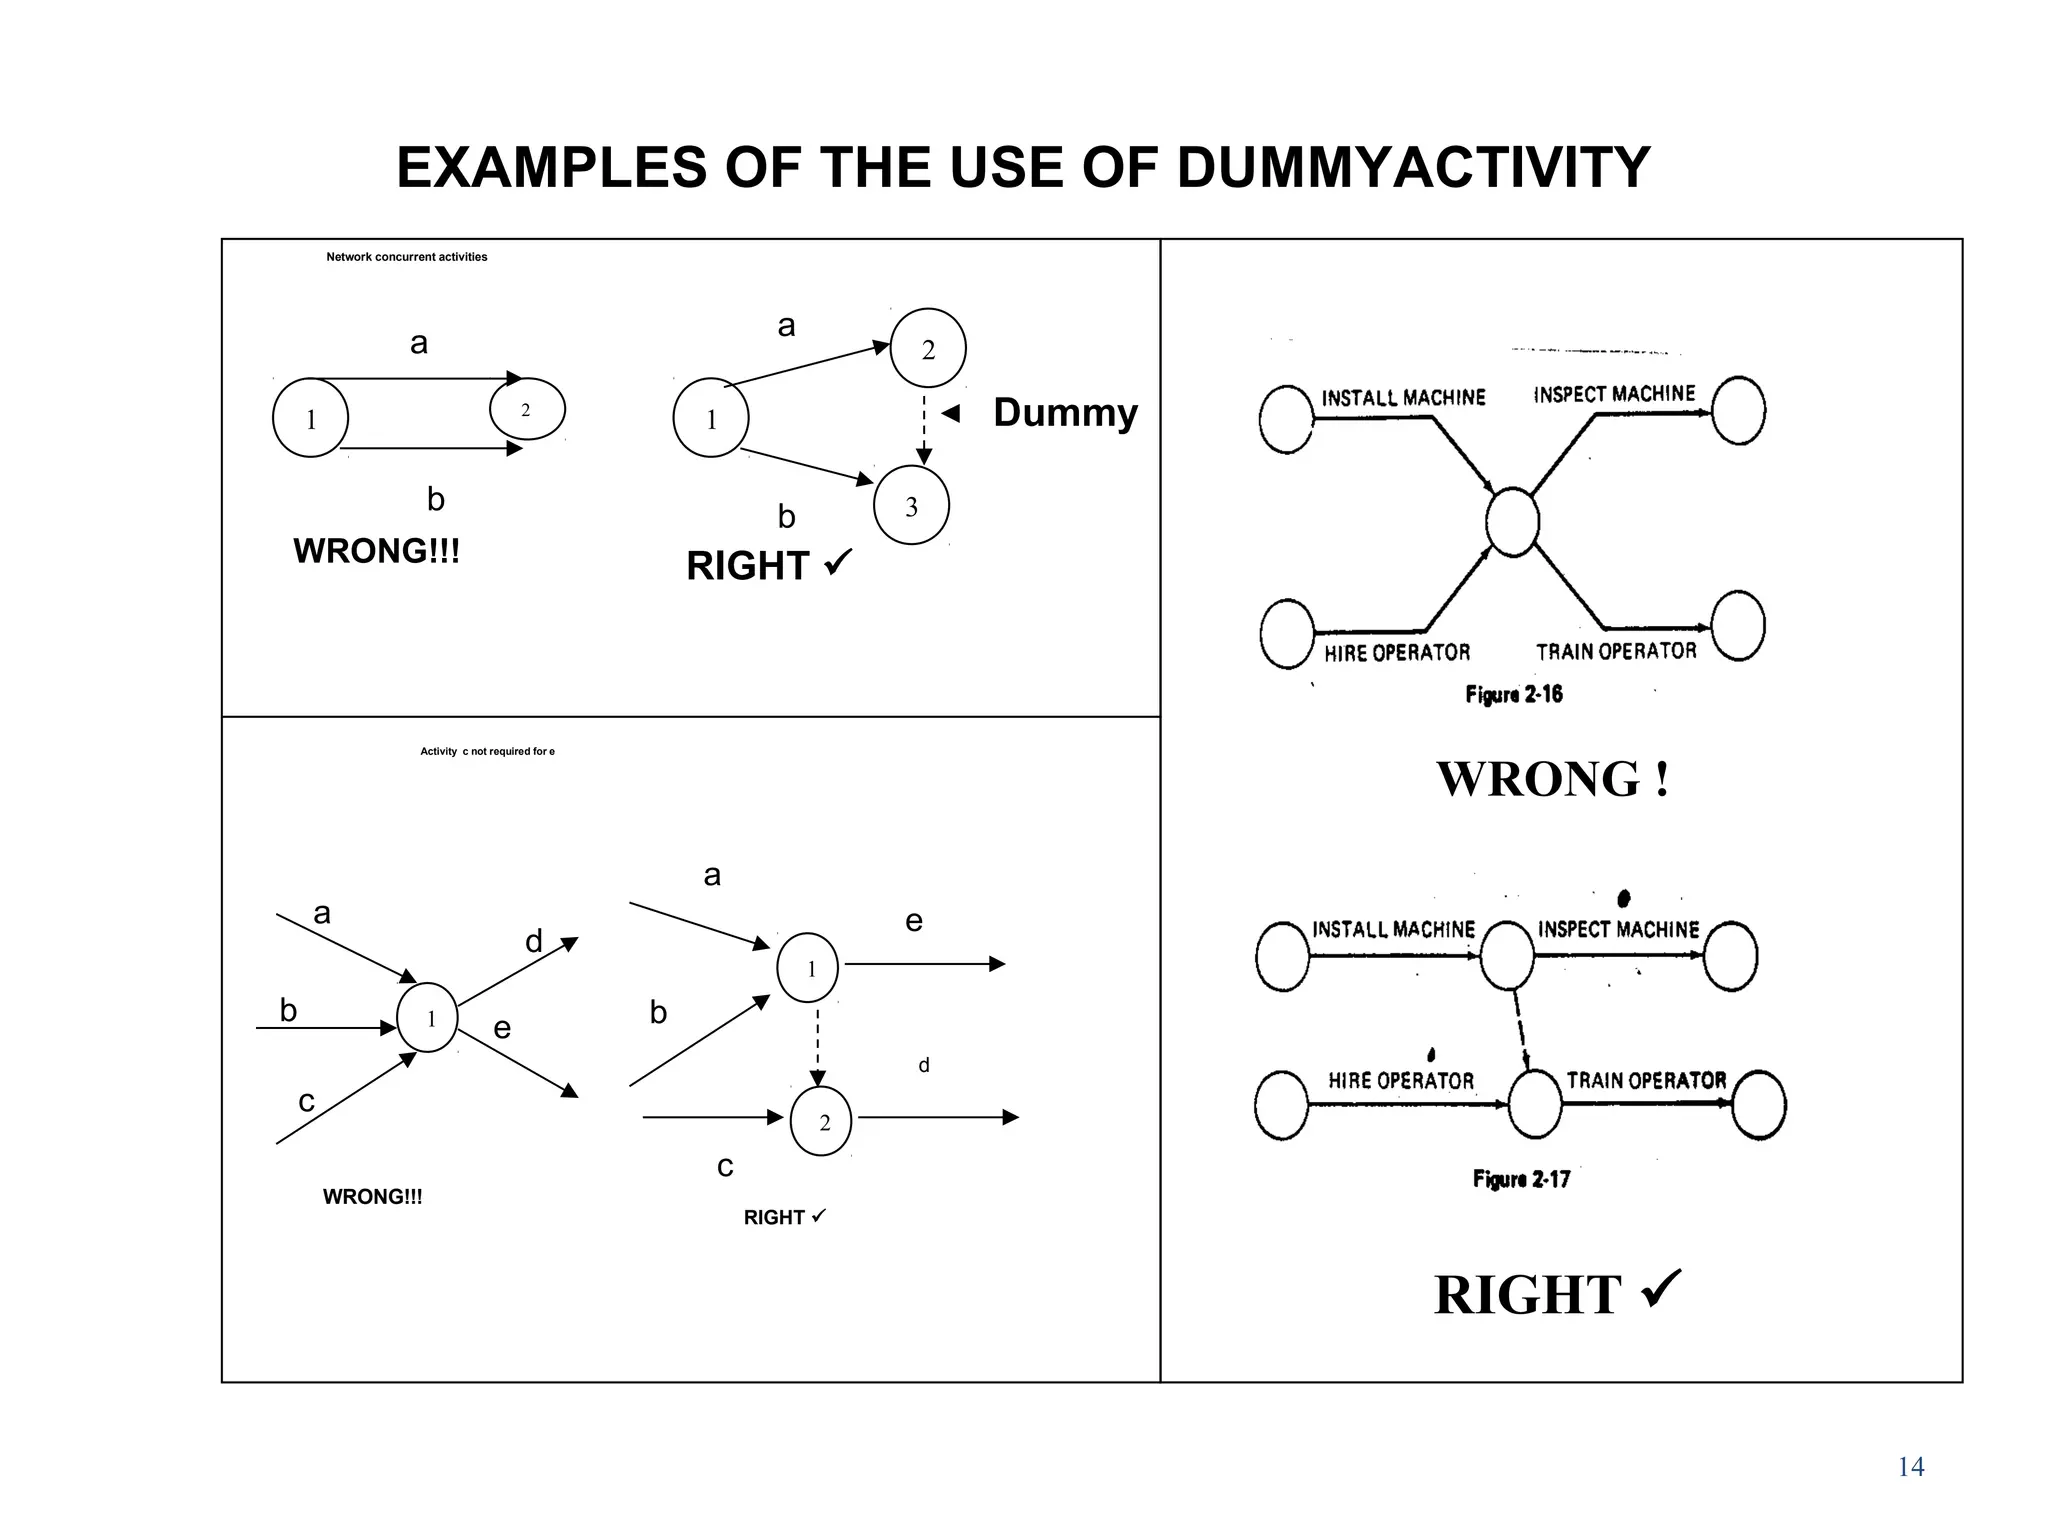
EXAMPLES OF THEUSE OF DUMMYACTIVITY
Dummy
RIGHT
1
1
2
Activity c not required for e
a
b
c
d
e
a
b
c
d
e
WRONG!!!
RIGHT
Network concurrent activities
1 2
1
2
3
a
WRONG!!!
a
b
b
WRONG !
RIGHT
15.
15
1
2
3
a d
b e
cf
1
2
3
4
a d
b
e
fc
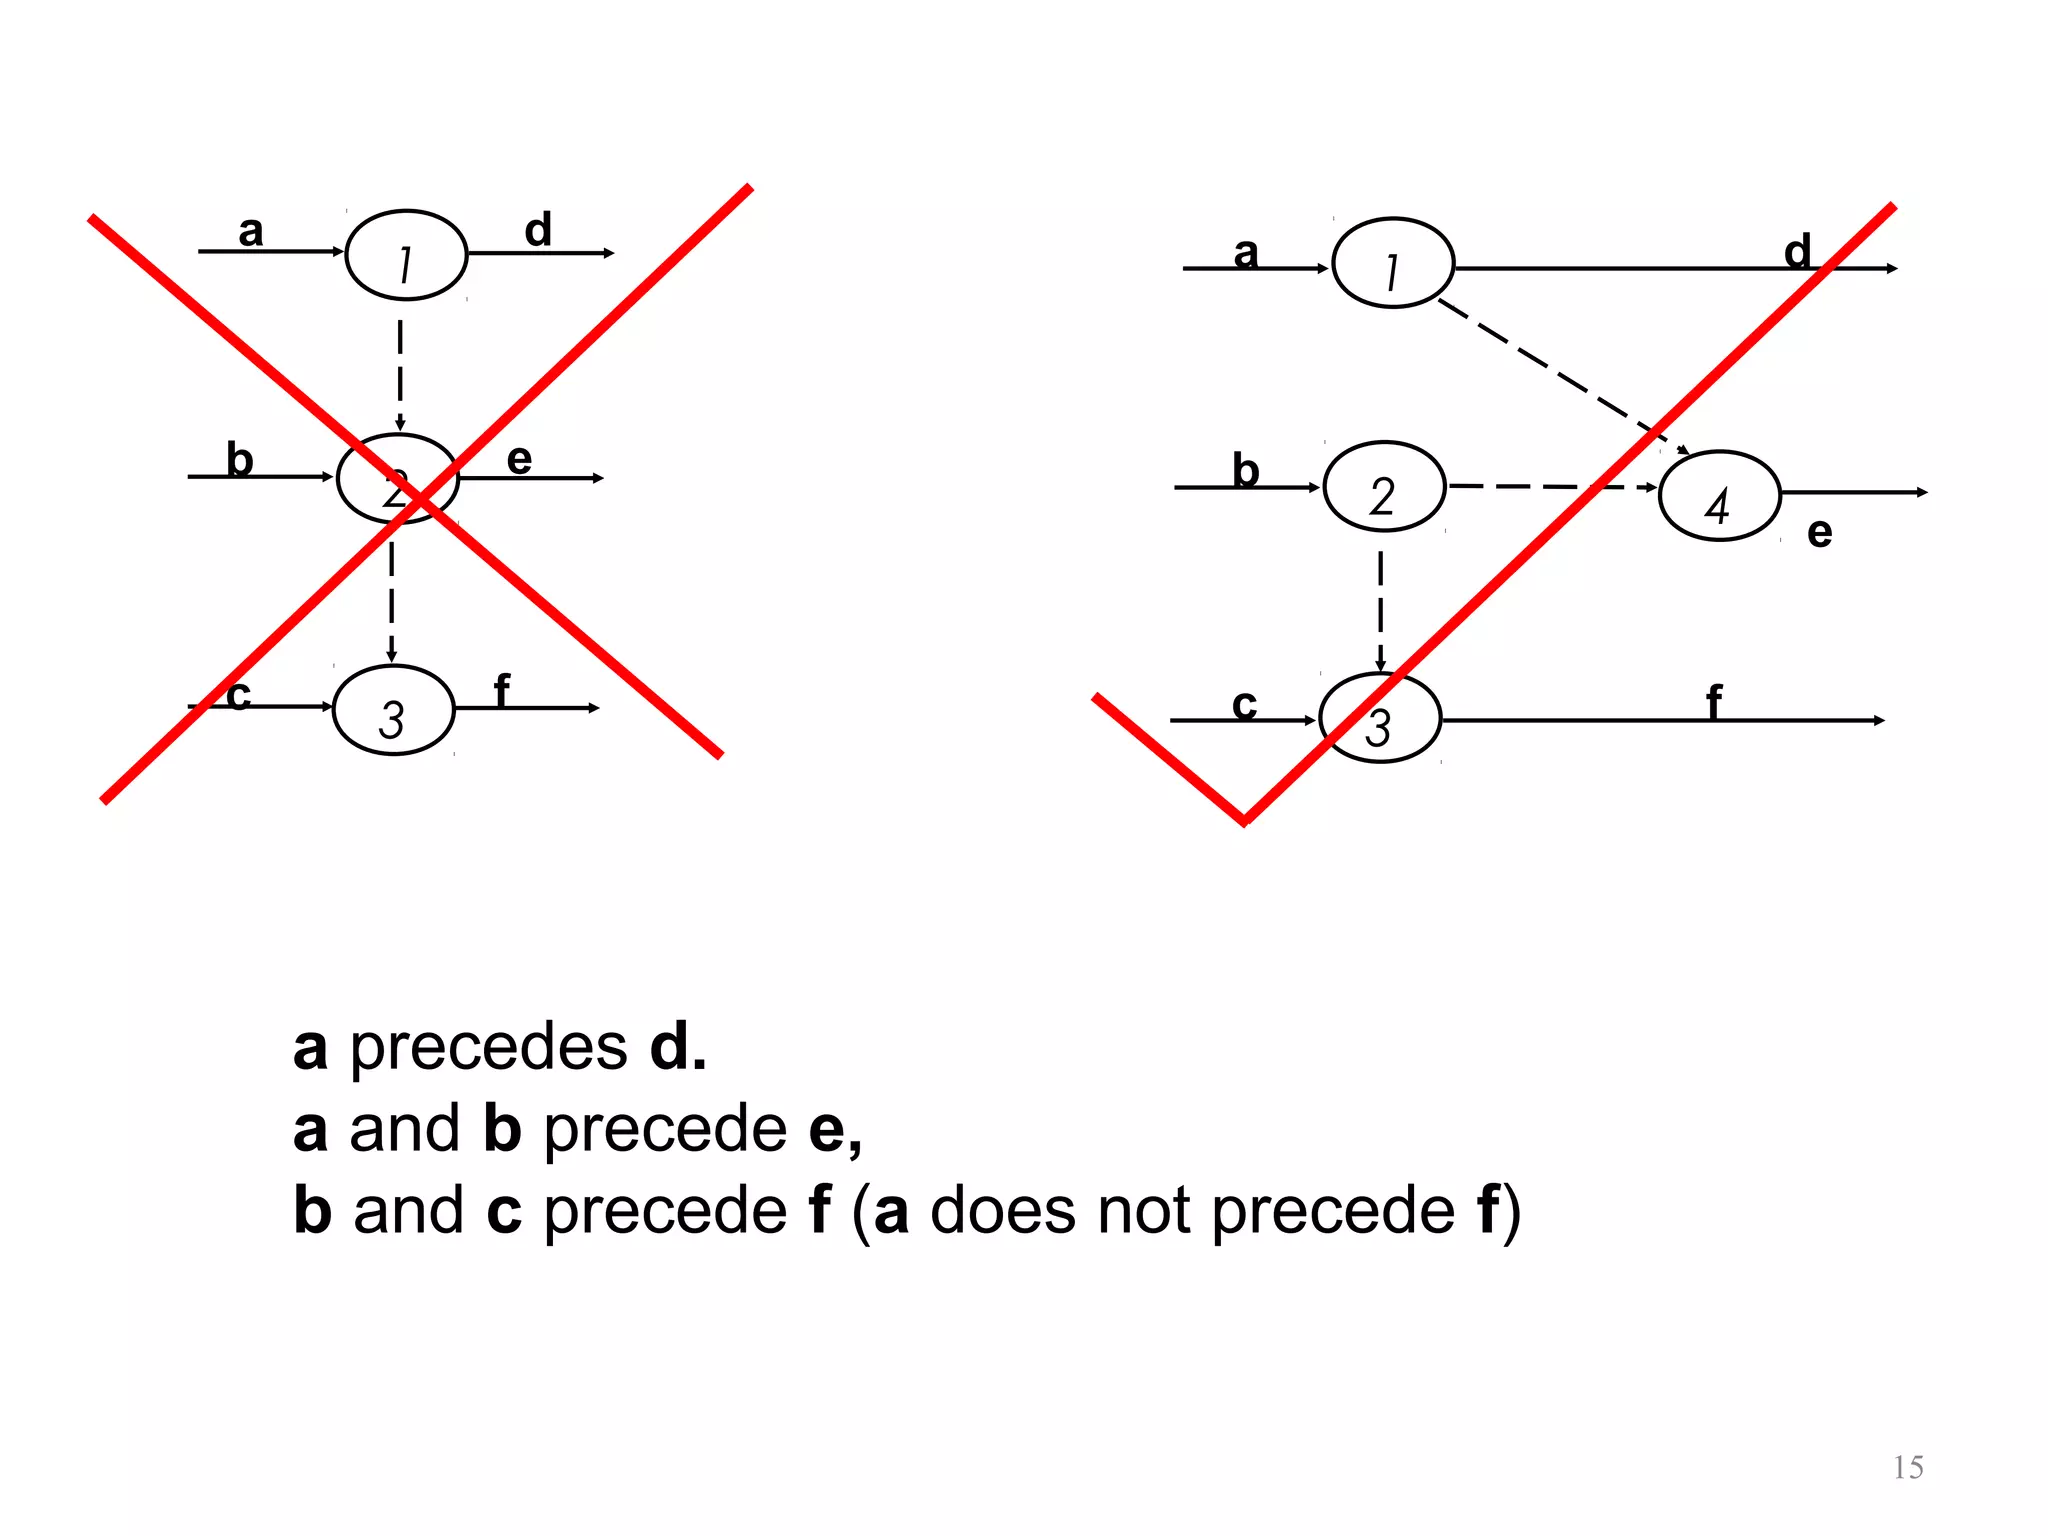
a precedes d.
a and b precede e,
b and c precede f (a does not precede f)
16.
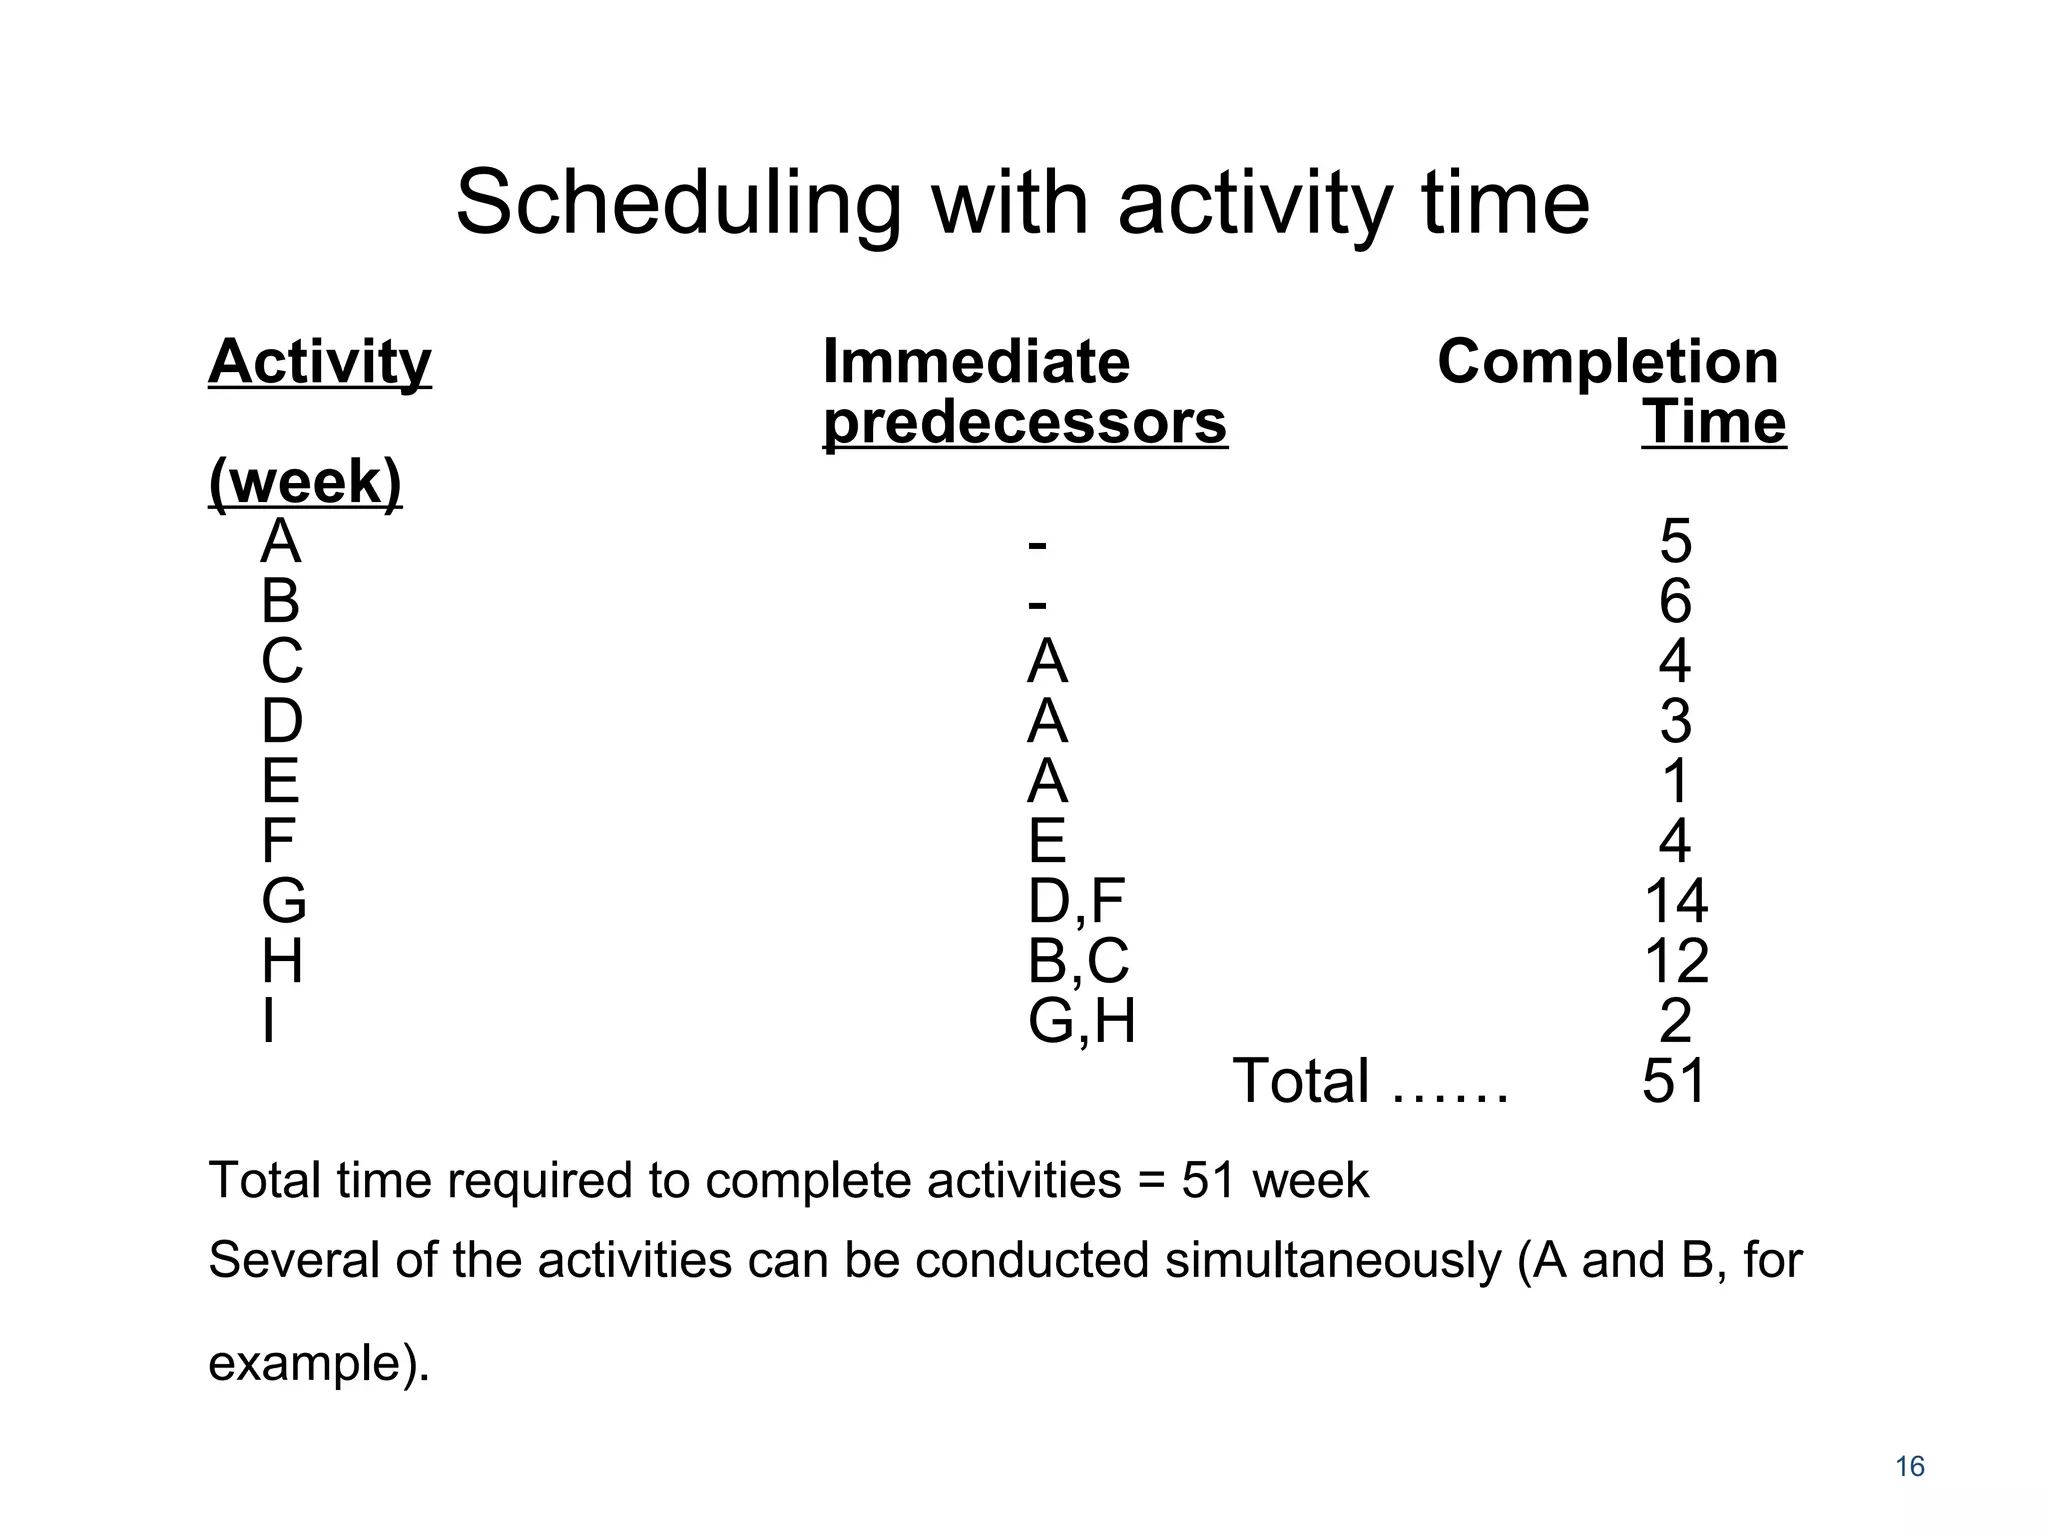
Scheduling with activitytime
16
Activity Immediate Completion
predecessors Time
(week)
A - 5
B - 6
C A 4
D A 3
E A 1
F E 4
G D,F 14
H B,C 12
I G,H 2
Total …… 51
Total time required to complete activities = 51 week
Several of the activities can be conducted simultaneously (A and B, for
example).
17.
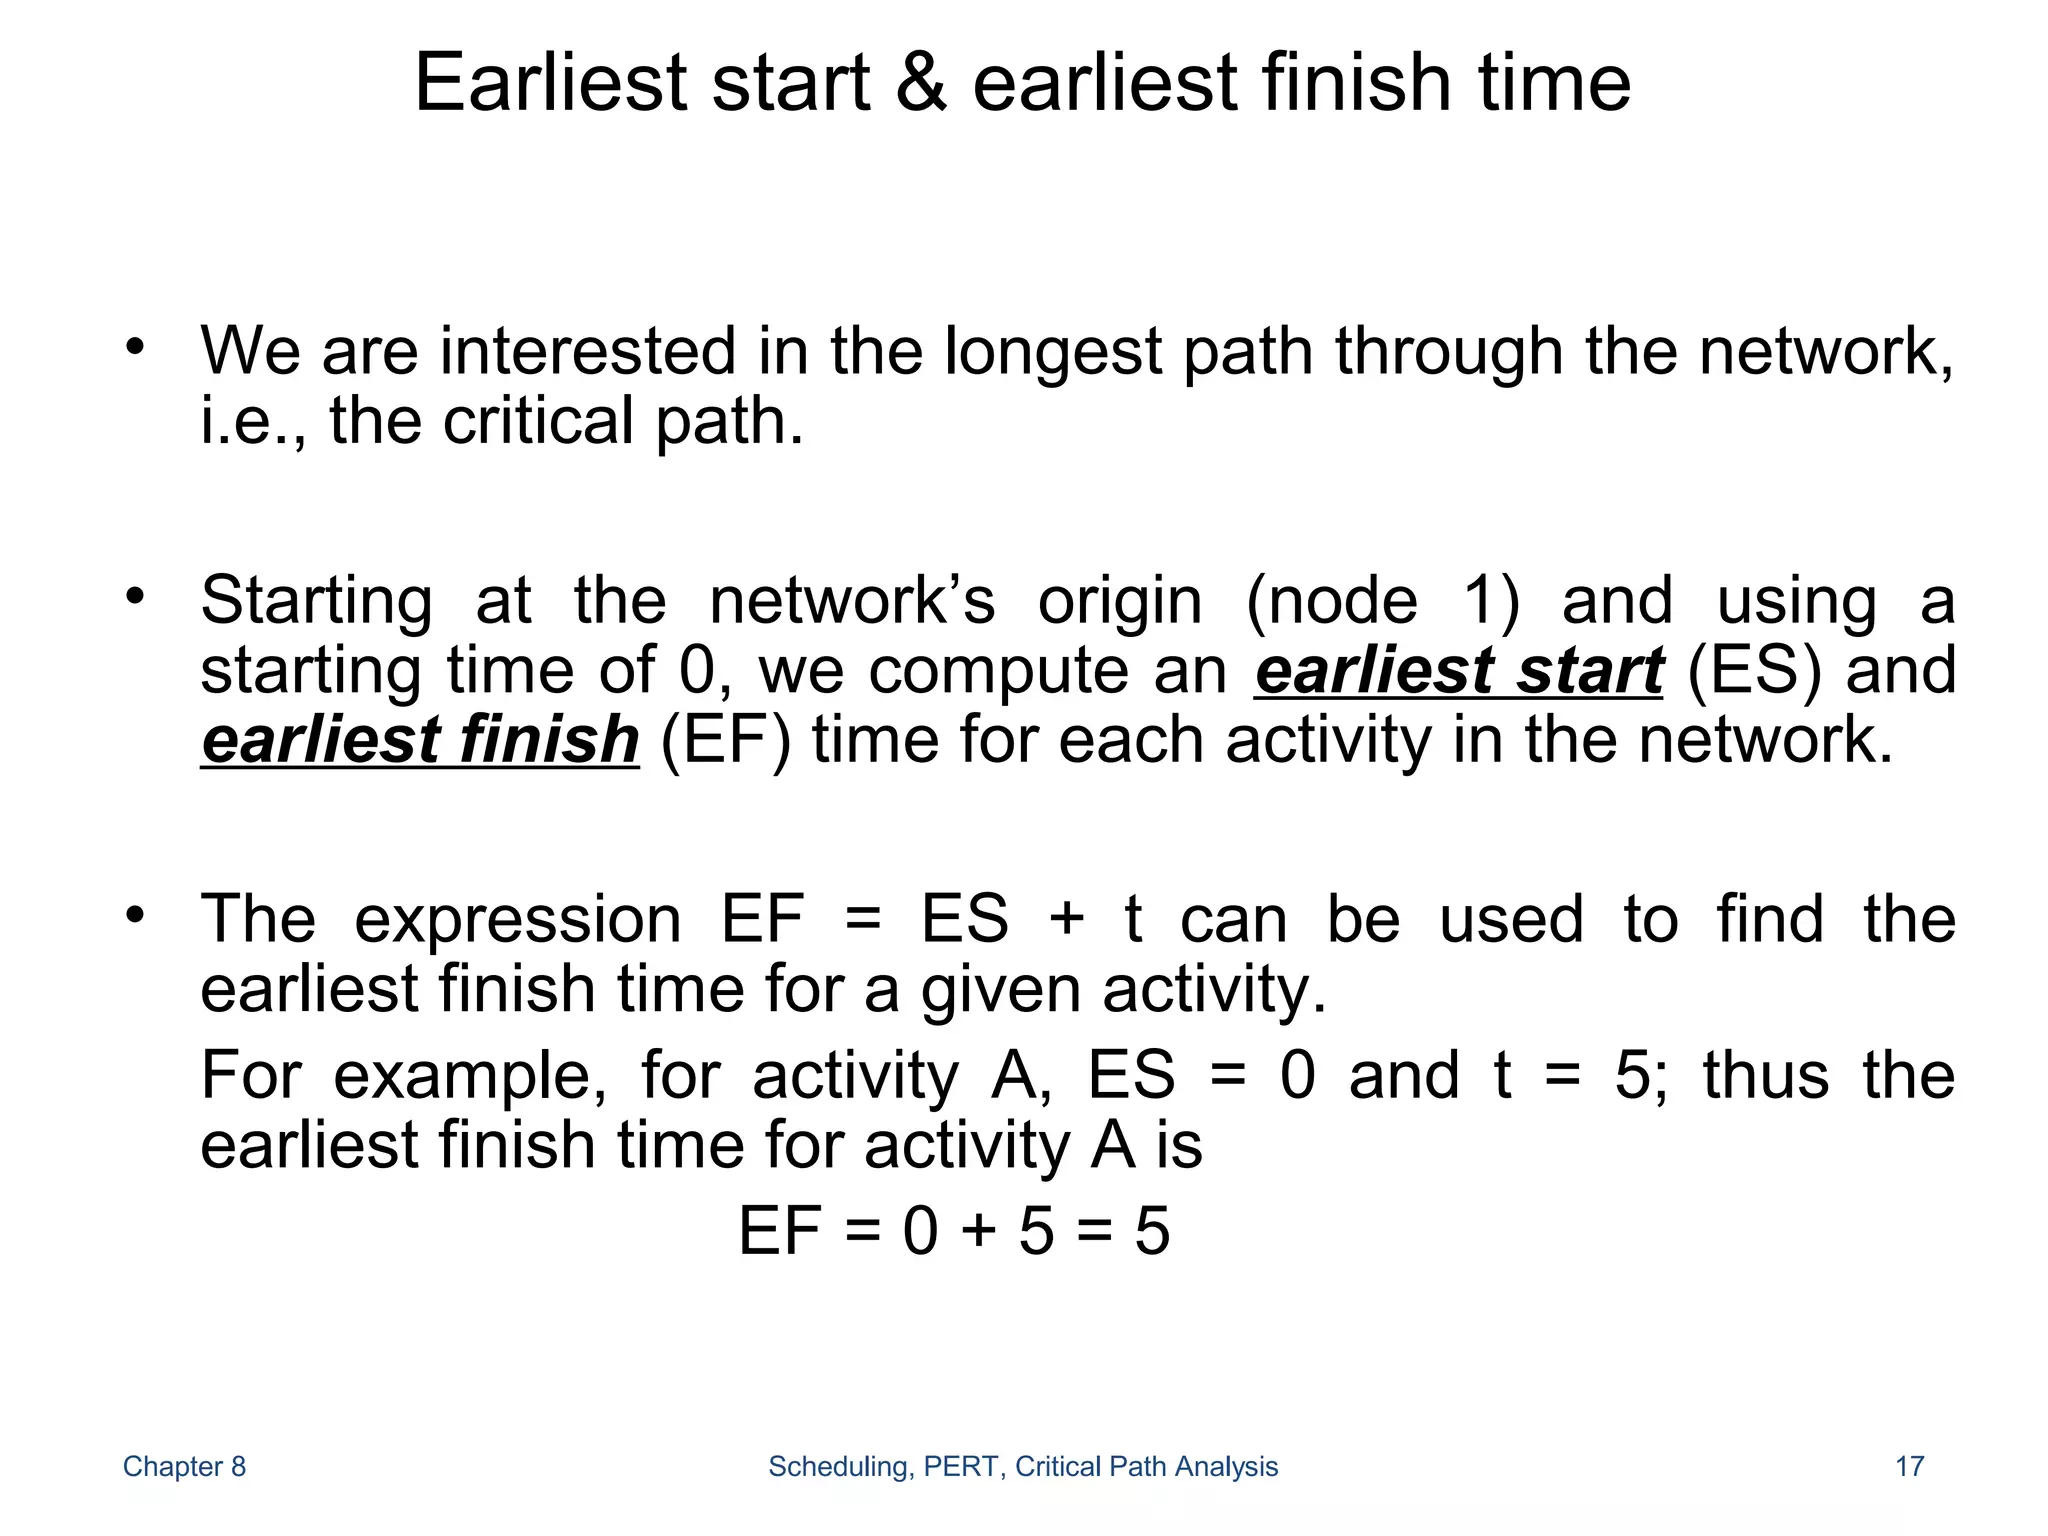
Earliest start &earliest finish time
• We are interested in the longest path through the network,
i.e., the critical path.
• Starting at the network’s origin (node 1) and using a
starting time of 0, we compute an earliest start (ES) and
earliest finish (EF) time for each activity in the network.
• The expression EF = ES + t can be used to find the
earliest finish time for a given activity.
For example, for activity A, ES = 0 and t = 5; thus the
earliest finish time for activity A is
EF = 0 + 5 = 5
Chapter 8 Scheduling, PERT, Critical Path Analysis 17
18.
Arc with ES& EF time
18
1
2
A [0,5]
5
Activity
ES = earliest start time
EF = earliest finish time
t = expected activity
time
19.
Network with ES& EF time
19
1
3
4
2
5
7
6
A[0,5]5
B[0,6]6
C[5,9]
4
D[5,8]
3
E[5,6]1 F[6,10]
4
G[10,24]
14
H[9,21]
12
I[24,26]
2
Earliest start time rule:
The earliest start time for an activity leaving a particular node is equal to
the largest of the earliest finish times for all activities entering the node.
20.
Activity, duration, ES,EF, LS, LF
20
2
3
C [5,9]
4 [8,12]
Activity
ES = earliest start time
EF = earliest finish time
LF = latest finish time
LS = latest start time
21.
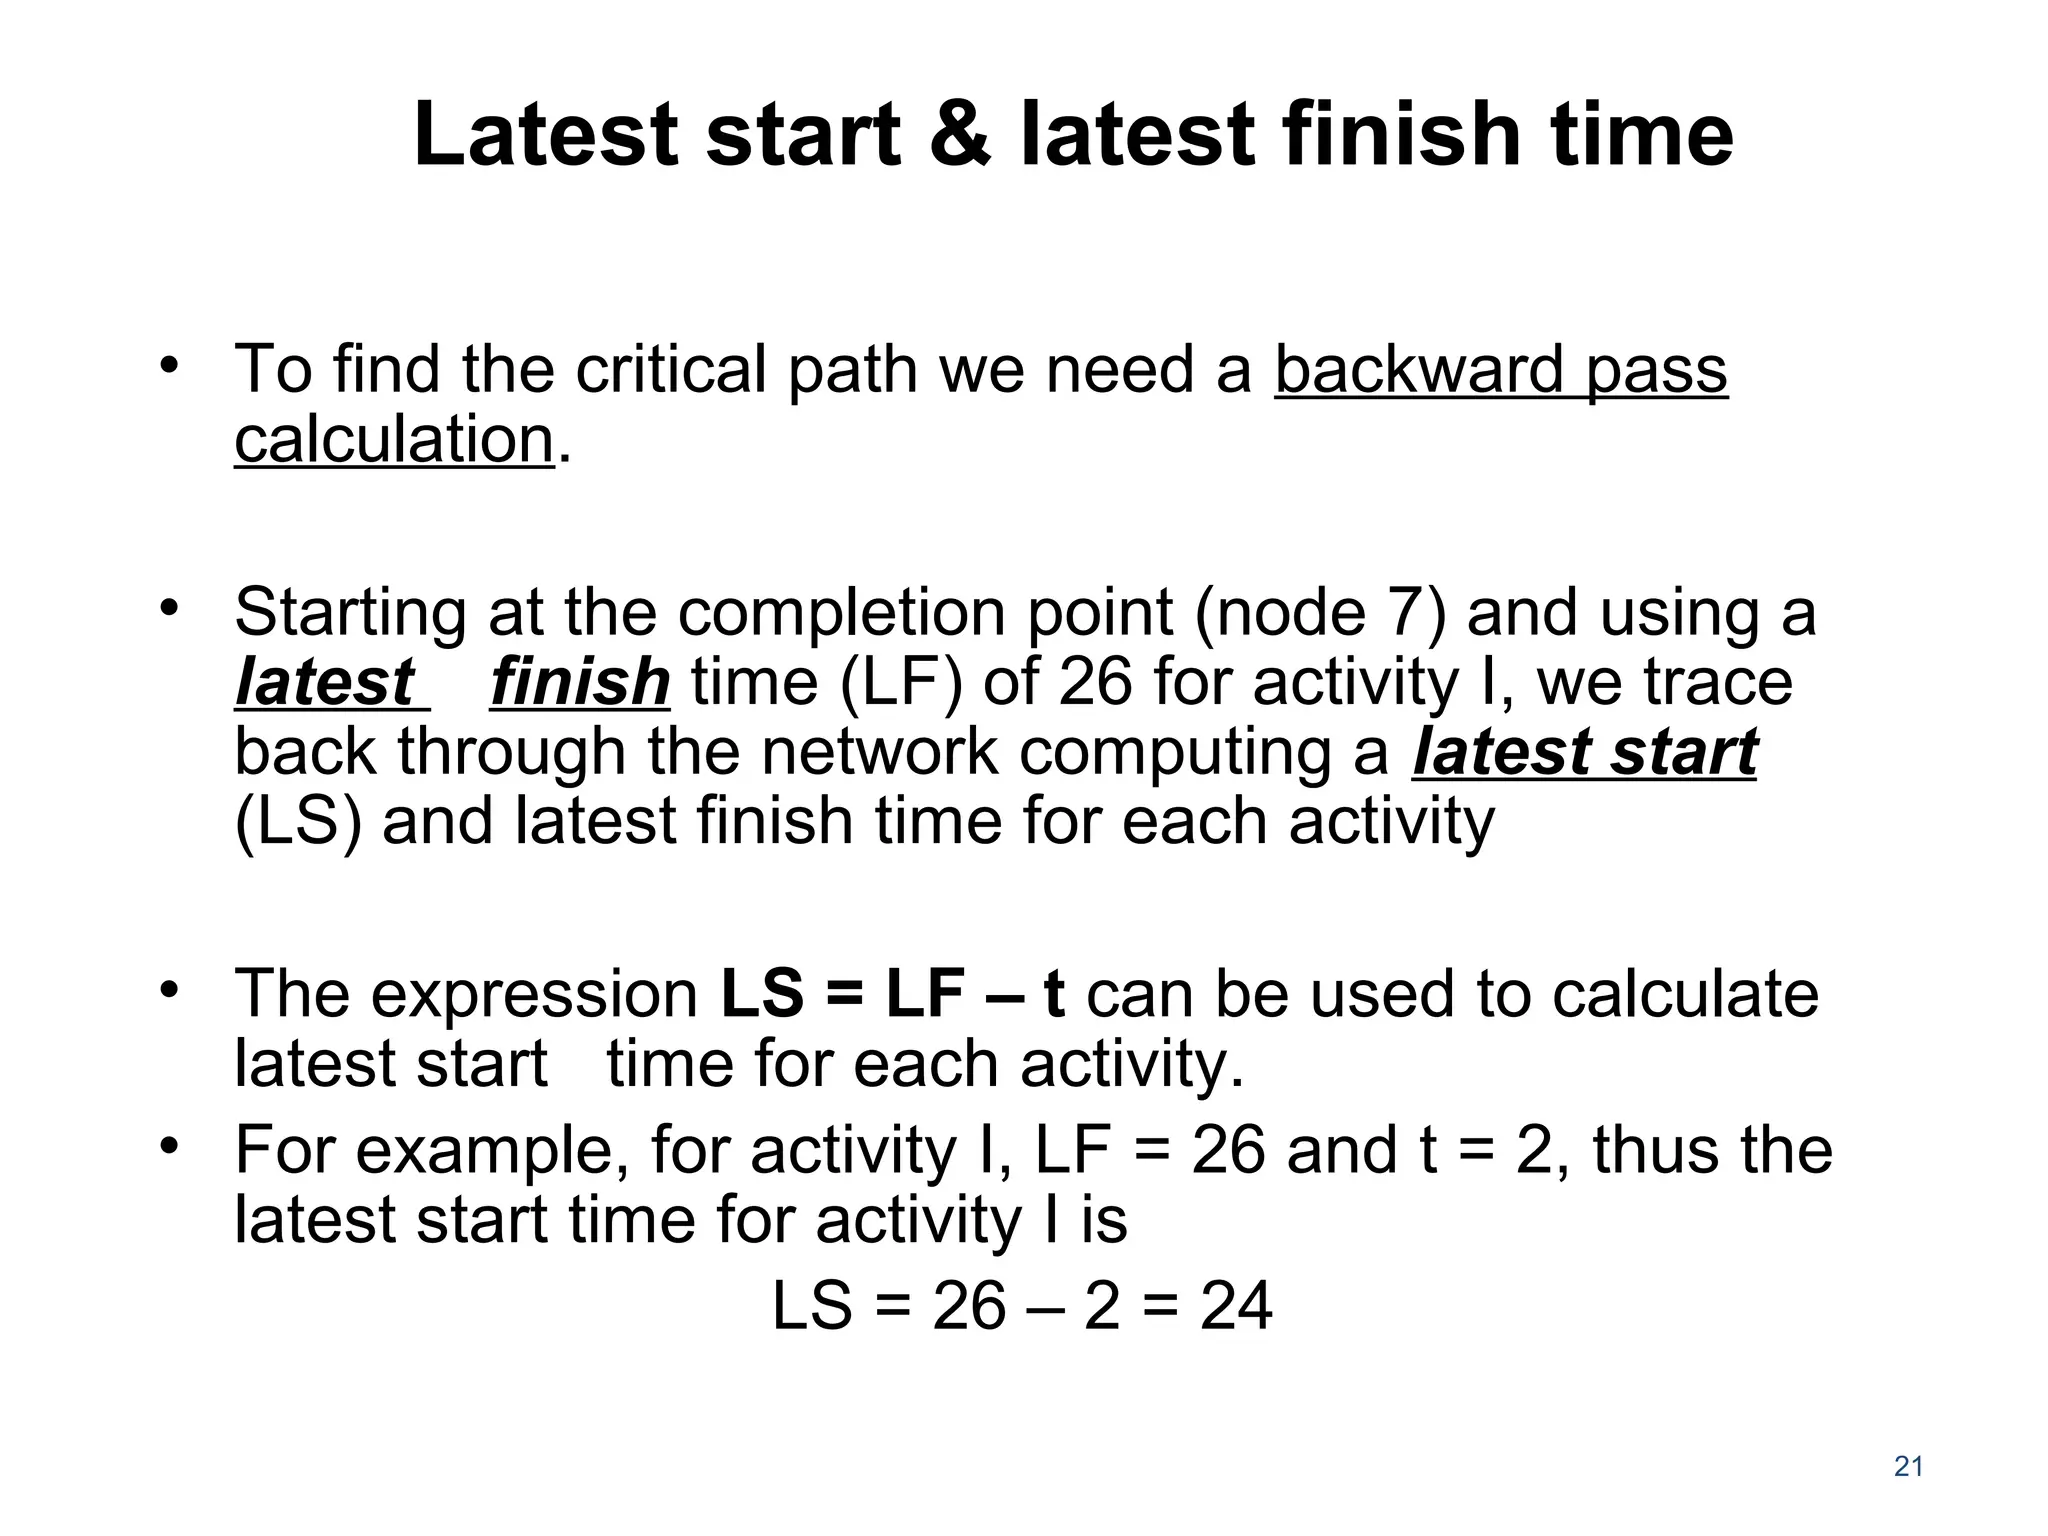
Latest start &latest finish time
• To find the critical path we need a backward pass
calculation.
• Starting at the completion point (node 7) and using a
latest finish time (LF) of 26 for activity I, we trace
back through the network computing a latest start
(LS) and latest finish time for each activity
• The expression LS = LF – t can be used to calculate
latest start time for each activity.
• For example, for activity I, LF = 26 and t = 2, thus the
latest start time for activity I is
LS = 26 – 2 = 24
21
22.
Network with LS& LF time
22
1
3
4
2
5
7
6
A[0,5]5[0,5]
B[0,6]6[6,12]
C[5,9]
4[8,12]
D[5,8]
3[7,10]
E[5,6]1[5,6]
F[6,10]
4[6,10]
G[10,24]
14[10,24]
H[9,21]
12[12,24]
I[24,26]
2[24,26]
Latest finish time rule:
The latest finish time for an activity entering a particular node is equal to
the smallest of the latest start times for all activities leaving the node.
23.
Slack or FreeTime or Float
Slack is the length of time an activity can be delayed without affecting the
completion date for the entire project.
For example, slack for C = 3 weeks, i.e Activity C can be delayed up to 3
weeks
(start anywhere between weeks 5 and 8).
23
ES
5
LS
8
EF
9
LF-EF = 12 –9 =3
LS-ES = 8 – 5 = 3
LF-ES-t = 12-5-4 = 3
LF
12
2
3
C [5,9]
4 [8,12]
24.
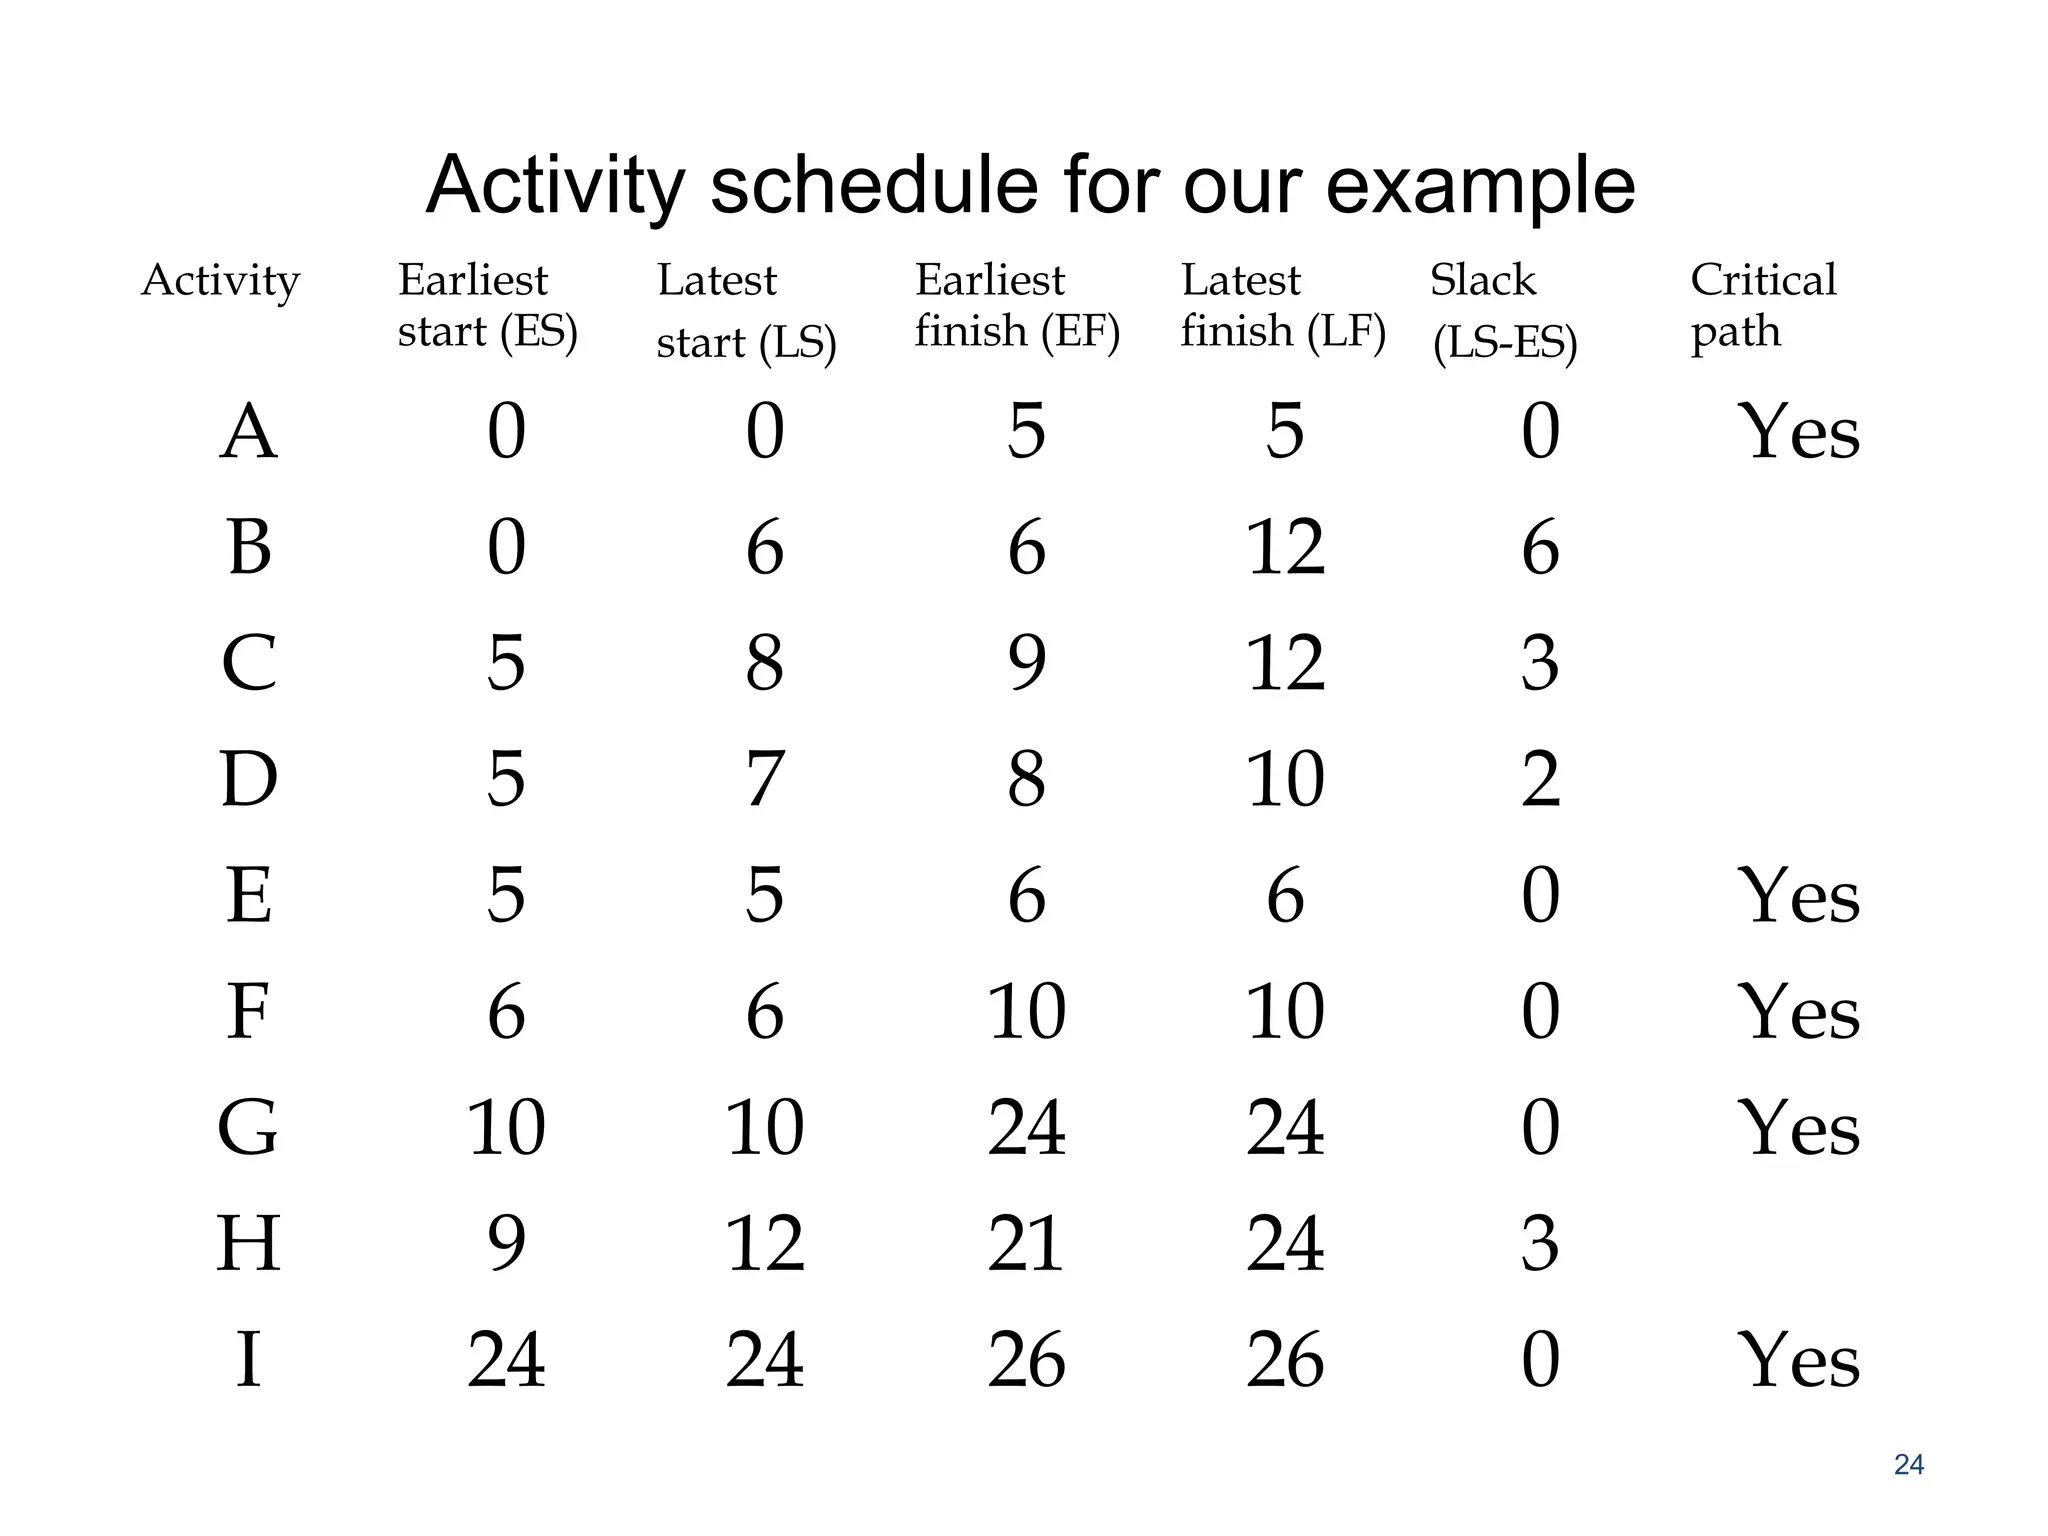
Activity schedule forour example
Activity Earliest
start (ES)
Latest
start (LS)
Earliest
finish (EF)
Latest
finish (LF)
Slack
(LS-ES)
Critical
path
A 0 0 5 5 0 Yes
B 0 6 6 12 6
C 5 8 9 12 3
D 5 7 8 10 2
E 5 5 6 6 0 Yes
F 6 6 10 10 0 Yes
G 10 10 24 24 0 Yes
H 9 12 21 24 3
I 24 24 26 26 0 Yes
24
25.
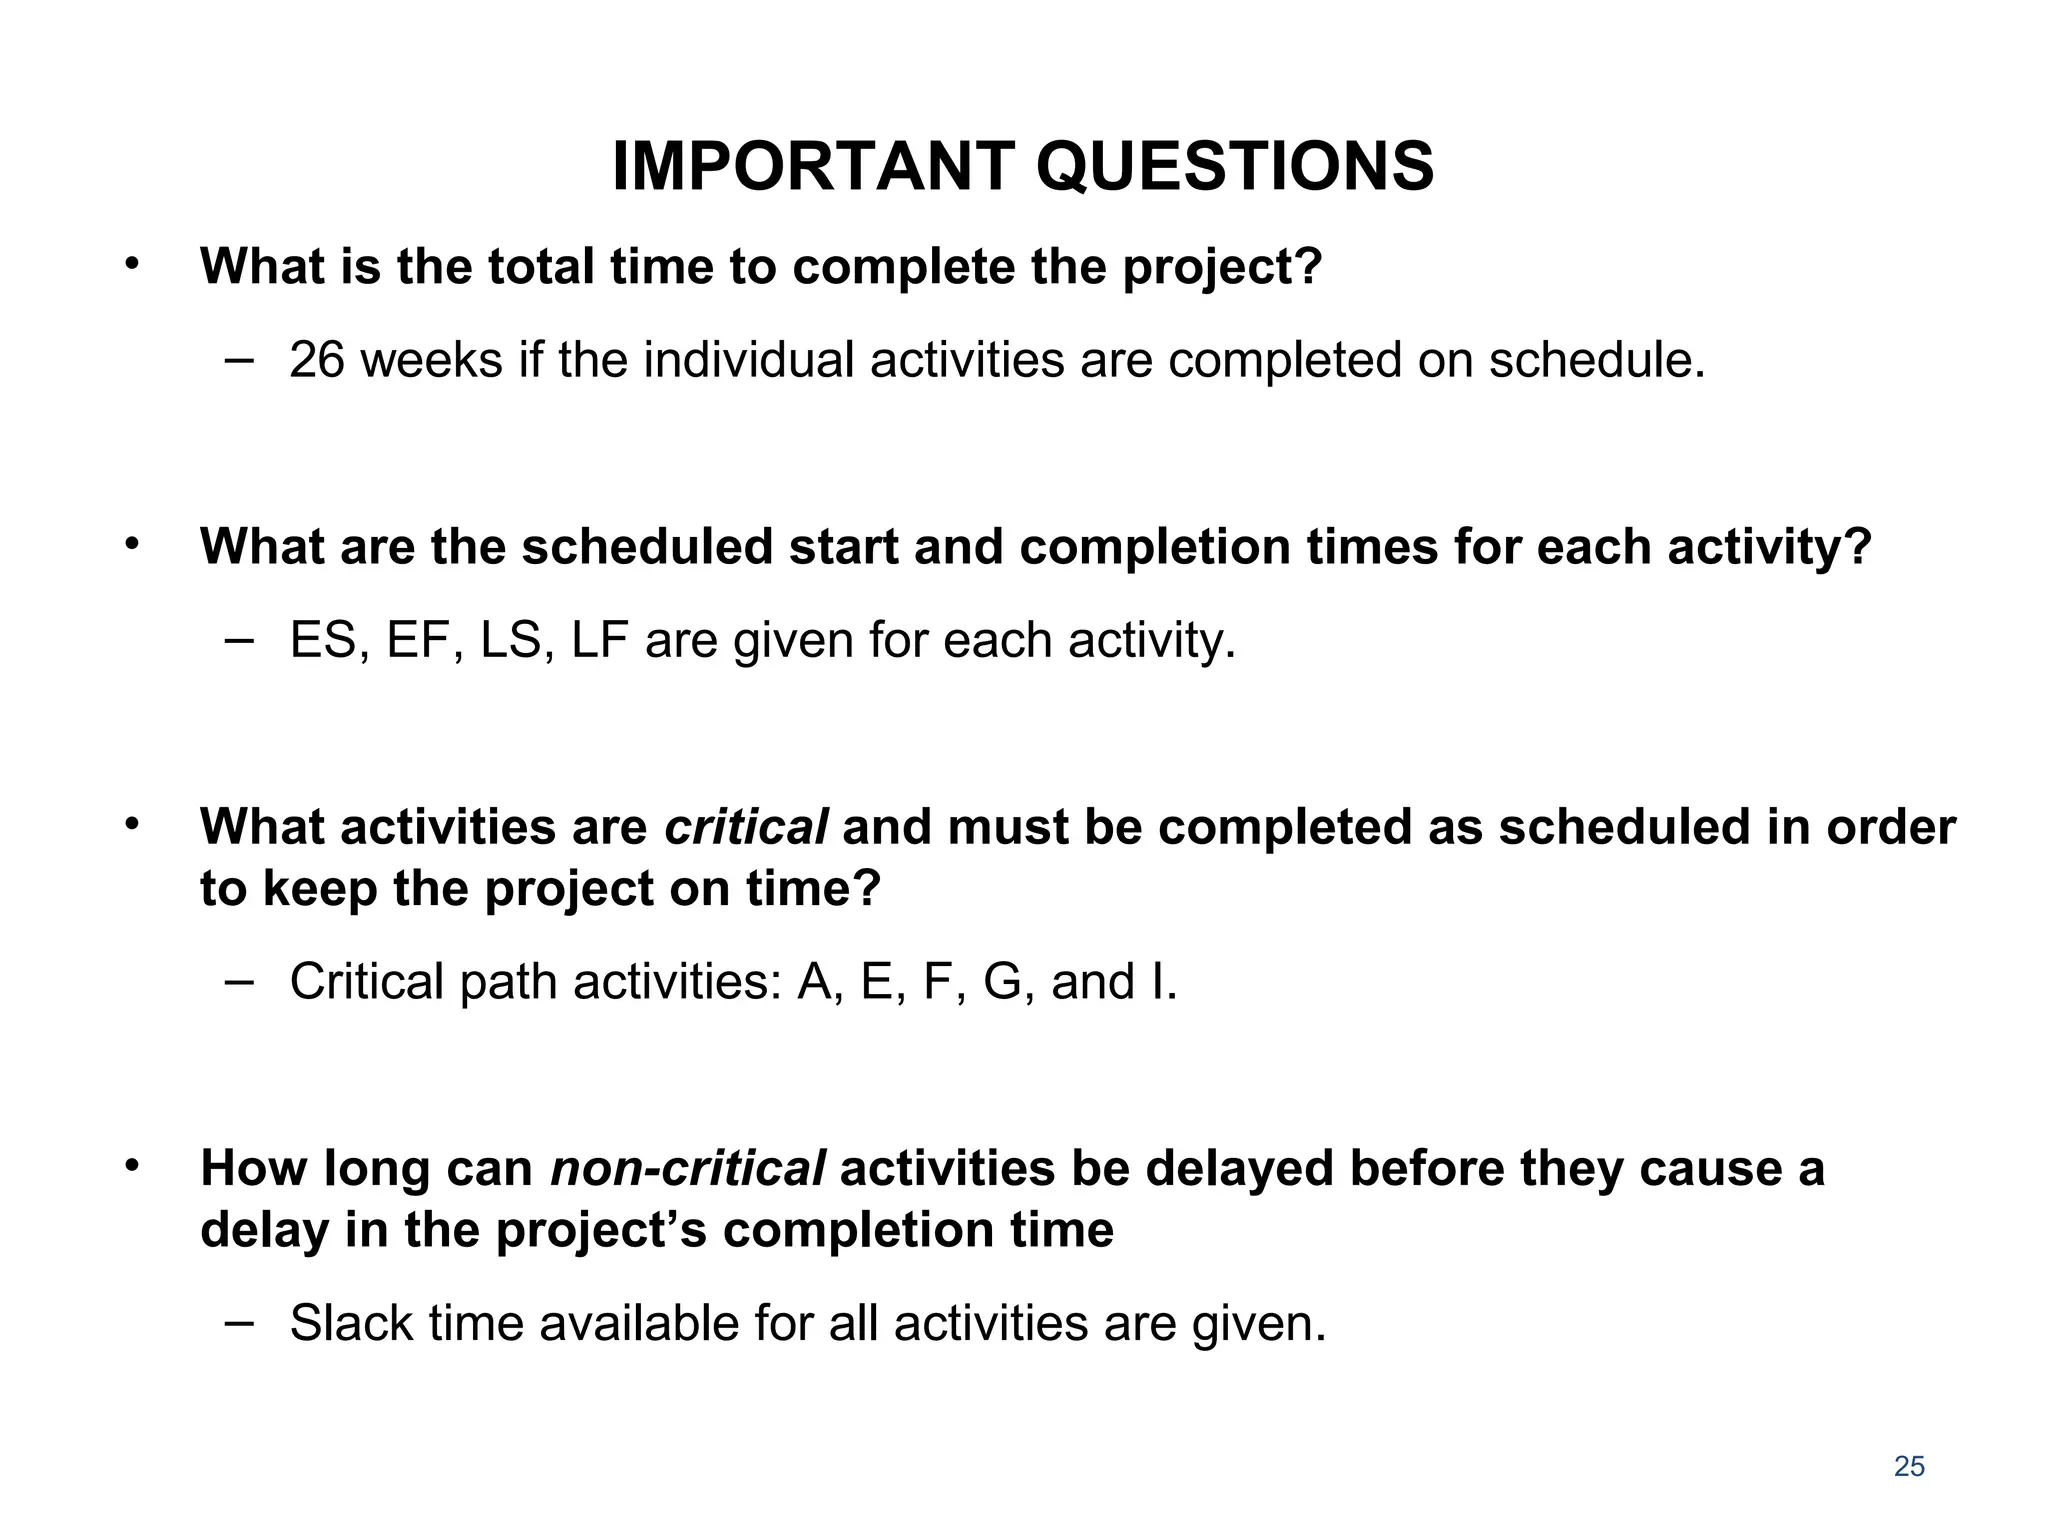
IMPORTANT QUESTIONS
• Whatis the total time to complete the project?
– 26 weeks if the individual activities are completed on schedule.
• What are the scheduled start and completion times for each activity?
– ES, EF, LS, LF are given for each activity.
• What activities are critical and must be completed as scheduled in order
to keep the project on time?
– Critical path activities: A, E, F, G, and I.
• How long can non-critical activities be delayed before they cause a
delay in the project’s completion time
– Slack time available for all activities are given.
25
26.
Importance of Float(Slack) and
Critical Path
1. Slack or Float shows how much allowance each activity
has, i.e how long it can be delayed without affecting
completion date of project
2. Critical path is a sequence of activities from start to
finish with zero slack. Critical activities are activities on
the critical path.
3. Critical path identifies the minimum time to complete
project
4. If any activity on the critical path is shortened or
extended, project time will be shortened or extended
accordingly
26
27.
Importance of Float(Slack) and Critical Path (cont)
5. So, a lot of effort should be put in trying to control activities along
this path, so that project can meet due date. If any activity is
lengthened, be aware that project will not meet deadline and some
action needs to be taken.
6. If you can spend resources to speed up some activity, do so only for
critical activities.
7. Don’t waste resources on non-critical activity, it will not shorten the
project time.
8. If resources can be saved by lengthening some activities, do so for
non-critical activities, up to limit of float.
9. Total Float belongs to the path
27
28.
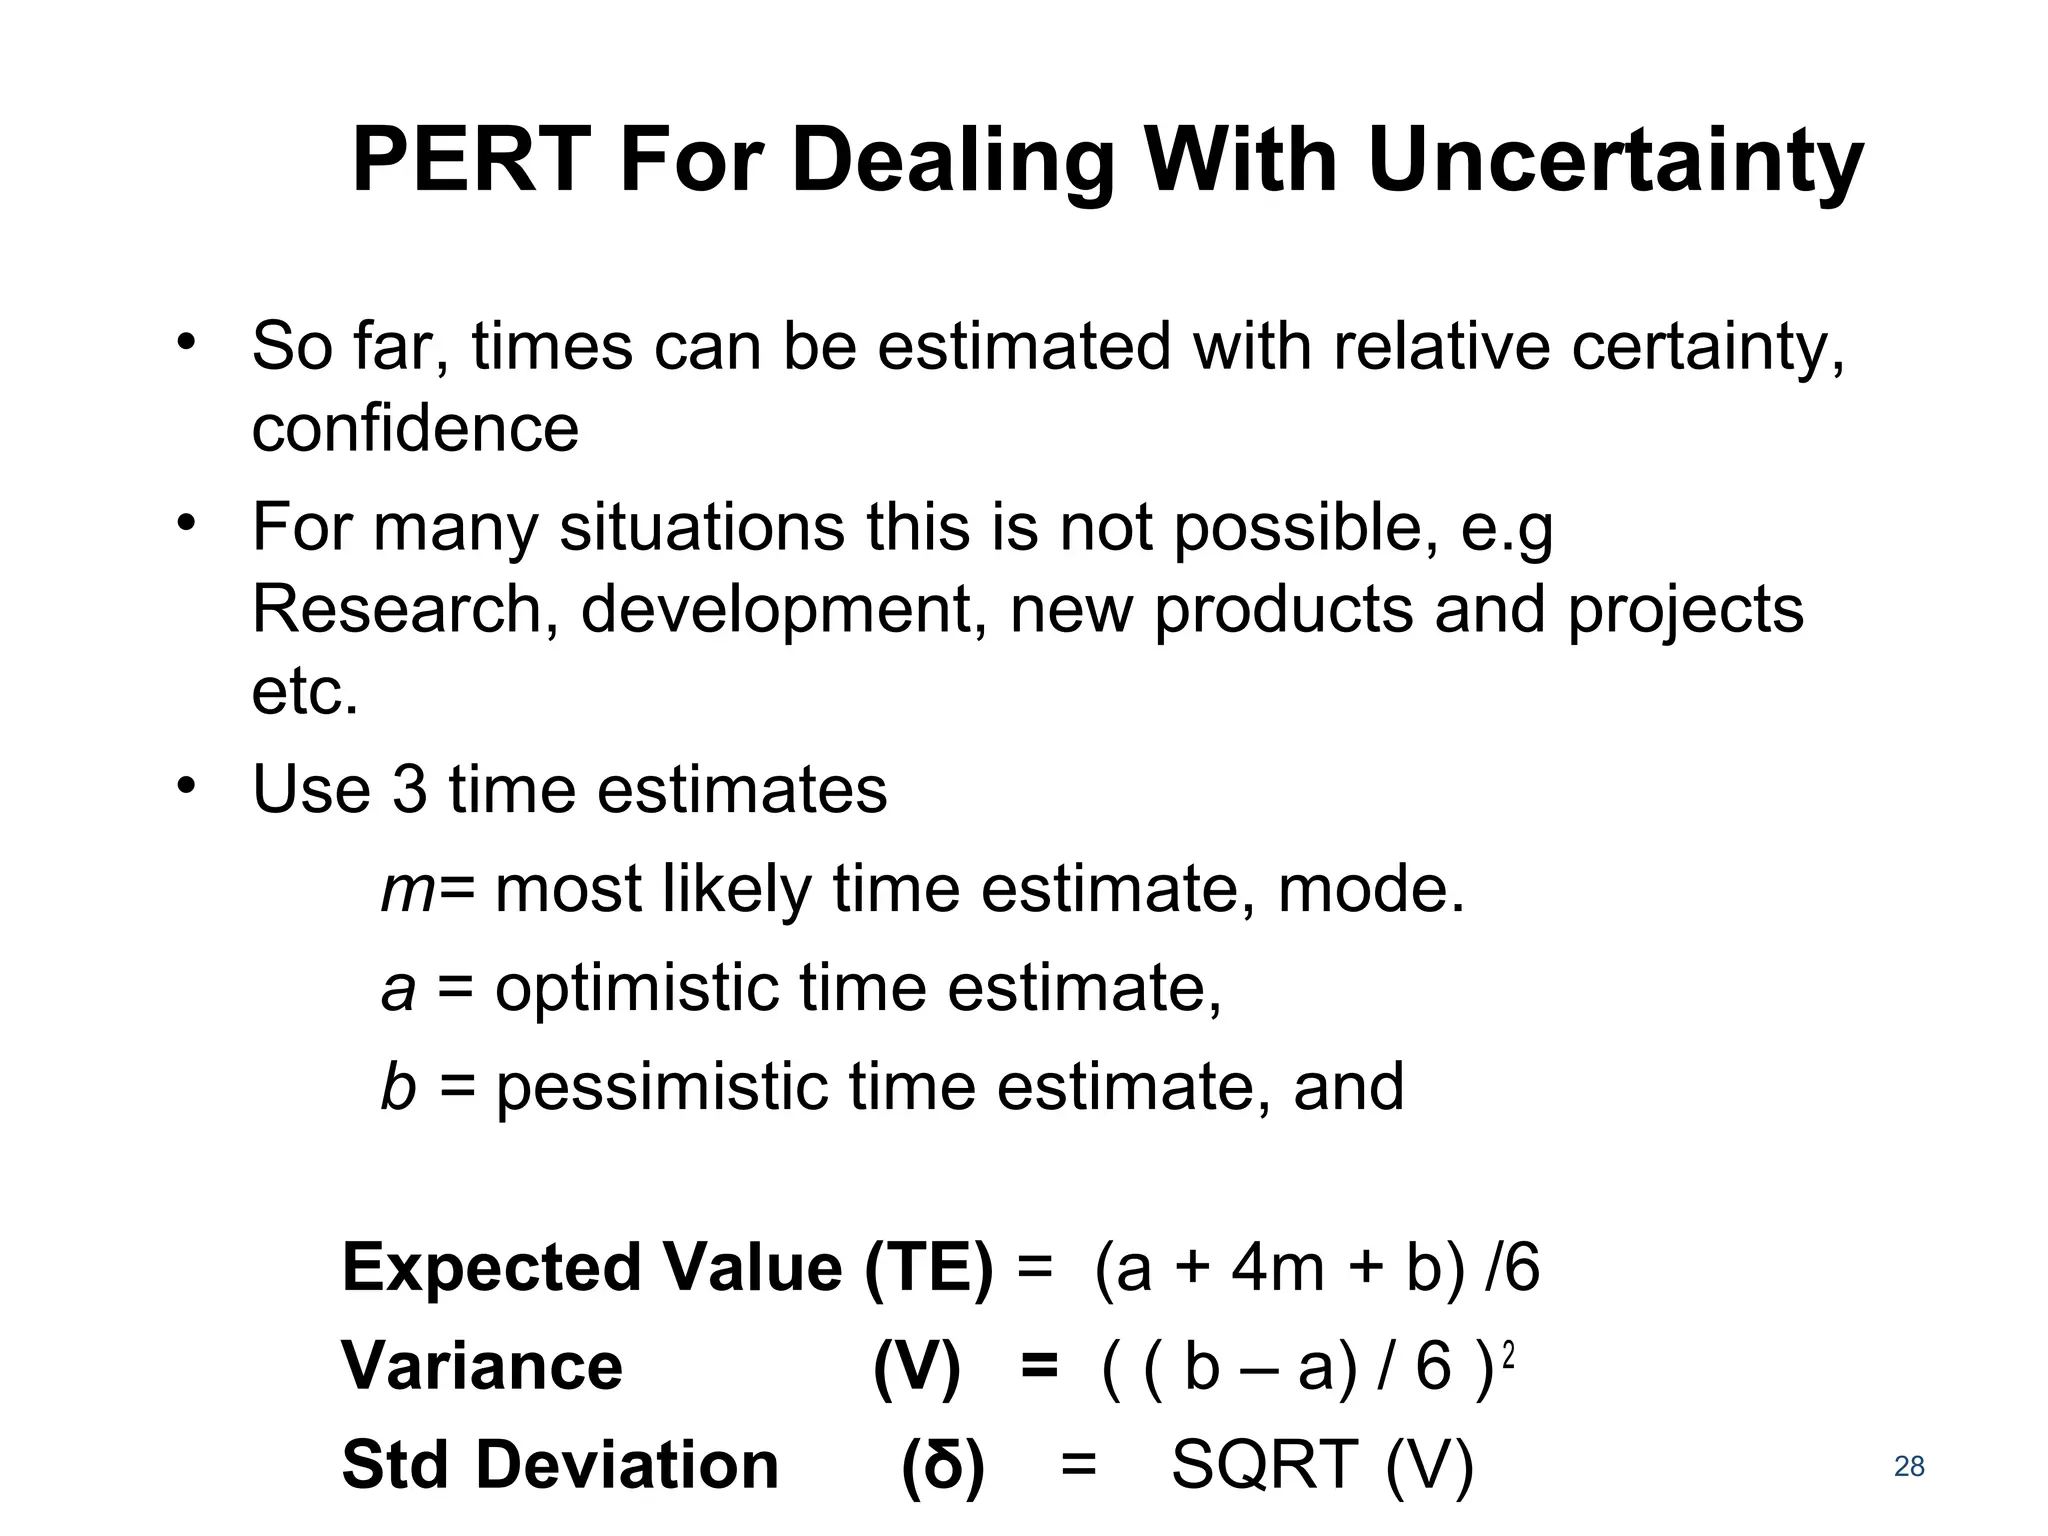
PERT For DealingWith Uncertainty
• So far, times can be estimated with relative certainty,
confidence
• For many situations this is not possible, e.g
Research, development, new products and projects
etc.
• Use 3 time estimates
m= most likely time estimate, mode.
a = optimistic time estimate,
b = pessimistic time estimate, and
Expected Value (TE) = (a + 4m + b) /6
Variance (V) = ( ( b – a) / 6 )2
Std Deviation (δ) = SQRT (V) 28
29.
29
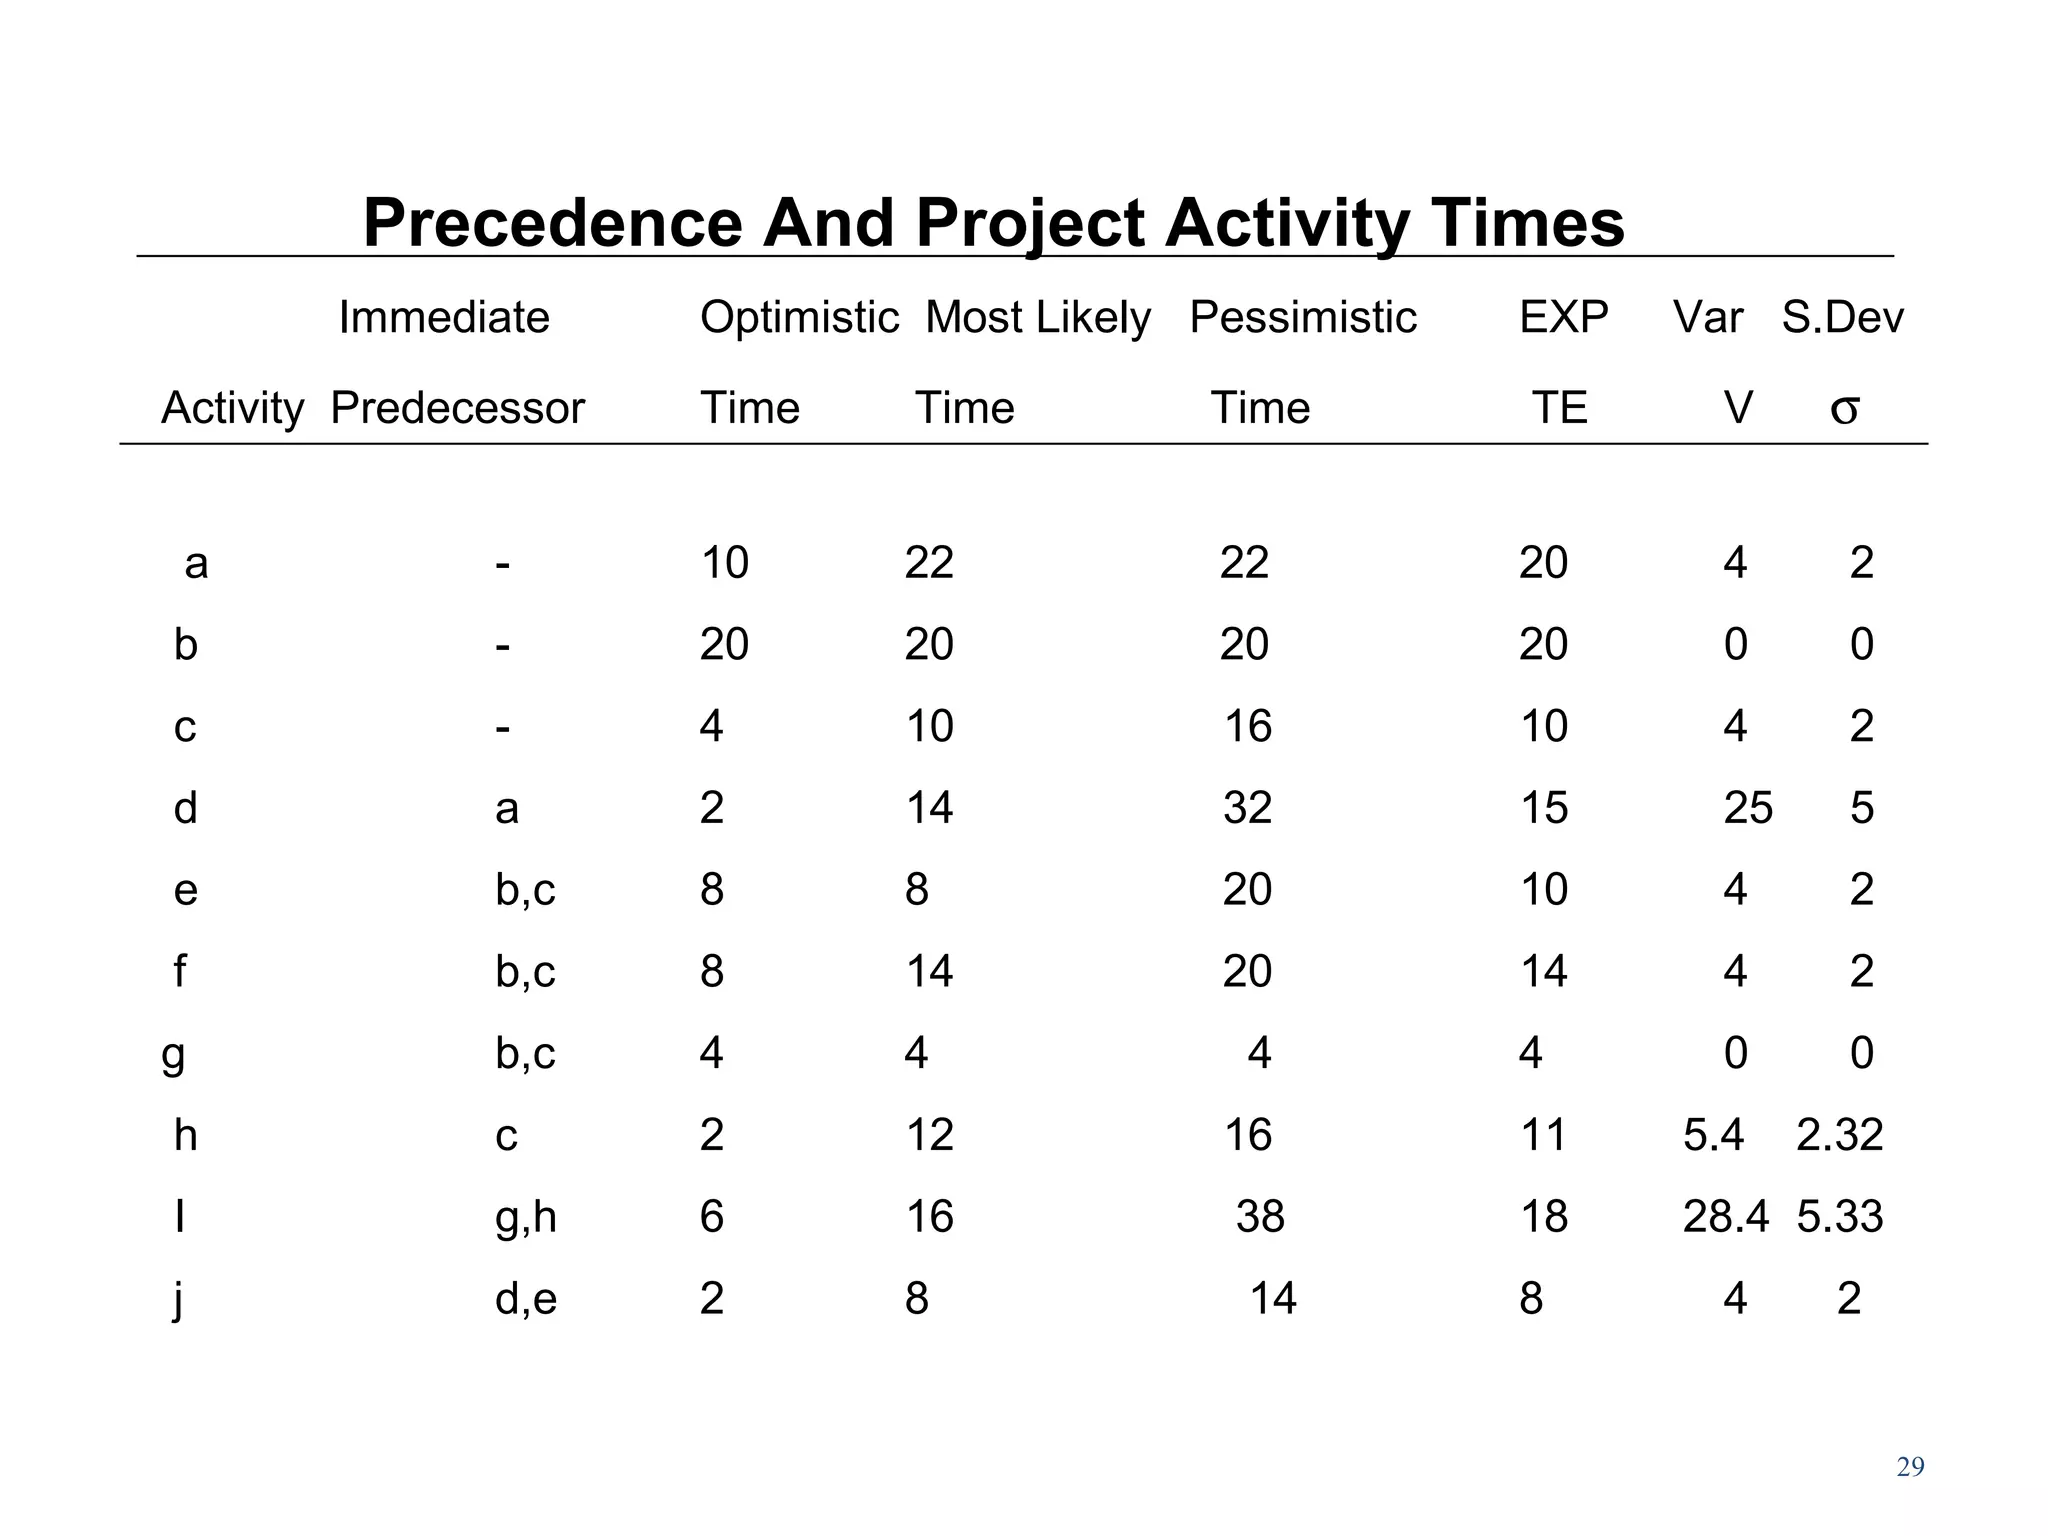
Precedence And ProjectActivity Times
Immediate Optimistic Most Likely Pessimistic EXP Var S.Dev
Activity Predecessor Time Time Time TE V σ
a - 10 22 22 20 4 2
b - 20 20 20 20 0 0
c - 4 10 16 10 4 2
d a 2 14 32 15 25 5
e b,c 8 8 20 10 4 2
f b,c 8 14 20 14 4 2
g b,c 4 4 4 4 0 0
h c 2 12 16 11 5.4 2.32
I g,h 6 16 38 18 28.4 5.33
j d,e 2 8 14 8 4 2
30.
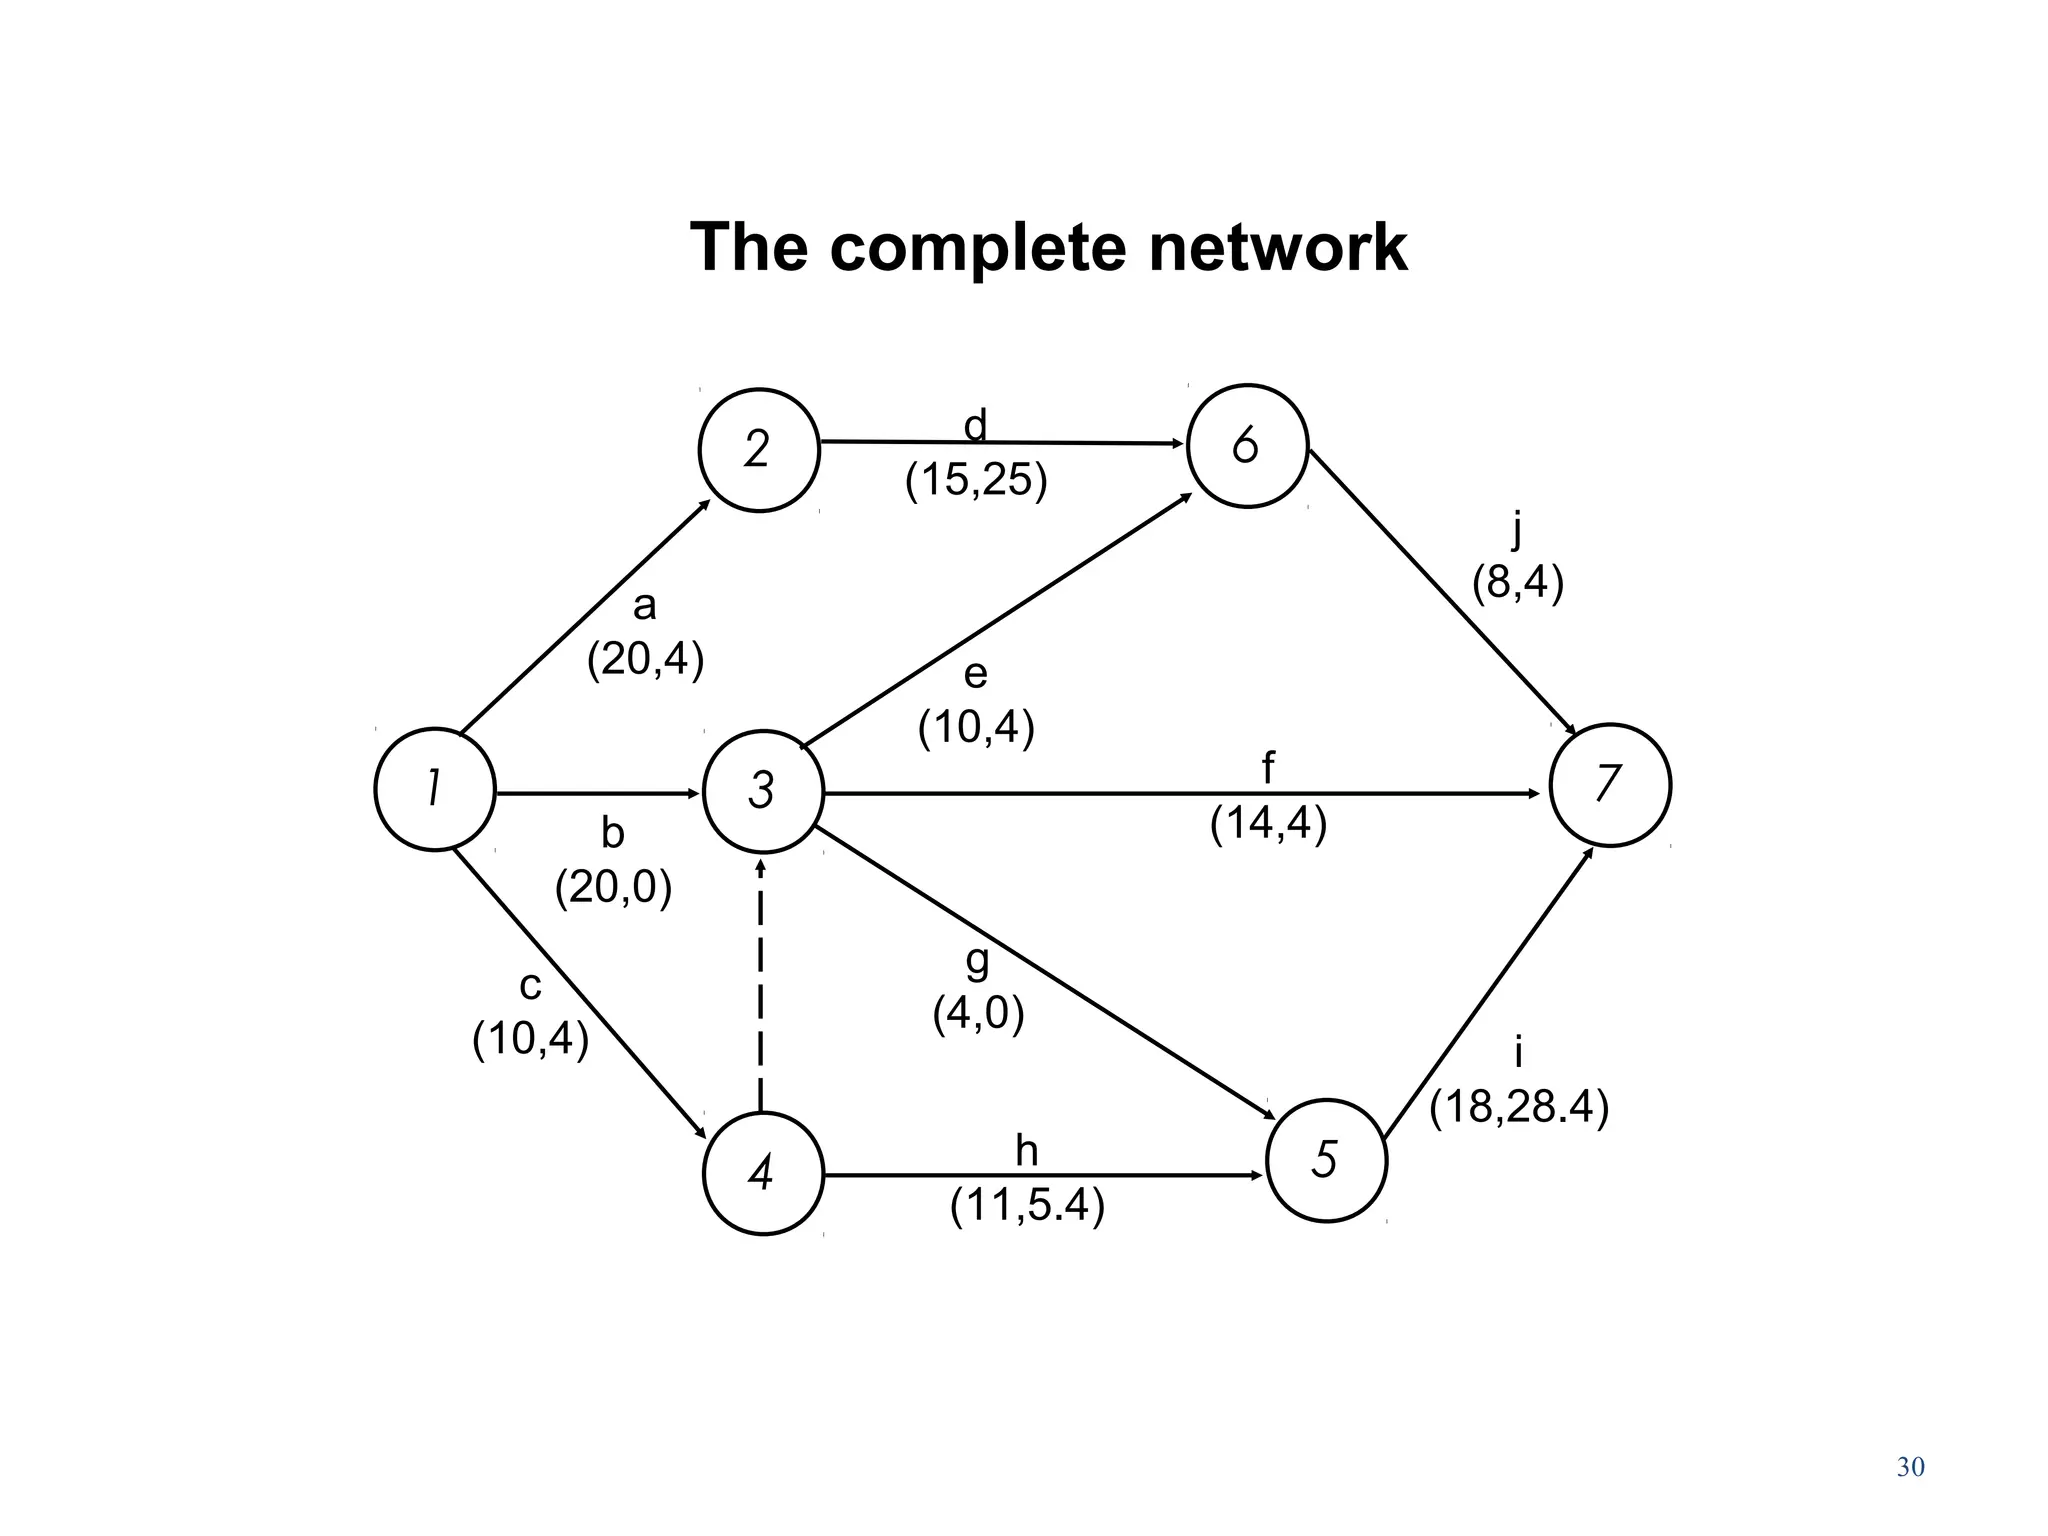
30
The complete network
26
1 3 7
4 5
a
(20,4)
d
(15,25)
e
(10,4)
f
(14,4)
j
(8,4)
i
(18,28.4)
g
(4,0)
h
(11,5.4)
c
(10,4)
b
(20,0)
31.
31
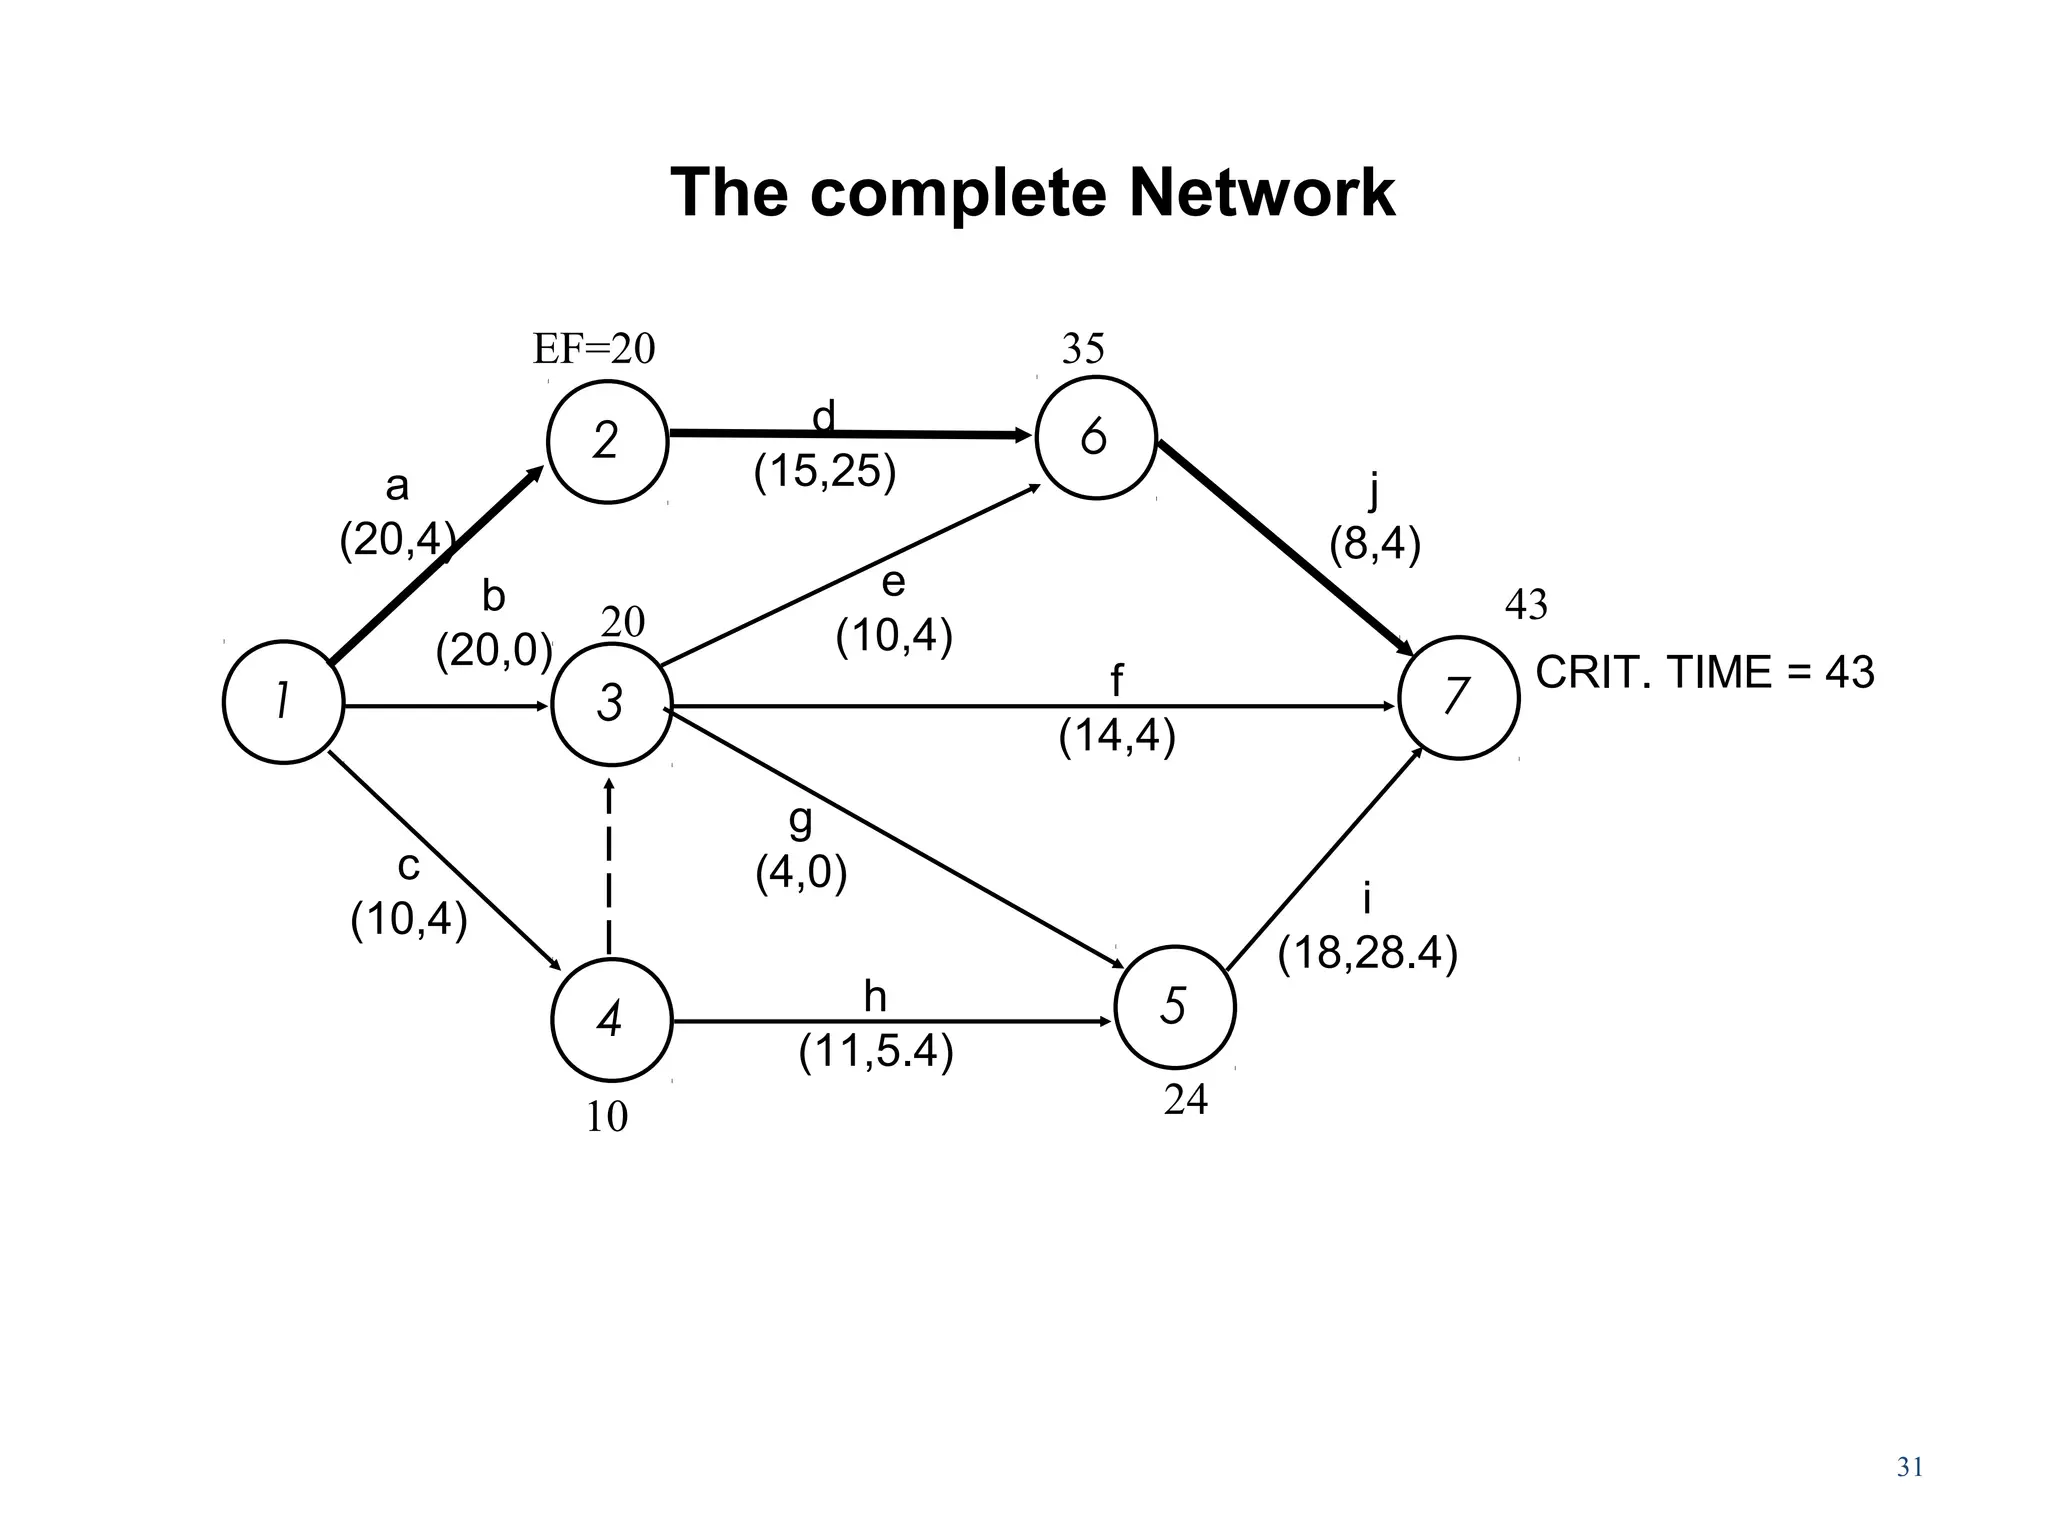
The complete Network
26
1 3 7
4 5
b
(20,0)
d
(15,25)
e
(10,4)
f
(14,4)
j
(8,4)
i
(18,28.4)
g
(4,0)
h
(11,5.4)
c
(10,4)
CRIT. TIME = 43
EF=20 35
43
2410
20
a
(20,4)
32.
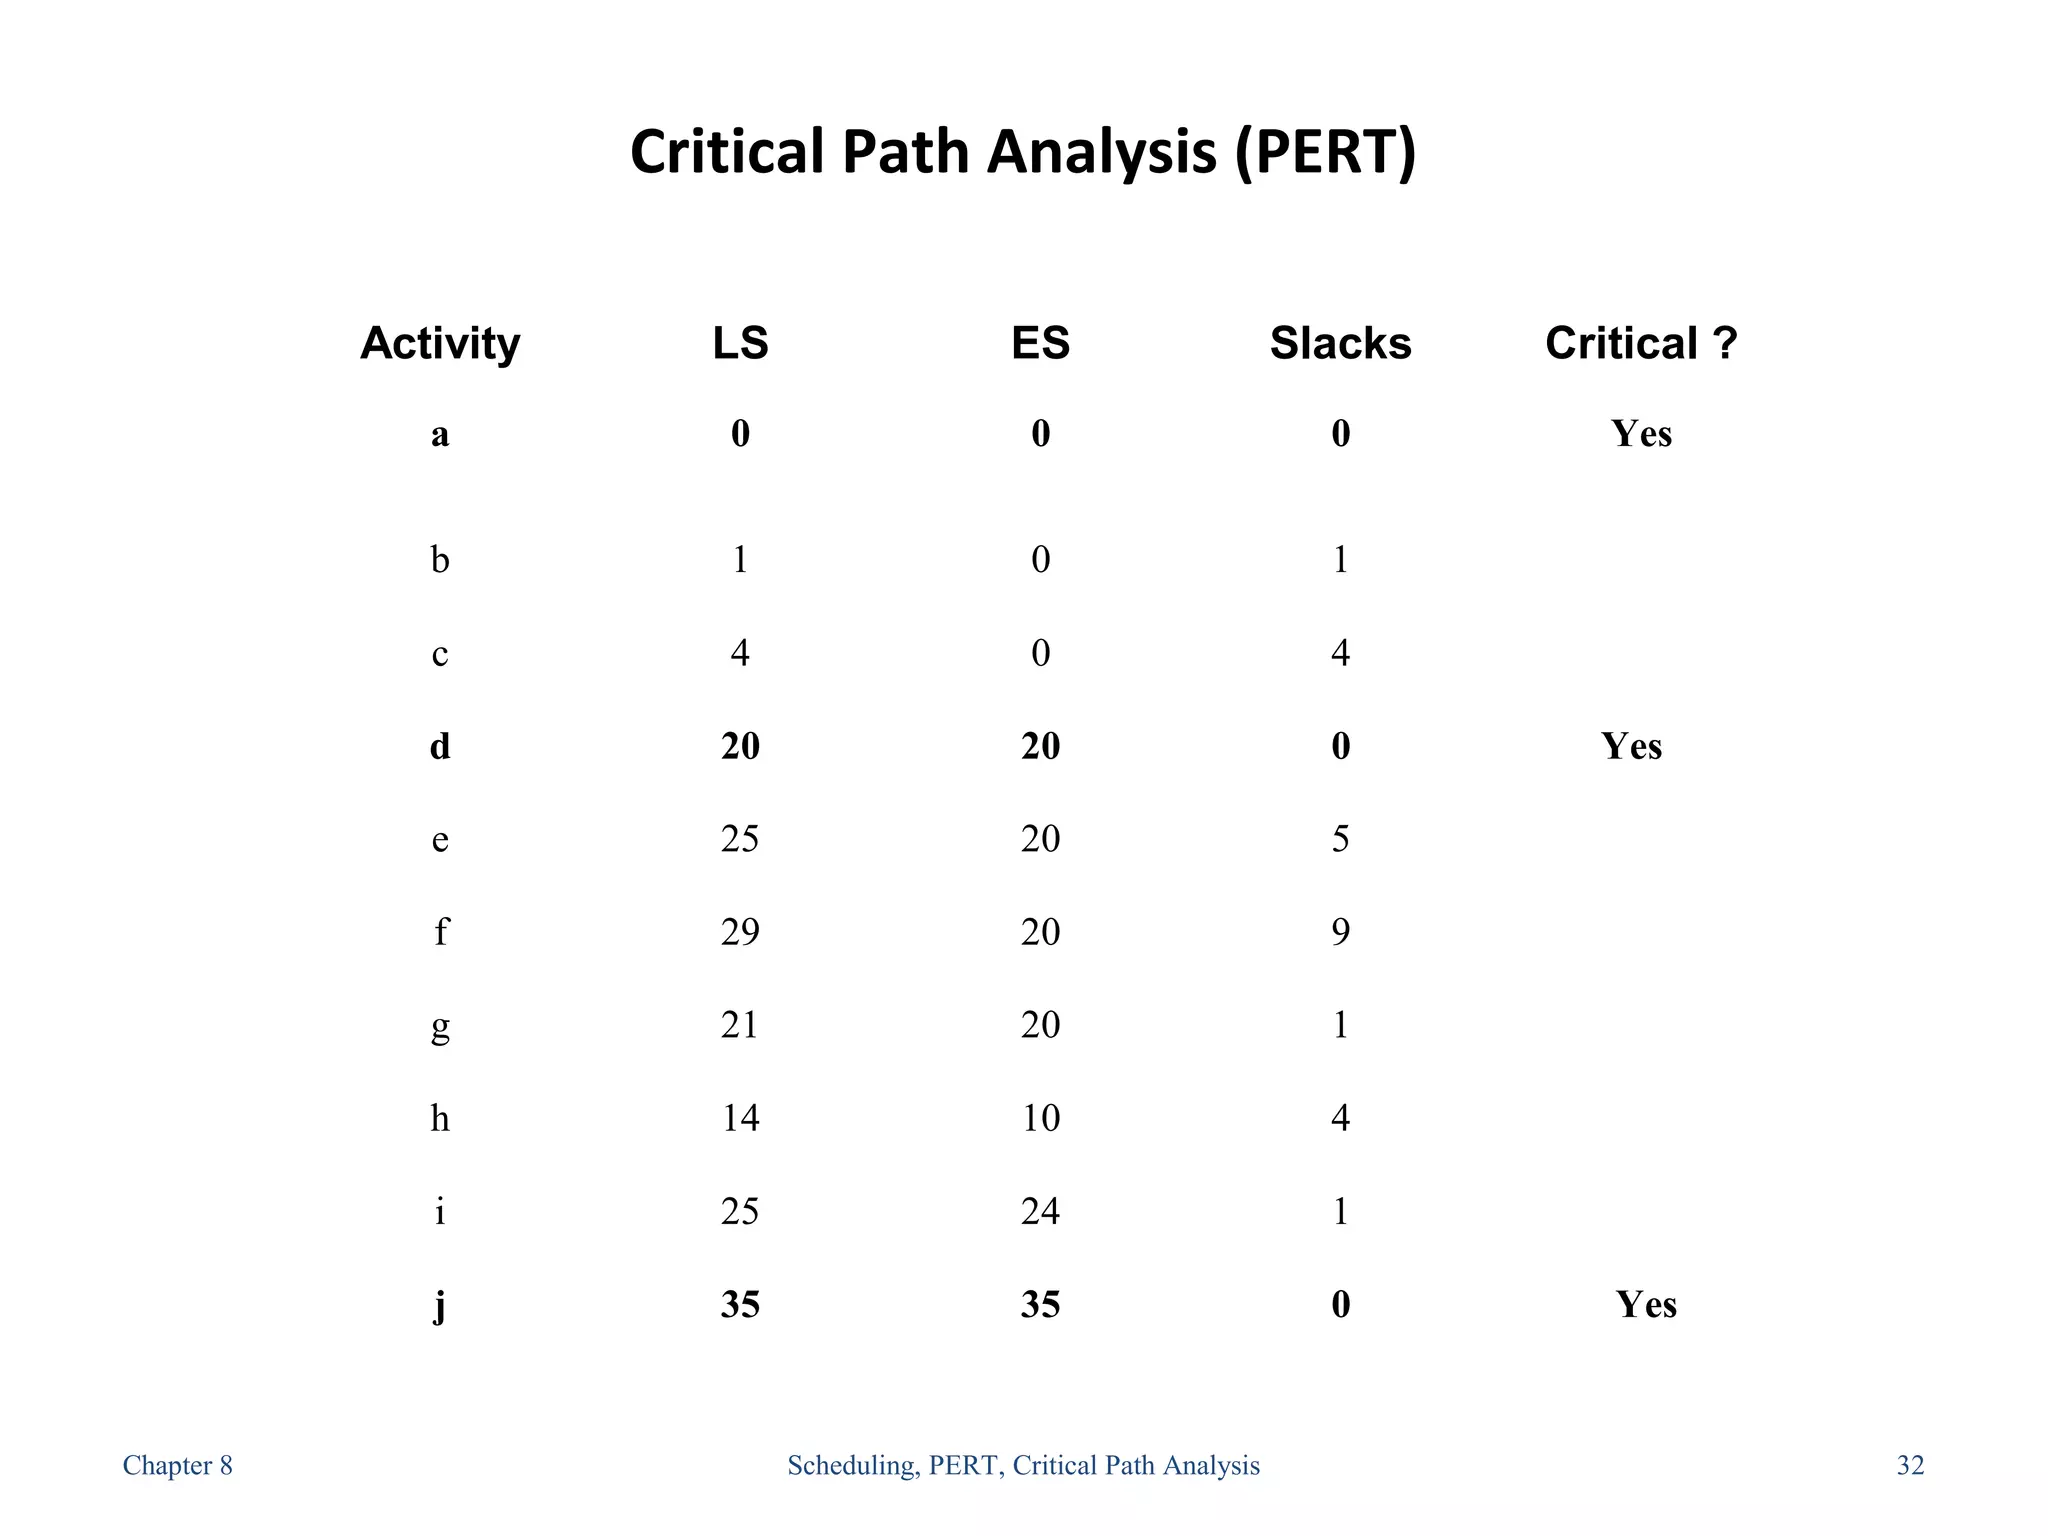
Critical Path Analysis(PERT)
Activity LS ES Slacks Critical ?
a 0 0 0 Yes
b 1 0 1
c 4 0 4
d 20 20 0 Yes
e 25 20 5
f 29 20 9
g 21 20 1
h 14 10 4
i 25 24 1
j 35 35 0 Yes
Chapter 8 Scheduling, PERT, Critical Path Analysis 32
33.
33
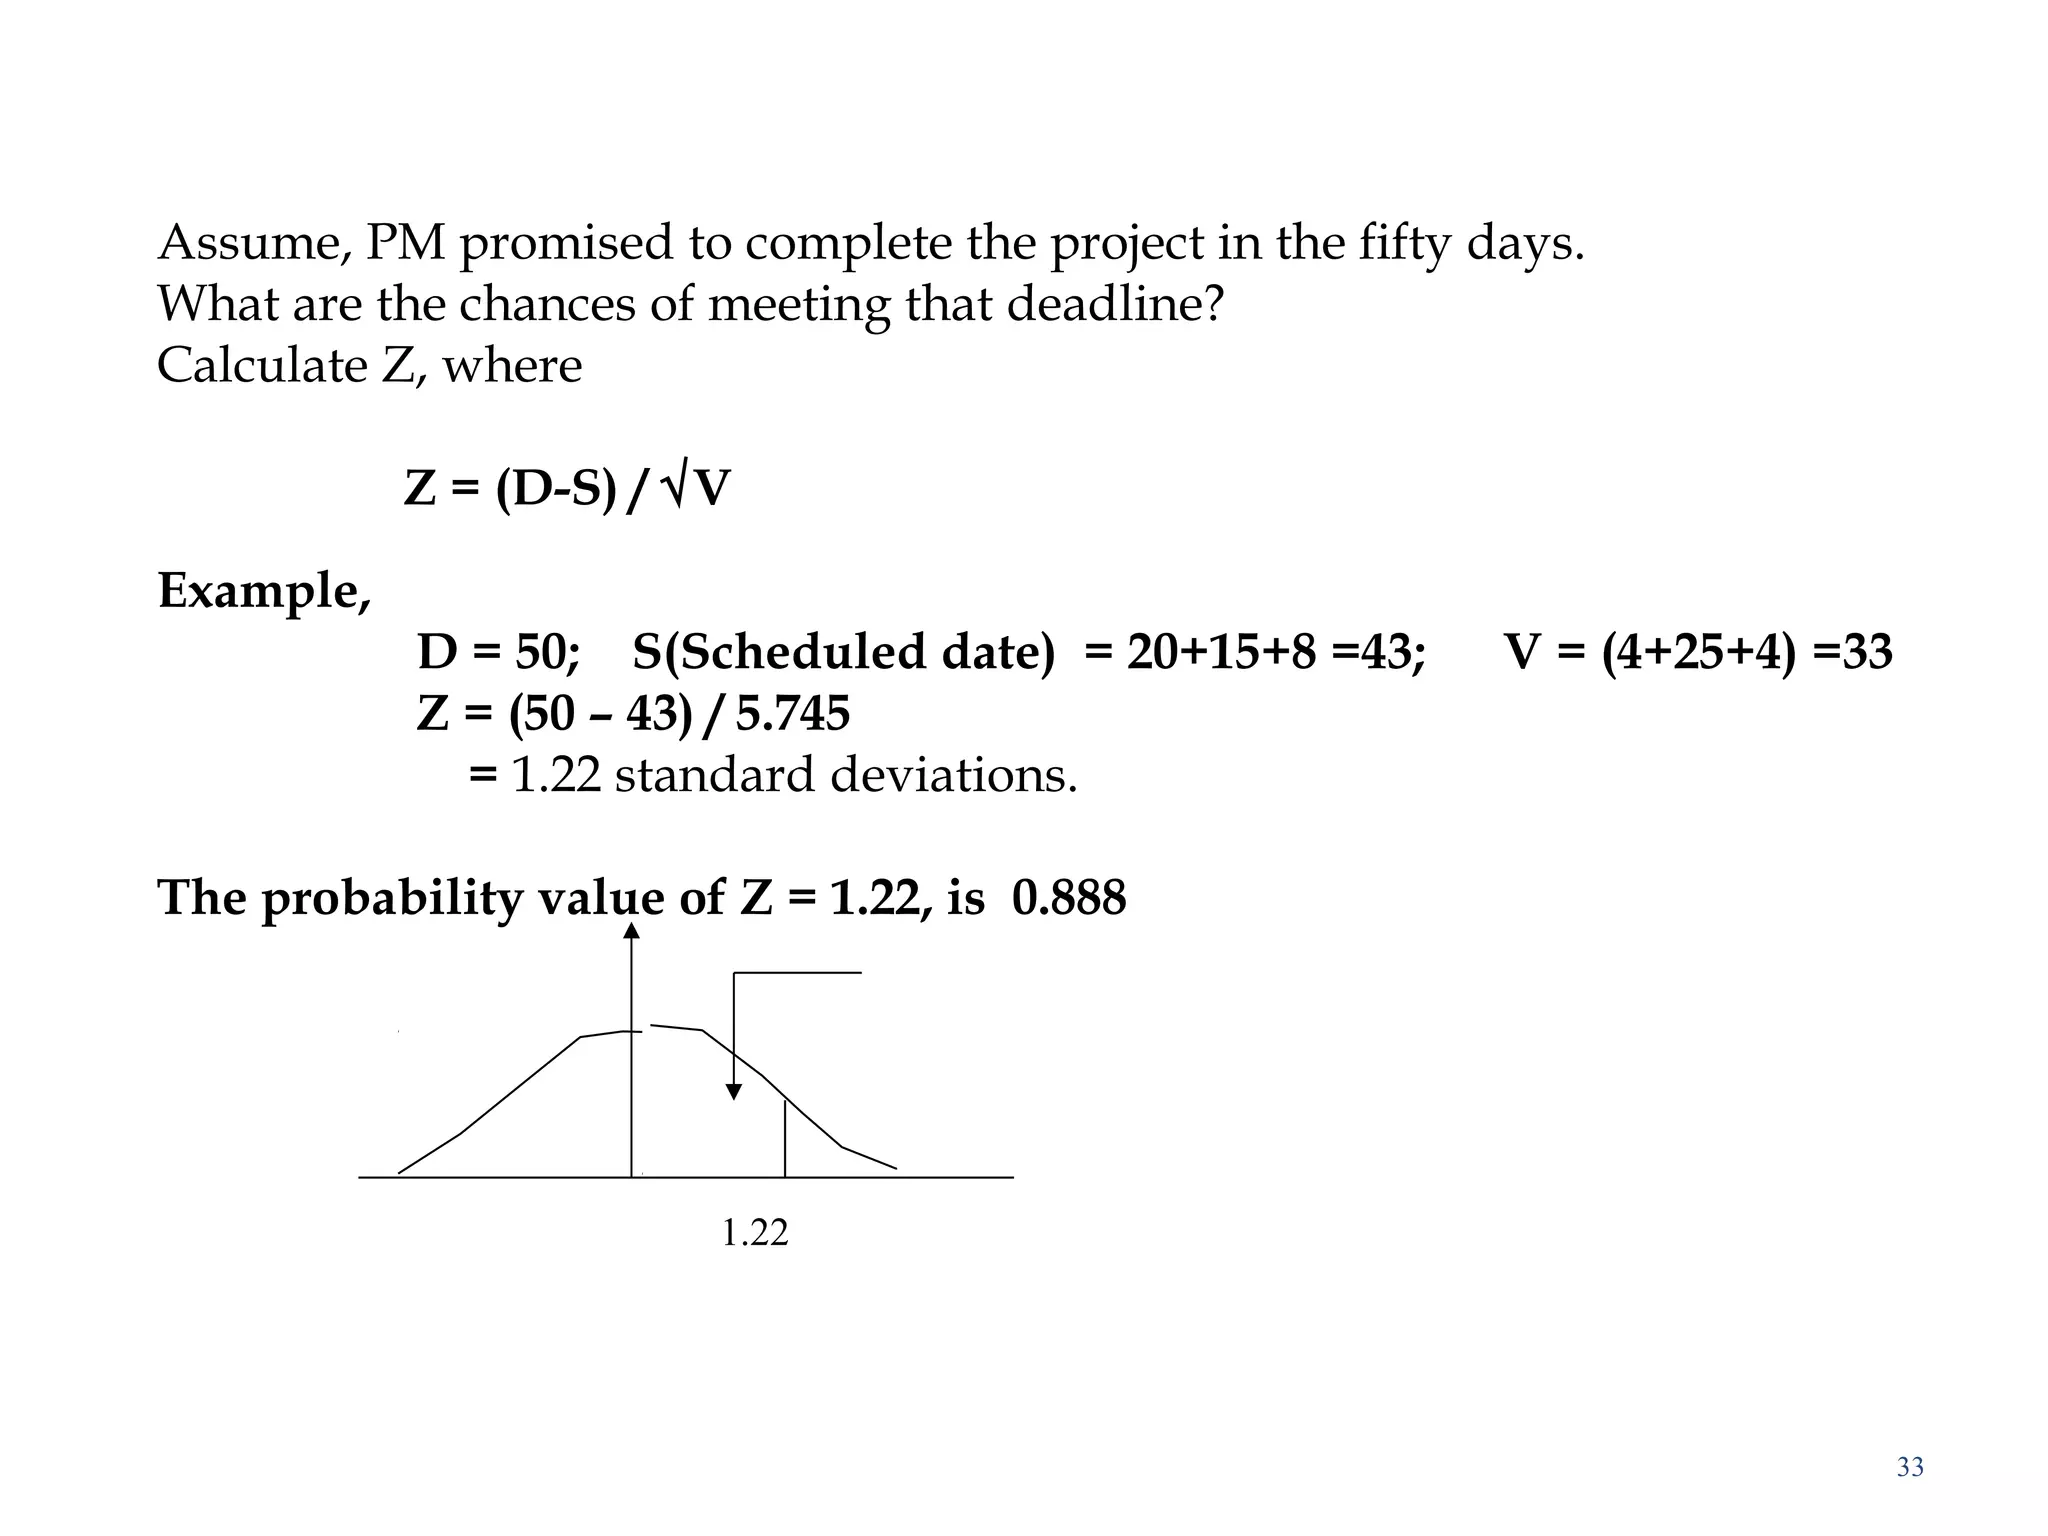
Assume, PM promisedto complete the project in the fifty days.
What are the chances of meeting that deadline?
Calculate Z, where
Z = (D-S) / √V
Example,
D = 50; S(Scheduled date) = 20+15+8 =43; V = (4+25+4) =33
Z = (50 – 43) / 5.745
= 1.22 standard deviations.
The probability value of Z = 1.22, is 0.888
1.22
34.
34
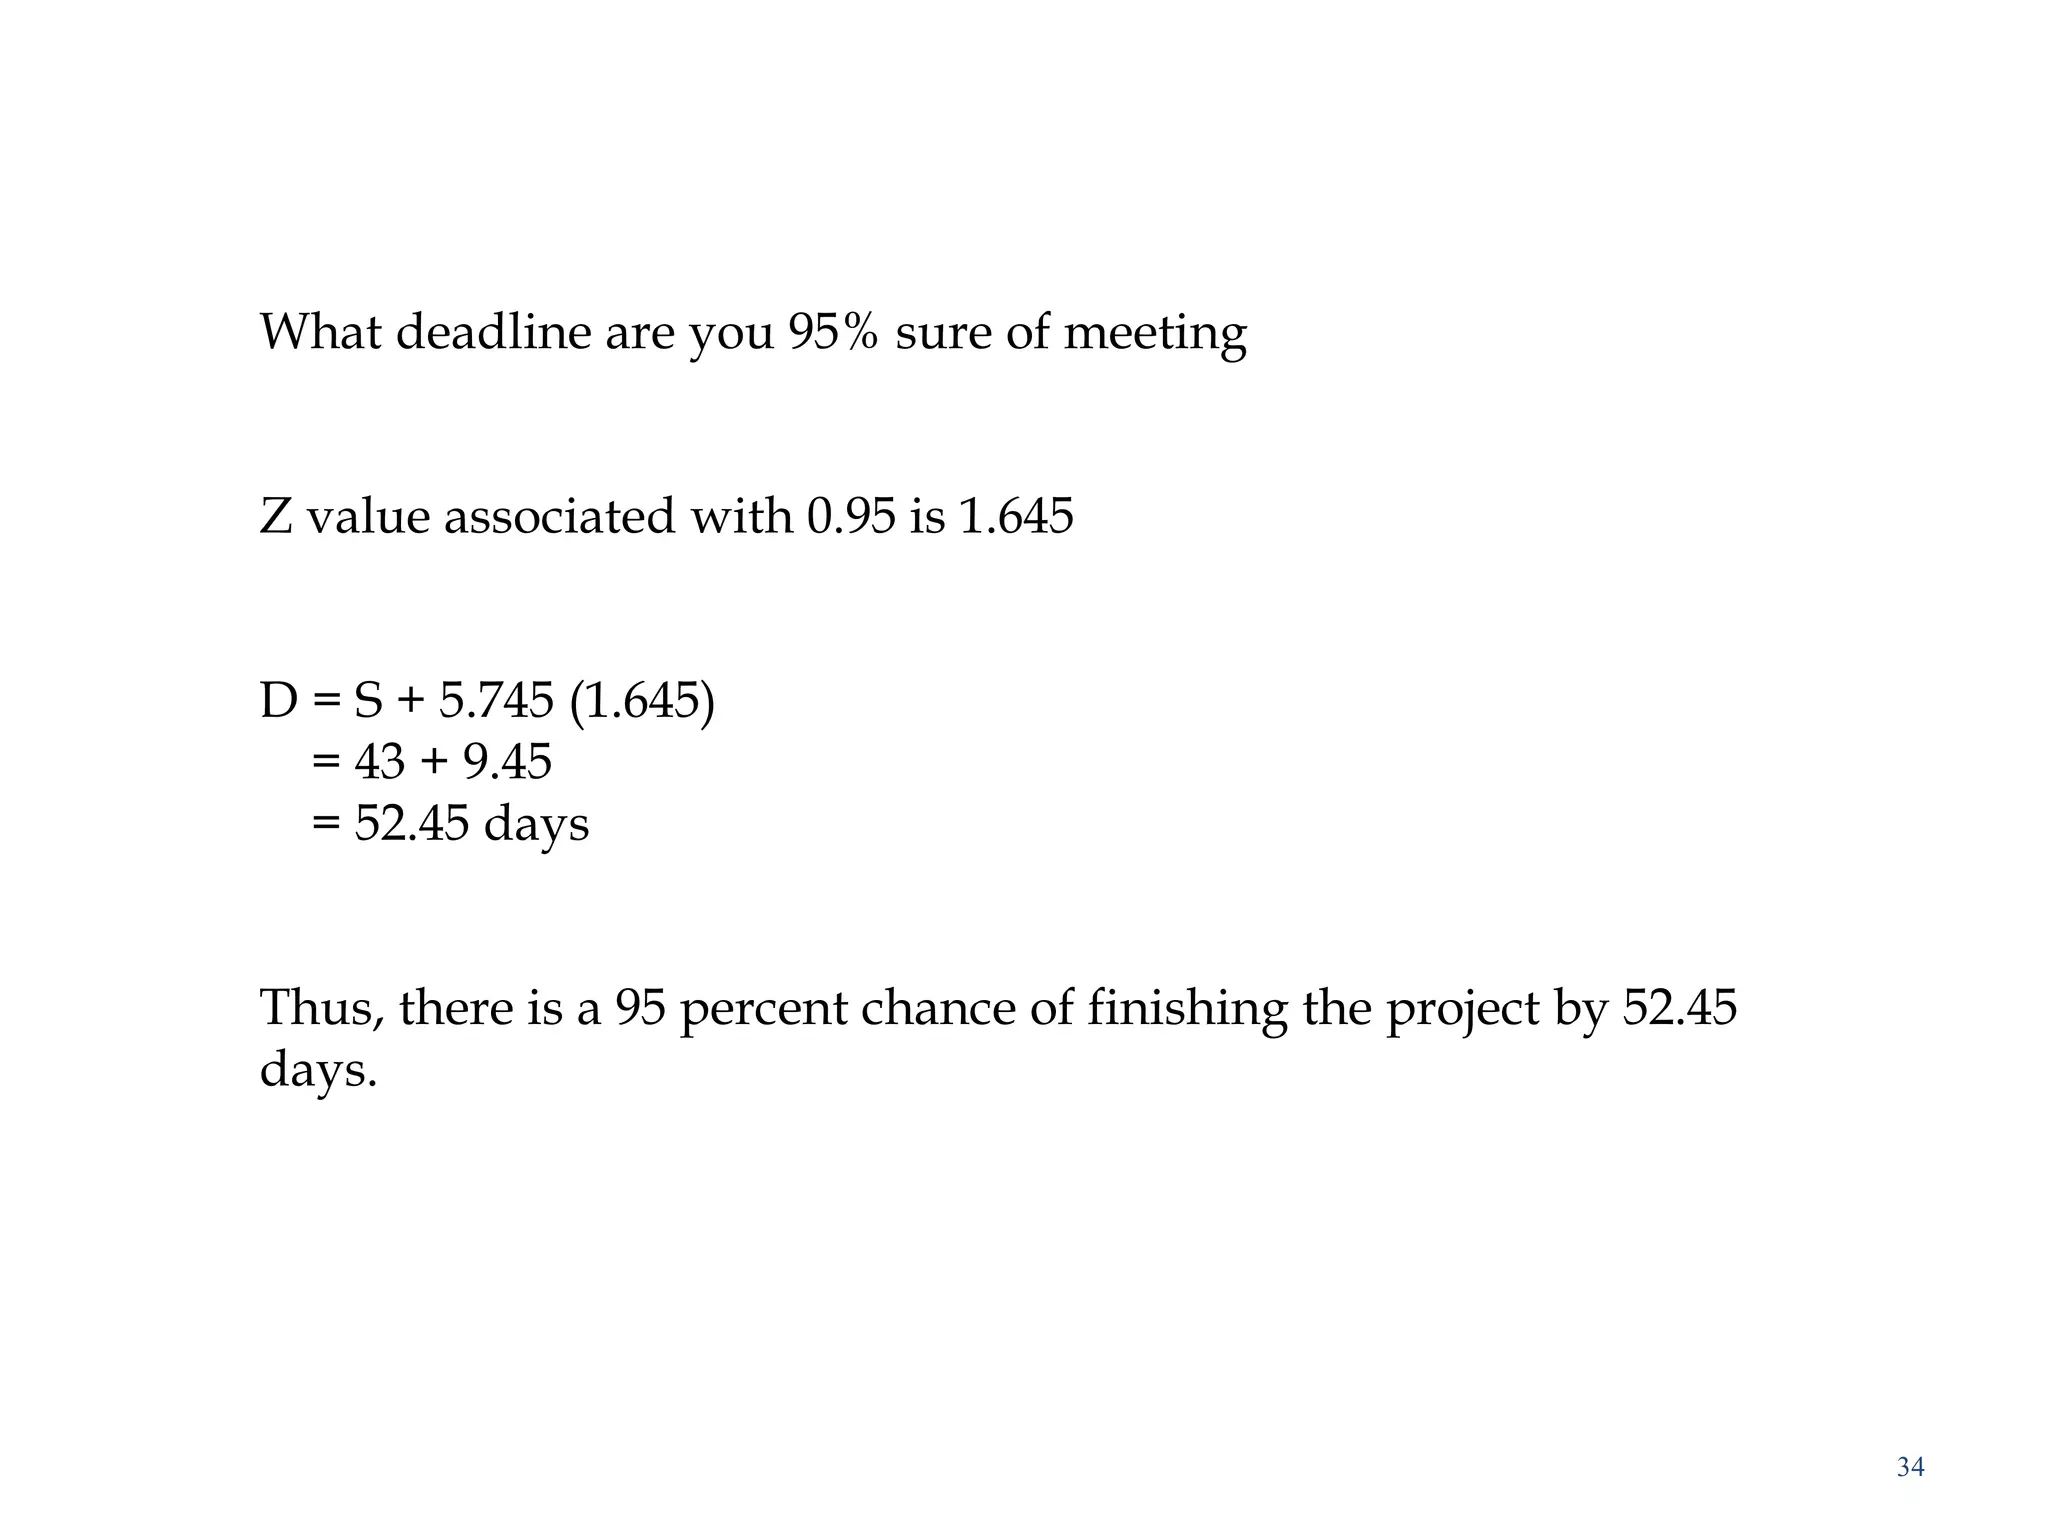
What deadline areyou 95% sure of meeting
Z value associated with 0.95 is 1.645
D = S + 5.745 (1.645)
= 43 + 9.45
= 52.45 days
Thus, there is a 95 percent chance of finishing the project by 52.45
days.
35.
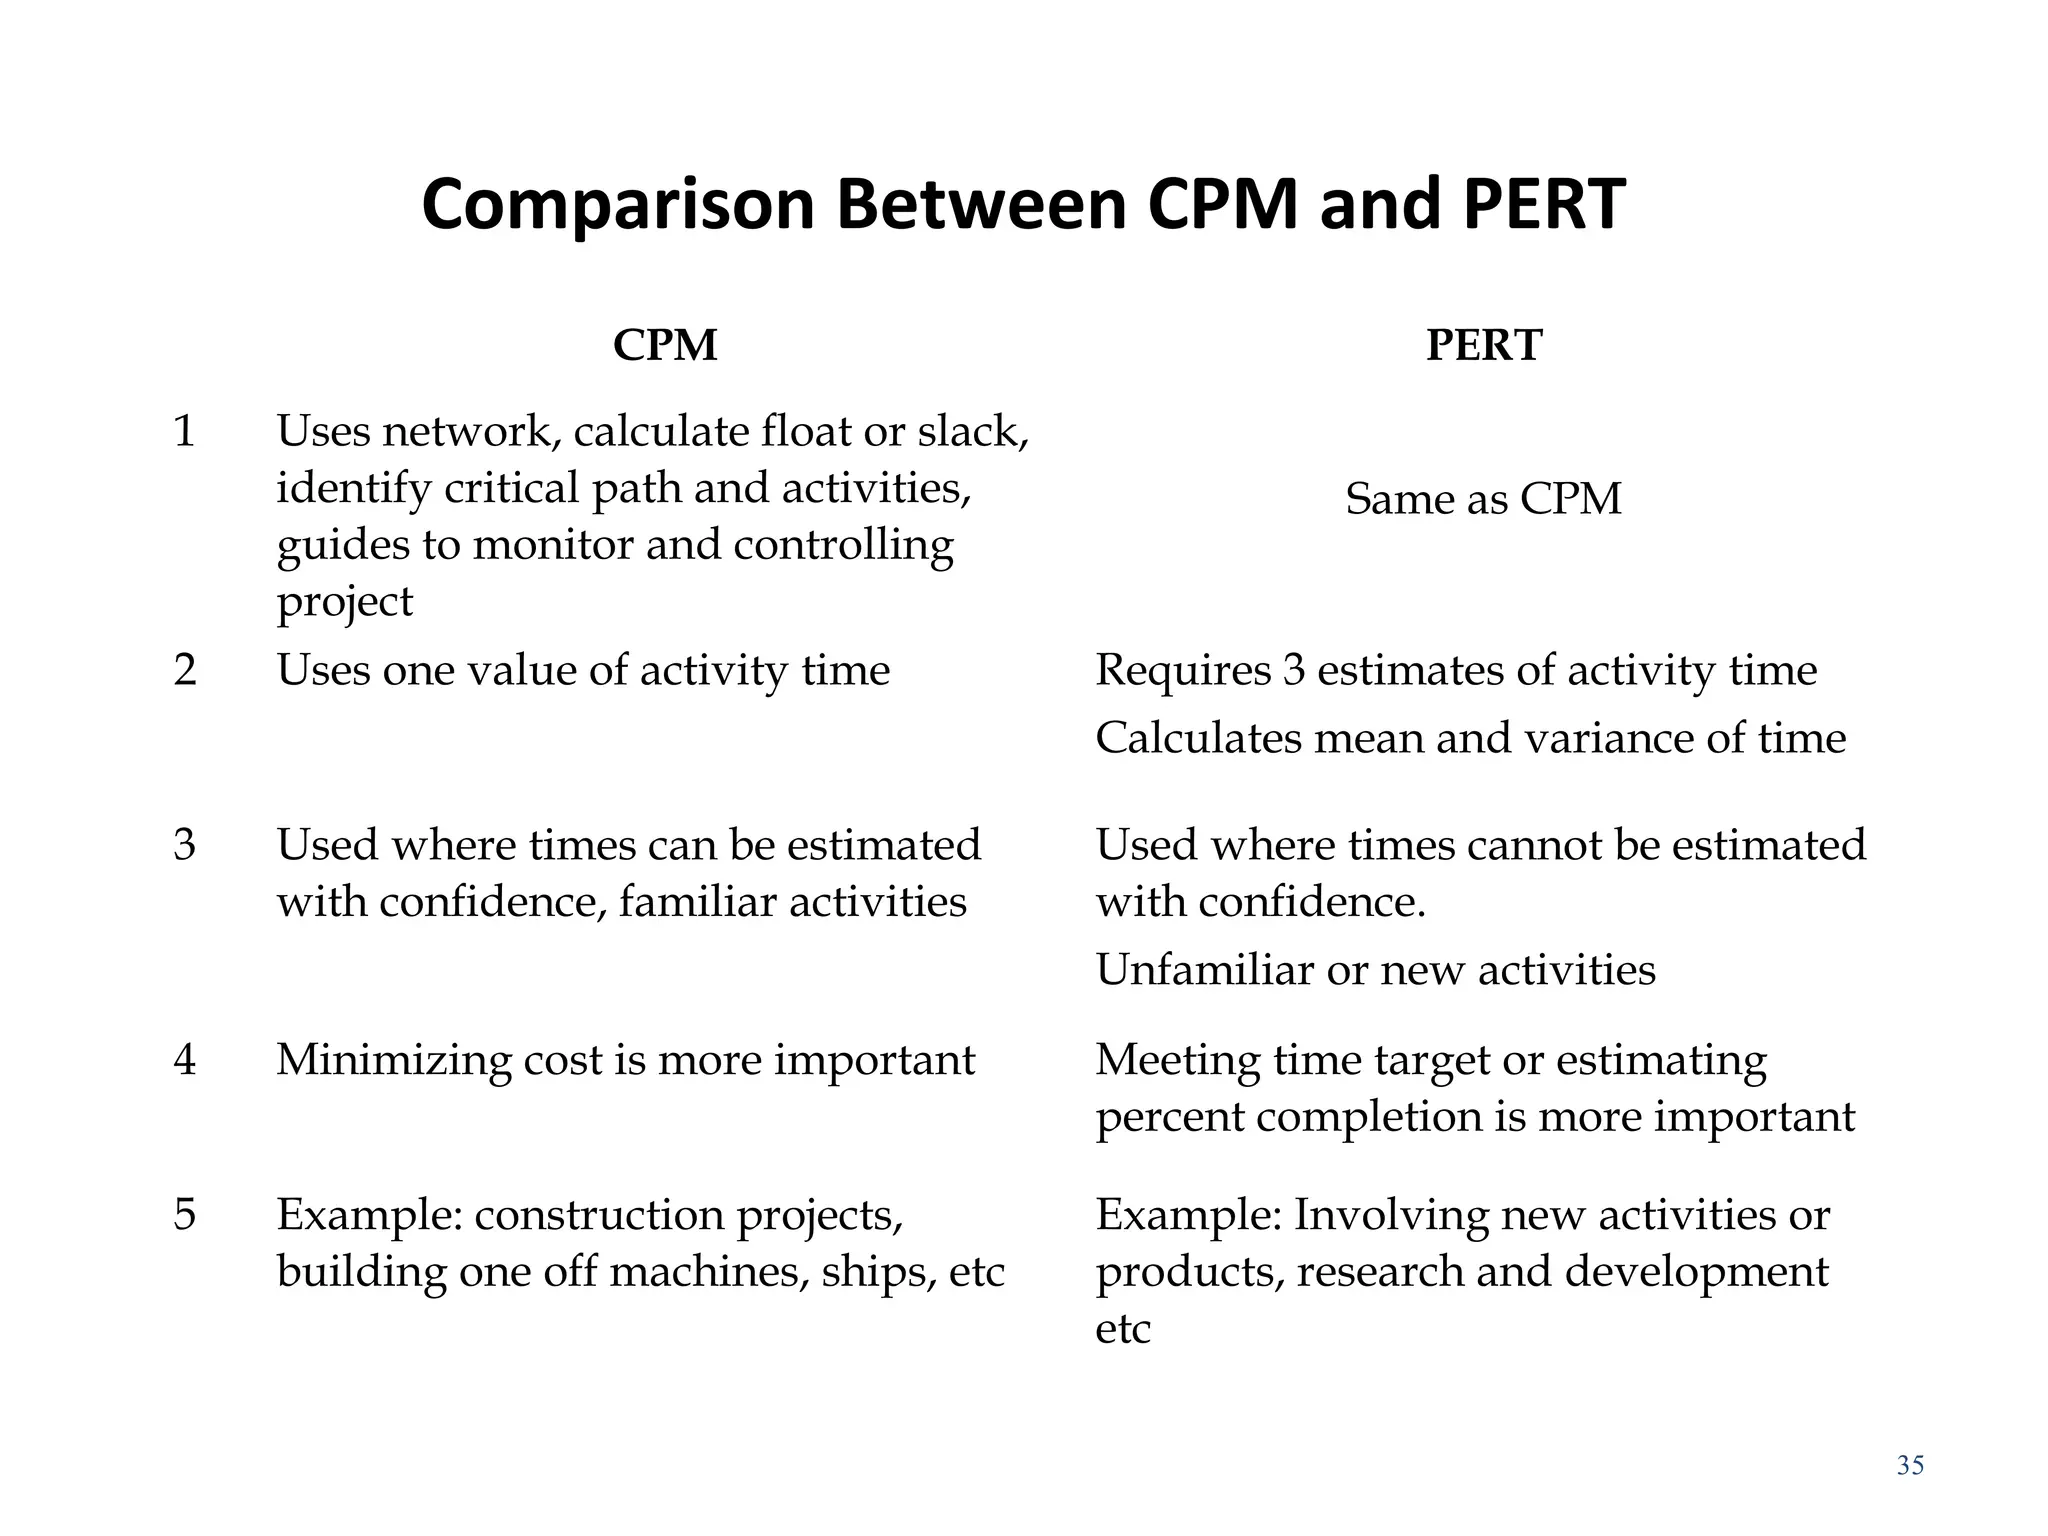
Comparison Between CPMand PERT
CPM PERT
1 Uses network, calculate float or slack,
identify critical path and activities,
guides to monitor and controlling
project
Same as CPM
2 Uses one value of activity time Requires 3 estimates of activity time
Calculates mean and variance of time
3 Used where times can be estimated
with confidence, familiar activities
Used where times cannot be estimated
with confidence.
Unfamiliar or new activities
4 Minimizing cost is more important Meeting time target or estimating
percent completion is more important
5 Example: construction projects,
building one off machines, ships, etc
Example: Involving new activities or
products, research and development
etc
35
36.
BENEFITS OFCPM /PERT NETWORK
Consistent framework for planning, scheduling, monitoring,
and controlling project.
• Shows interdependence of all tasks, work packages, and
work units.
• Helps proper communications between departments and
functions.
• Determines expected project completion date.
• Identifies so-called critical activities, which can delay the
project completion time.
36
37.
BENEFITS OF CPM/ PERT NETWORK (cont.)
• Identified activities with slacks that can be delayed for specified
periods without penalty, or from which resources may be
temporarily borrowed
• Determines the dates on which tasks may be started or must be
started if the project is to stay in schedule.
• Shows which tasks must be coordinated to avoid resource or
timing conflicts.
• Shows which tasks may run in parallel to meet project
completion date
37
38.
Modified PERT/CPM diagramfrom network
39
1
1
1
4
3
3
2
5
7
4
3
6
e
f
a d
b
c dummy
h
0 5 10 15 20 25 30 35 40 45
Legend
[ Scheduled Start
] Scheduled Finish
− Actual Progress
⊗ Unavailable
Λ Current Date
◊ Milestone Scheduled
♦ Milestone Achieved
Days
39.
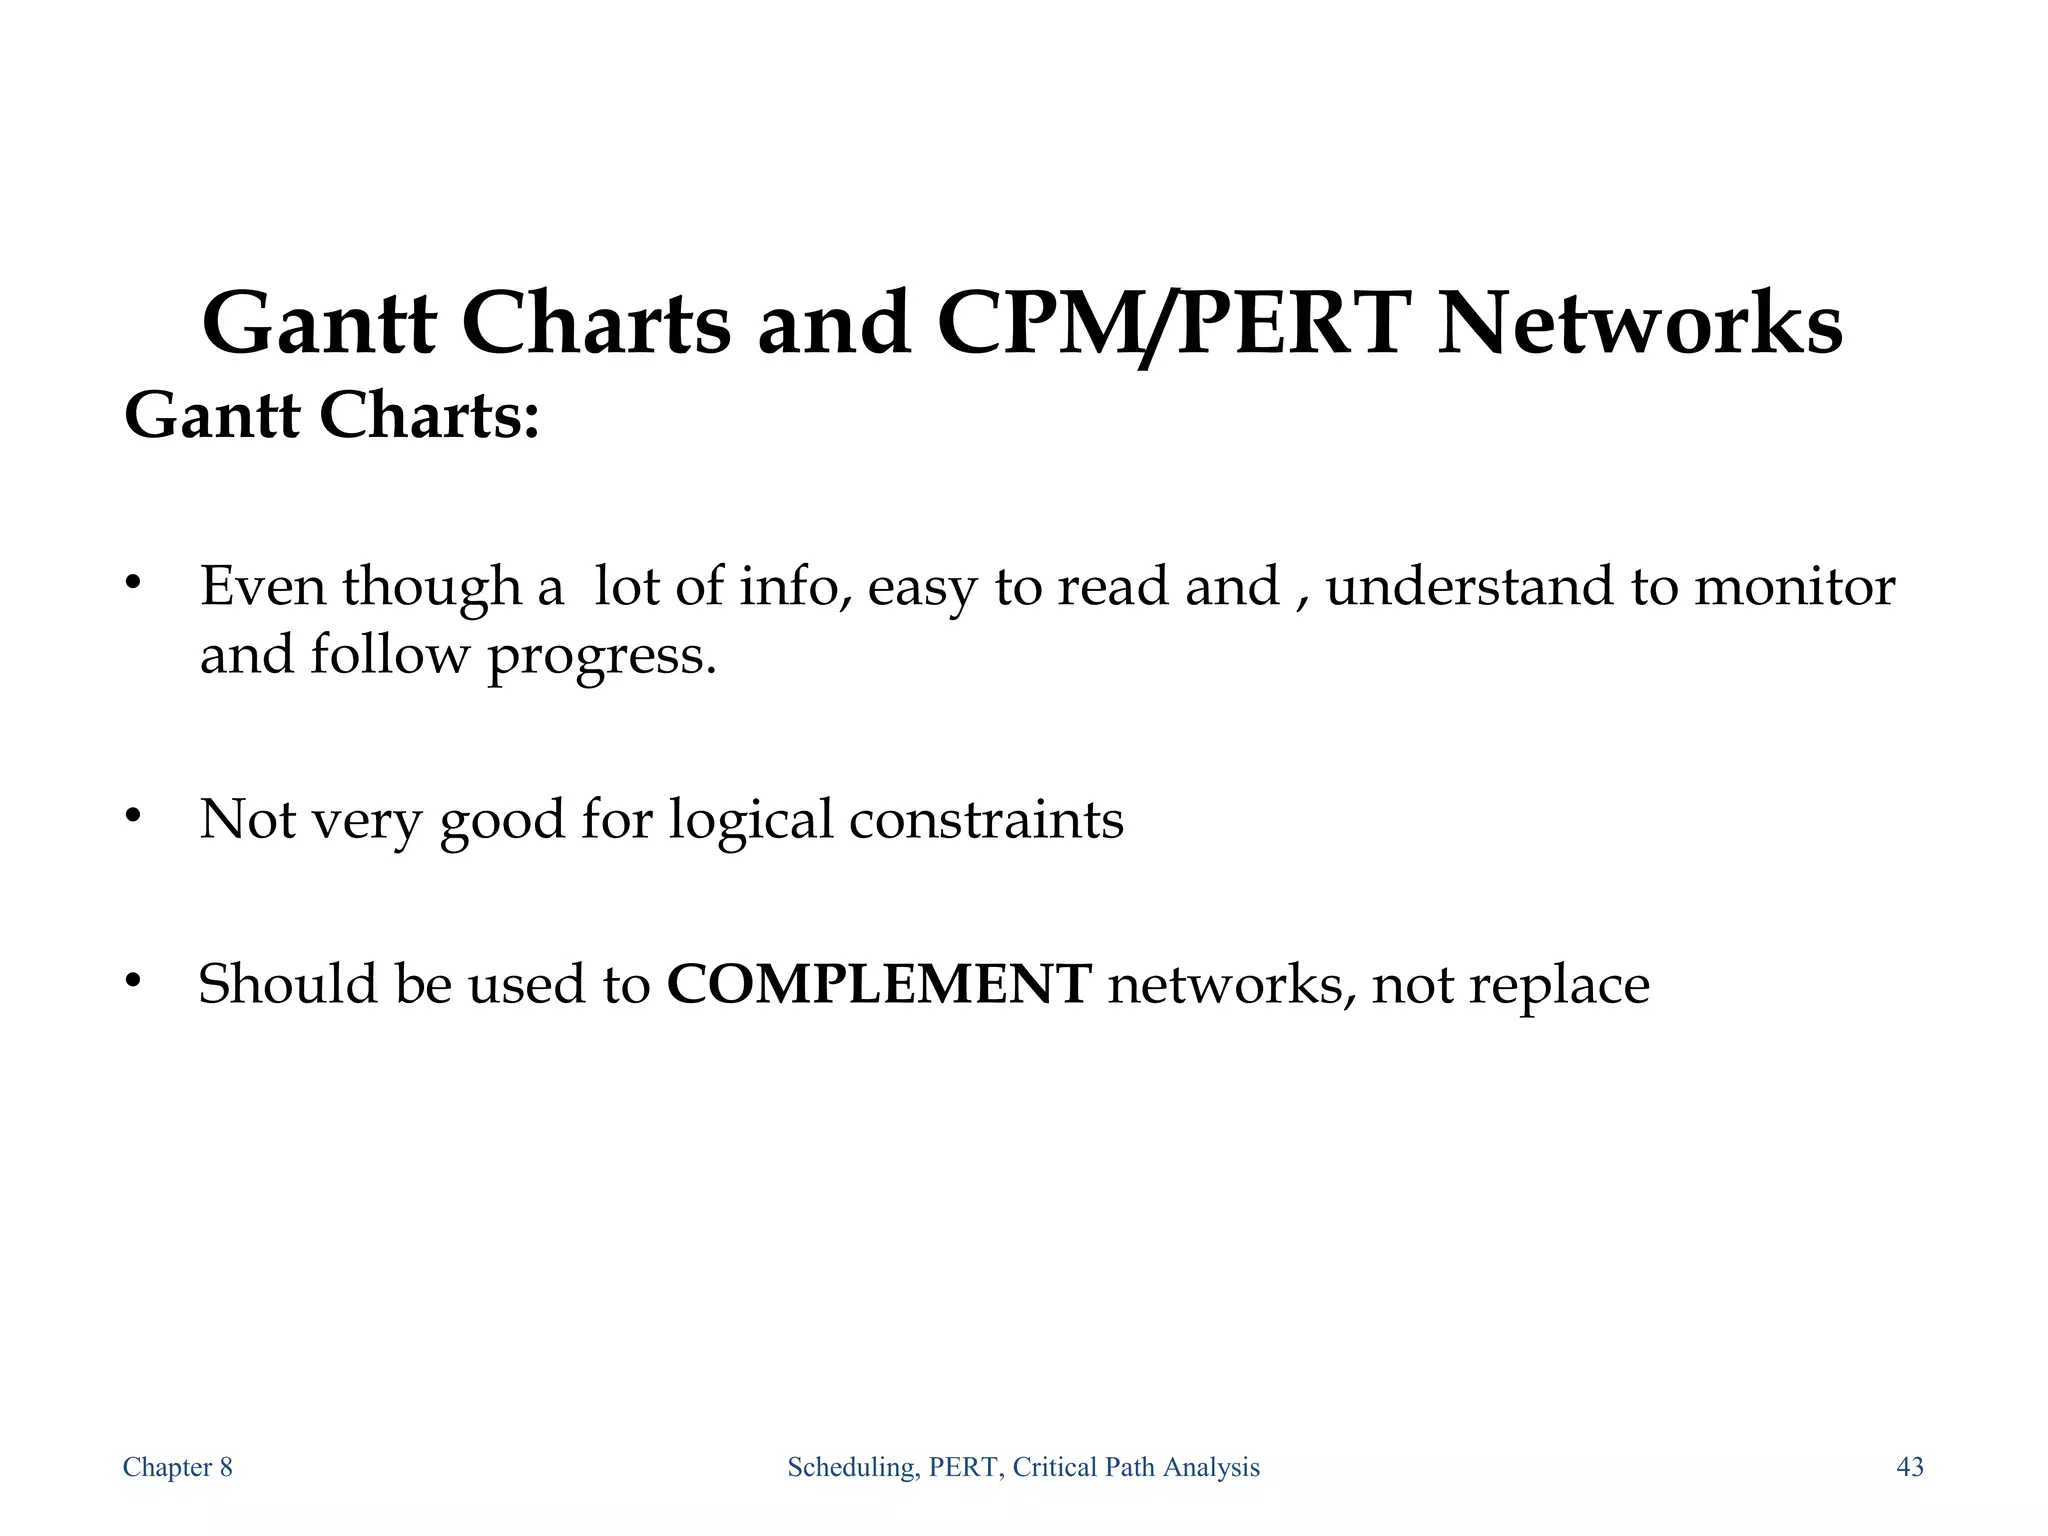
Gantt Charts andCPM/PERT Networks
Gantt Charts:
• Even though a lot of info, easy to read and , understand to monitor
and follow progress.
• Not very good for logical constraints
• Should be used to COMPLEMENT networks, not replace
Chapter 8 Scheduling, PERT, Critical Path Analysis 43
40.
Chapter 8 Scheduling,PERT, Critical Path Analysis 44
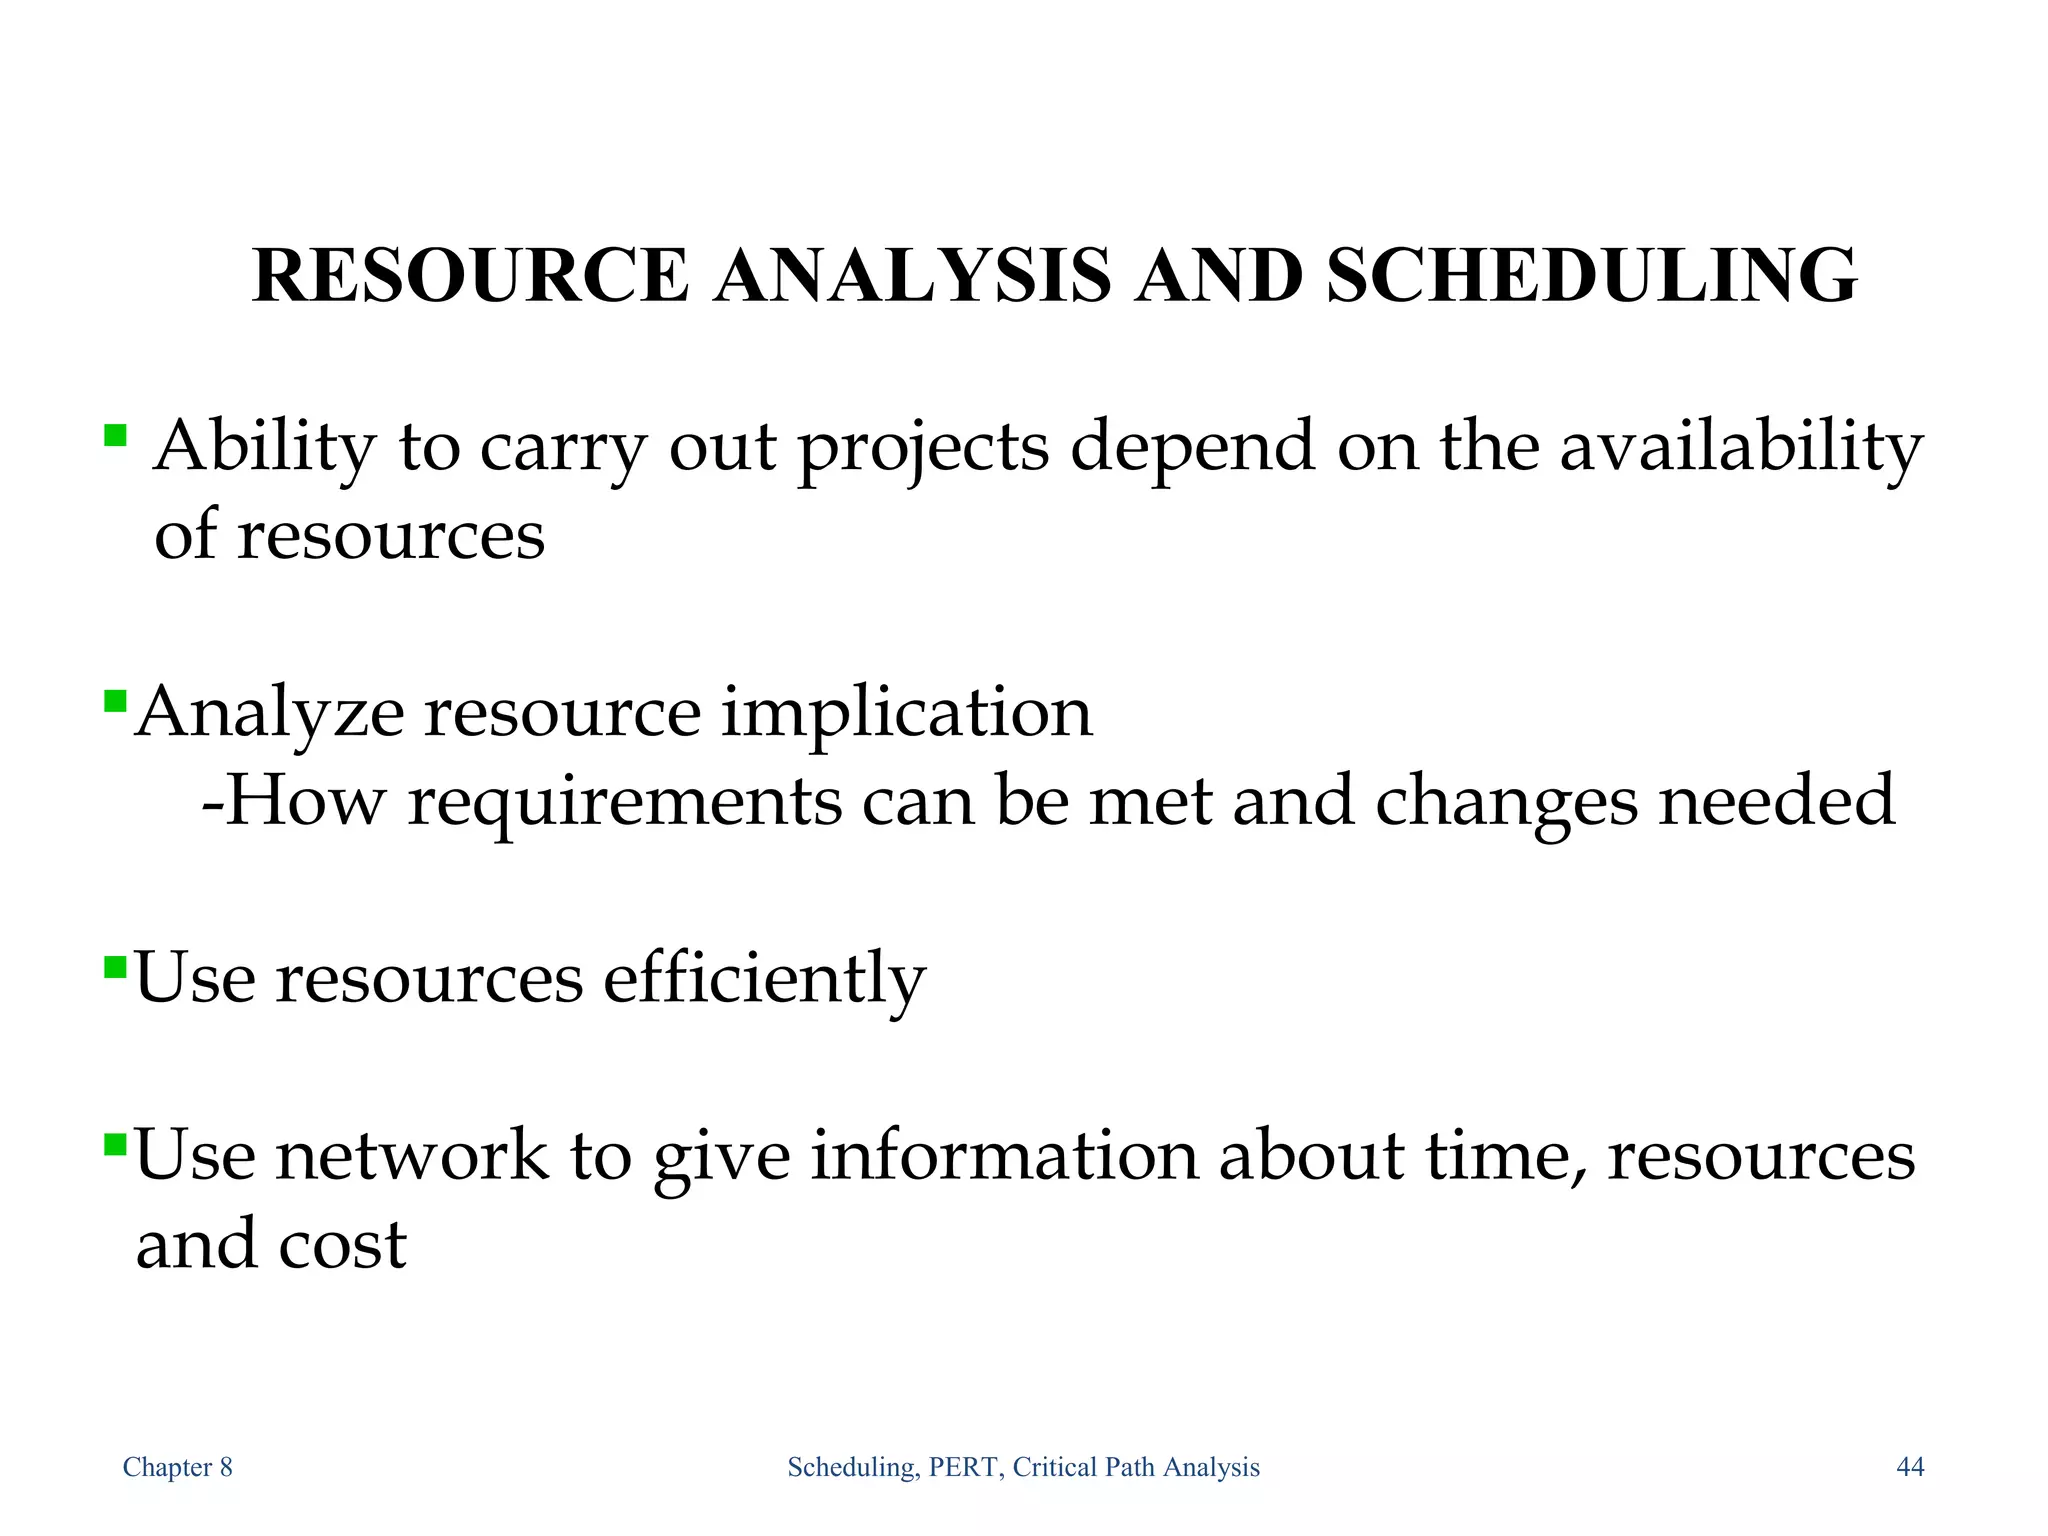
RESOURCE ANALYSIS AND SCHEDULING
Ability to carry out projects depend on the availability
of resources
Analyze resource implication
-How requirements can be met and changes needed
Use resources efficiently
Use network to give information about time, resources
and cost
![Arc with ES & EF time
18
1
2
A [0,5]
5
Activity
ES = earliest start time
EF = earliest finish time
t = expected activity
time](https://image.slidesharecdn.com/cpmnpertlecture1-180314122226/75/Cpm-n-pert-lecture-1-18-2048.jpg)
![Network with ES & EF time
19
1
3
4
2
5
7
6
A[0,5]5
B[0,6]6
C[5,9]
4
D[5,8]
3
E[5,6]1 F[6,10]
4
G[10,24]
14
H[9,21]
12
I[24,26]
2
Earliest start time rule:
The earliest start time for an activity leaving a particular node is equal to
the largest of the earliest finish times for all activities entering the node.](https://image.slidesharecdn.com/cpmnpertlecture1-180314122226/75/Cpm-n-pert-lecture-1-19-2048.jpg)
![Activity, duration, ES, EF, LS, LF
20
2
3
C [5,9]
4 [8,12]
Activity
ES = earliest start time
EF = earliest finish time
LF = latest finish time
LS = latest start time](https://image.slidesharecdn.com/cpmnpertlecture1-180314122226/75/Cpm-n-pert-lecture-1-20-2048.jpg)
![Network with LS & LF time
22
1
3
4
2
5
7
6
A[0,5]5[0,5]
B[0,6]6[6,12]
C[5,9]
4[8,12]
D[5,8]
3[7,10]
E[5,6]1[5,6]
F[6,10]
4[6,10]
G[10,24]
14[10,24]
H[9,21]
12[12,24]
I[24,26]
2[24,26]
Latest finish time rule:
The latest finish time for an activity entering a particular node is equal to
the smallest of the latest start times for all activities leaving the node.](https://image.slidesharecdn.com/cpmnpertlecture1-180314122226/75/Cpm-n-pert-lecture-1-22-2048.jpg)
![Slack or Free Time or Float
Slack is the length of time an activity can be delayed without affecting the
completion date for the entire project.
For example, slack for C = 3 weeks, i.e Activity C can be delayed up to 3
weeks
(start anywhere between weeks 5 and 8).
23
ES
5
LS
8
EF
9
LF-EF = 12 –9 =3
LS-ES = 8 – 5 = 3
LF-ES-t = 12-5-4 = 3
LF
12
2
3
C [5,9]
4 [8,12]](https://image.slidesharecdn.com/cpmnpertlecture1-180314122226/75/Cpm-n-pert-lecture-1-23-2048.jpg)
![Modified PERT/CPM diagram from network
39
1
1
1
4
3
3
2
5
7
4
3
6
e
f
a d
b
c dummy
h
0 5 10 15 20 25 30 35 40 45
Legend
[ Scheduled Start
] Scheduled Finish
− Actual Progress
⊗ Unavailable
Λ Current Date
◊ Milestone Scheduled
♦ Milestone Achieved
Days](https://image.slidesharecdn.com/cpmnpertlecture1-180314122226/75/Cpm-n-pert-lecture-1-38-2048.jpg)