Downloaded 1,242 times


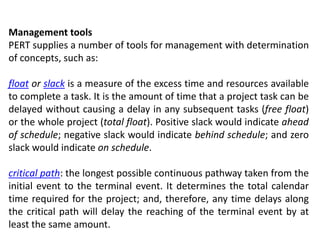
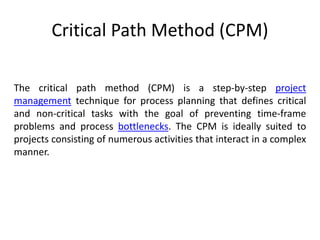
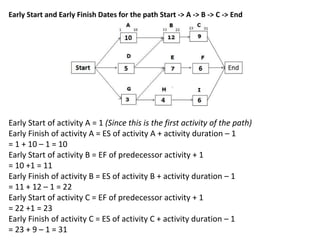
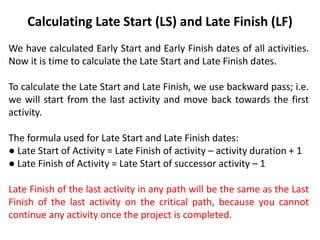
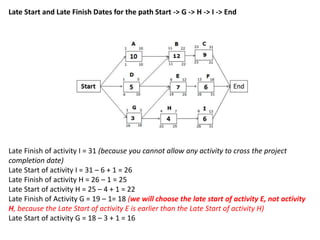
![Calculate Early Start (ES) and Early Finish (EF)
To calculate the Early Start and Early Finish dates, we use forward
pass; we will start from the beginning and proceed to the end.
The formula used for calculating Early Start and Early Finish dates:
● Early Start of the activity = (Early Finish of predecessor activity + 1).
- Early Start (ES) for the first activity on any path will be 1, because no
activity can be started before the first day[ (0+1)= 1].
- The start point for any activity or step along the path is the end
point of the predecessor activity on the path plus one.
● Early Finish of the activity = (Activity duration + Early Start of
activity – 1)
Easy to Remember: Start= (+1). Finish= (-1)](https://image.slidesharecdn.com/projectmanagementtooltechniquespert-cpm-180607170145/85/Project-Management-Tools-and-Techniques-PERT-Project-Evaluation-and-Review-Technique-CPM-Critical-Path-Method-48-320.jpg)
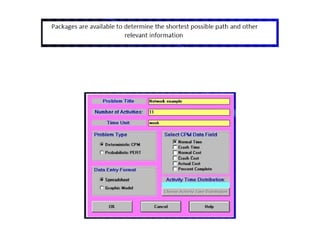
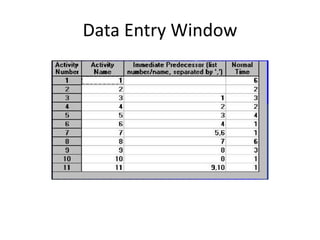
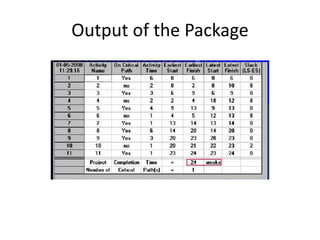
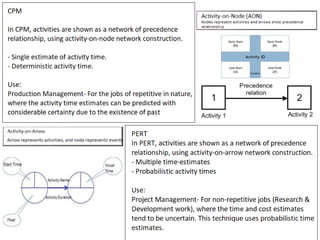


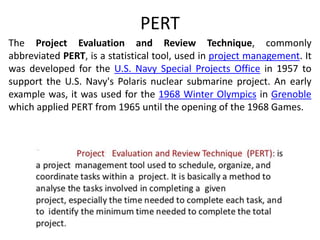
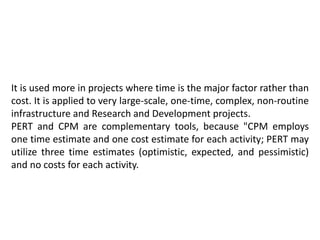
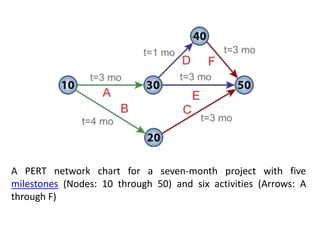
Project management involves planning, executing, and controlling projects to achieve specific goals within defined time and resource constraints. It utilizes tools like PERT (Program Evaluation and Review Technique) to estimate activity times, determine critical paths, and update schedules as projects progress. PERT uses three time estimates - optimistic, most likely, and pessimistic - to calculate expected activity times and identify float and slack. The critical path determines the minimum project duration, and crashing or fast tracking can potentially shorten schedules at increased cost. Project management tools help make projects more efficient and effective.


