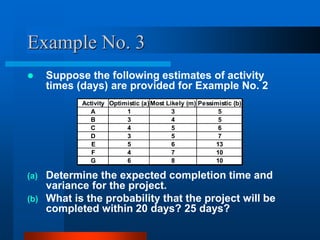
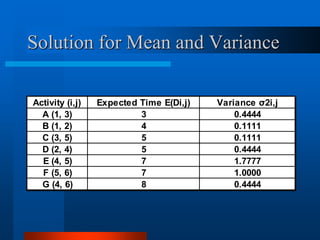
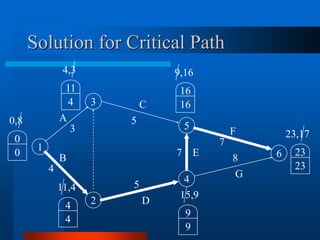
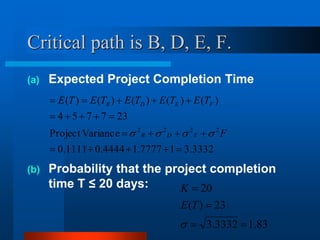
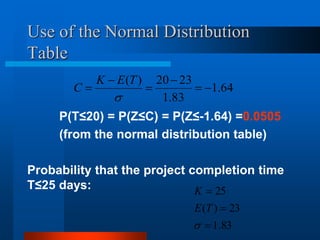
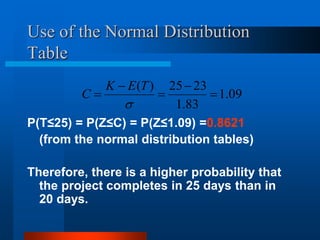
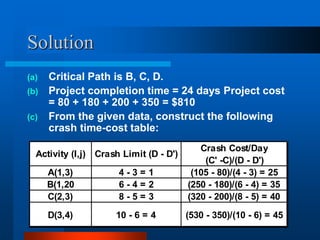
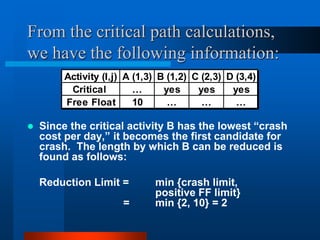
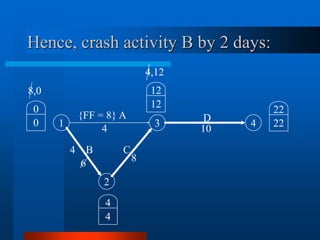
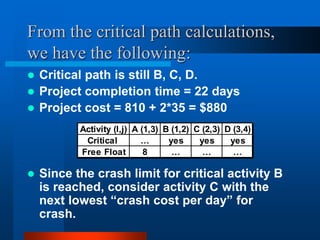
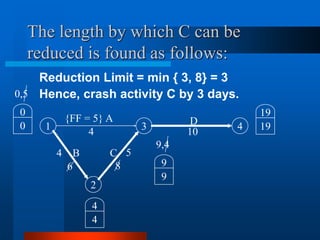
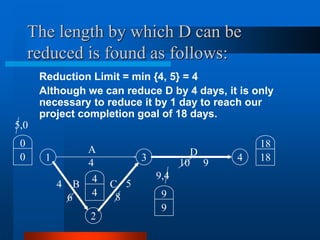
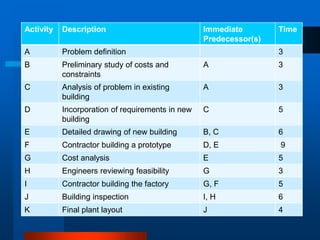
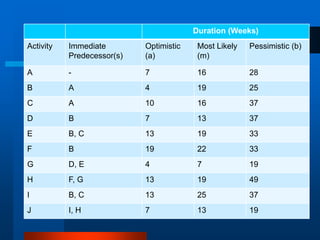
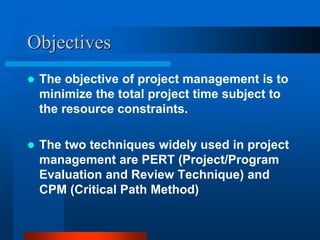
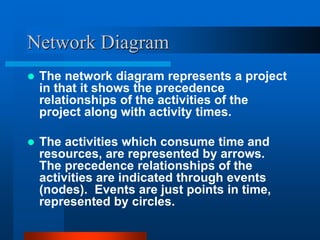
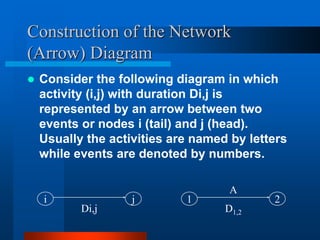
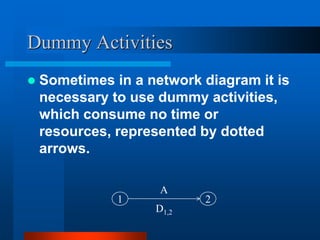
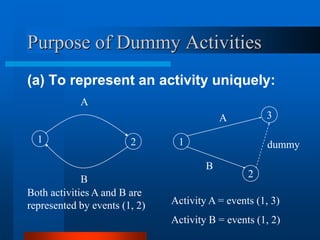
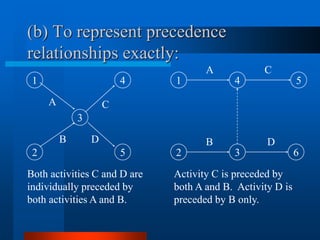
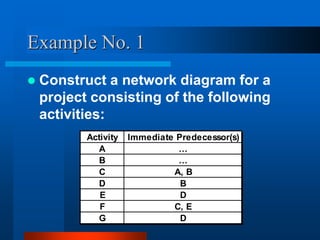
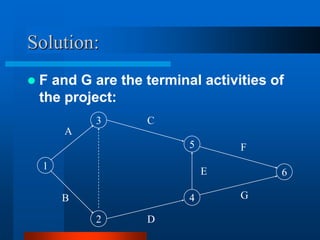
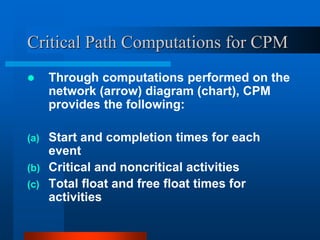
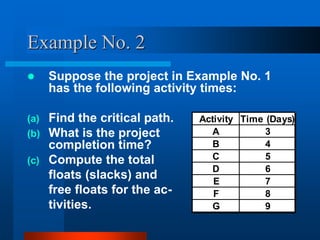
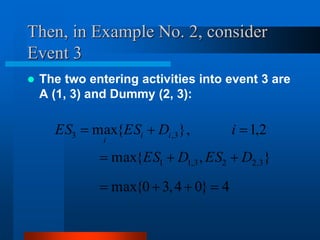
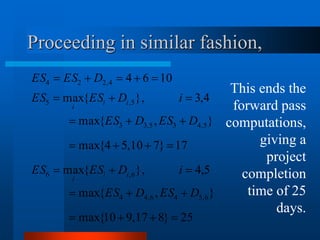
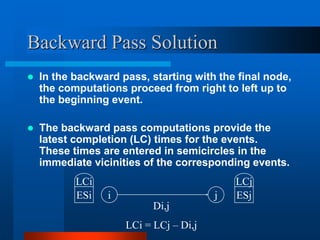
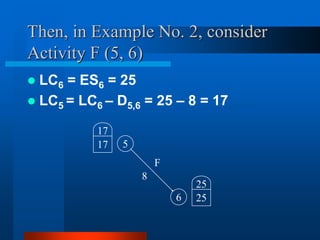
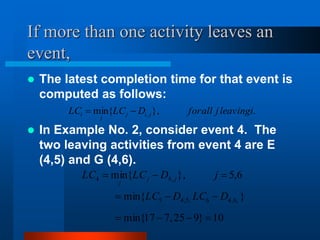
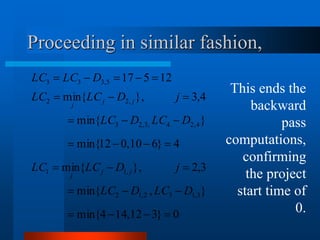
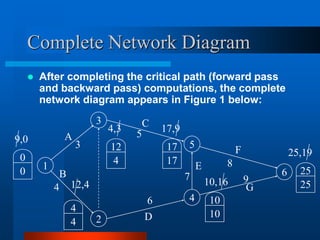
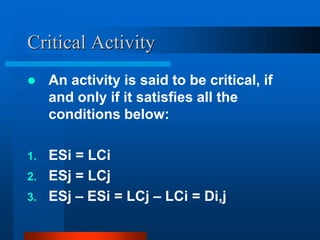
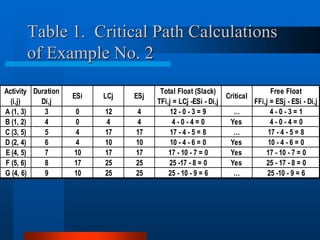
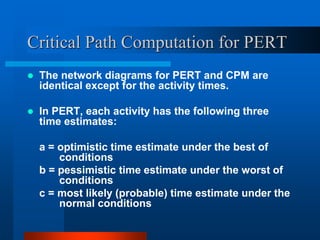
PERT / CPM
Moges G.
Definition
 A project is a set of activities to be
performed in a specific sequence to
completion.
 An activity is a task to be executed
using time and resources.
Objectives
 The objective of project management is to
minimize the total project time subject to
the resource constraints.
 The two techniques widely used in project
management are PERT (Project/Program
Evaluation and Review Technique) and
CPM (Critical Path Method)
PERT/CPM
 Although the two terms PERT and CPM
are used interchangeably today,
historically PERT was based on
probabilistic times while CPM was based
on deterministic times.
 Probabilistic times are uncertain and
deterministic is certain meaning with
definite interval.
Network Diagram
 The network diagram represents a project
in that it shows the precedence
relationships of the activities of the
project along with activity times.
 The activities which consume time and
resources, are represented by arrows.
The precedence relationships of the
activities are indicated through events
(nodes). Events are just points in time,
represented by circles.
Construction of the Network
(Arrow) Diagram
 Consider the following diagram in which
activity (i,j) with duration Di,j is
represented by an arrow between two
events or nodes i (tail) and j (head).
Usually the activities are named by letters
while events are denoted by numbers.
i j
Di,j
1 2
D1,2
A
Dummy Activities
 Sometimes in a network diagram it is
necessary to use dummy activities,
which consume no time or
resources, represented by dotted
arrows.
1 2
D1,2
A
Purpose of Dummy Activities
(a) To represent an activity uniquely:
1 2
A
B
Both activities A and B are
represented by events (1, 2)
2
3
1 dummy
B
A
Activity A = events (1, 3)
Activity B = events (1, 2)
(b) To represent precedence
relationships exactly:
3
5
2
4
1
A
D
B
C
Both activities C and D are
individually preceded by
both activities A and B.
1
3
5
4
2 6
Activity C is preceded by
both A and B. Activity D is
preceded by B only.
A C
B D
Example No. 1
 Construct a network diagram for a
project consisting of the following
activities:
Activity Immediate Predecessor(s)
A …
B …
C A, B
D B
E D
F C, E
G D
Solution:
 F and G are the terminal activities of
the project:
1
2
B
3
A
C
5
D
4
F
G
6
E
Critical Path Computations for CPM
 Through computations performed on the
network (arrow) diagram (chart), CPM
provides the following:
(a) Start and completion times for each
event
(b) Critical and noncritical activities
(c) Total float and free float times for
activities
Example No. 2
 Suppose the project in Example No. 1
has the following activity times:
(a) Find the critical path.
(b) What is the project
completion time?
(c) Compute the total
floats (slacks) and
free floats for the ac-
tivities.
Activity Time (Days)
A 3
B 4
C 5
D 6
E 7
F 8
G 9
Solution
 The critical path computations are
performed in two passes---forward
and backward pass.
 In the forward pass, starting with a
time of 0 for the first event, the
computations proceed from left to
right up to the final event.
Forward Pass Solution
 The forward pass computation provides the
earliest start (ES) times for the events. These
times are entered in squares in the immediate
vicinities of the corresponding events.
 For any activity (i, j), let ES1 denote the earliest
start time of event i.
ESi 1 2 ESj
Di,j
ESj = ESi + Di,j
Then, in Example No. 2, consider
Activity A (1, 2)
1
2
B
0
4
4
 ES2 = ES1 + D1,2 = 0 + 4 = 4
If more than one activity enters an
event:
 The earliest start time for the event is
computed as follows:
 This is because the event cannot start
until the entering activities are
completed.
j
in
entering
i
all
for
D
ES
ES j
i
i
i
j },
{
max ,


Then, in Example No. 2, consider
Event 3
 The two entering activities into event 3 are
A (1, 3) and Dummy (2, 3):
4
}
0
4
,
3
0
{
max
}
,
{
max
2
,
1
},
{
max
3
,
2
2
3
,
1
1
3
,
3










D
ES
D
ES
i
D
ES
ES i
i
i
Proceeding in similar fashion,
25
}
8
17
,
9
10
{
max
}
,
{
max
5
,
4
},
{
max
17
}
7
10
,
5
4
{
max
}
,
{
max
4
,
3
},
{
max
10
6
4
6
,
5
4
6
,
4
4
6
,
6
5
,
4
3
5
,
3
3
5
,
5
4
,
2
2
4

























D
ES
D
ES
i
D
ES
ES
D
ES
D
ES
i
D
ES
ES
D
ES
ES
i
i
i
i
i
i
This ends the
forward pass
computations,
giving a
project
completion
time of 25
days.
Backward Pass Solution
 In the backward pass, starting with the final node,
the computations proceed from right to left up to
the beginning event.
 The backward pass computations provide the
latest completion (LC) times for the events.
These times are entered in semicircles in the
immediate vicinities of the corresponding events.
ESi i j ESj
Di,j
LCi = LCj – Di,j
LCi LCj
Then, in Example No. 2, consider
Activity F (5, 6)
 LC6 = ES6 = 25
 LC5 = LC6 – D5,6 = 25 – 8 = 17
5
6
8
F
25
25
17
17
If more than one activity leaves an
event,
 The latest completion time for that event is
computed as follows:
 In Example No. 2, consider event 4. The
two leaving activities from event 4 are E
(4,5) and G (4,6).
.
},
{
min , i
leaving
j
all
for
D
LC
LC j
i
j
j
i 

10
}
9
25
,
7
17
{
min
}
{
min
6
,
5
},
{
min
,
6
,
4
6
,
5
,
4
5
,
4
4










D
LC
D
LC
j
D
LC
LC j
j
j
Proceeding in similar fashion,
0
}
3
12
,
14
4
{
min
}
,
{
min
3
,
2
},
{
min
4
}
6
10
,
0
12
{
min
}
{
min
4
,
3
},
{
min
12
5
17
3
,
1
3
2
,
1
2
,
1
1
4
,
2
4
,
3
,
2
3
,
2
2
5
,
3
3
3

























D
LC
D
LC
j
D
LC
LC
D
LC
D
LC
j
D
LC
LC
D
LC
LC
j
j
j
j
j
j
This ends the
backward
pass
computations,
confirming
the project
start time of
0.
Complete Network Diagram
 After completing the critical path (forward pass
and backward pass) computations, the complete
network diagram appears in Figure 1 below:
1
2
B
3
A
C
5
D
4
F
G
6
0
0
9,0
4
12
4,3
4
4
12,4
10
10
10,16
17
17
17,9
25
25
25,19
3
7
8
9
6
4
E
5
Critical Activity
 An activity is said to be critical, if
and only if it satisfies all the
conditions below:
1. ESi = LCi
2. ESj = LCj
3. ESj – ESi = LCj – LCi = Di,j
Then, in Example No. 2, consider
the Criticality Test:
 A critical path is a continuous path
starting with the first event and ending
with the last event.
 Example No. 2 indicates the following
activities to be critical: B, D, E, and F.
 In other words, activities B,D,E, and F
form the critical path. In terms of events,
1-2-4-5-6 is the critical path.
Critical Path
1
2
B
3
A
C
5
D
4
F
G
6
0
0
9,0
4
12
4,3
4
4
12,4
10
10
10,16
17
17
17,9
25
25
25,19
3
7
8
9
6
4
E
5
Slack or Total Float
 The total float for an activity is the difference
between its maximum available time (LCj – ESi)
and its duration (Di,j).
 Slack signifies the time by which an activity can
be delayed without delaying the project. A zero
slack for an activity indicates that it cannot be
delayed without delaying the whole project and
hence it is called a critical activity.
j
i
i
j
j
i D
ES
LC
TF
Float
Total
Slack ,
, 




Then, in Example No. 2, consider
the total floats for activities C and D:
 Activity C has a positive slack indicating
it is noncritical.
8
5
4
17
5
,
3
3
5
5
,
3 






 D
ES
LC
TF
C
Activity
0
6
4
10
4
,
2
2
4
4
,
2 






 D
ES
LC
TF
D
Activity
 Activity D has a zero slack indicating it is
critical. Similarly the total floats for all the
other activities in Example No. 2 can be
computed.
Free Floats
 Free floats are useful in considering
project time vs. project cost.
 Free float for an activity (i,j) is the
difference between its available time
(based on earliest start times) and its
duration:
j
i
i
j
j
i D
ES
ES
FF ,
, 


Then, in Example No. 2, consider
the free floats for activities A and E:
 Similarly the free floats for all the
other activities in Example No. 2 can
be calculated.
0
7
10
17
:
1
3
0
4
:
5
,
4
4
5
5
,
4
3
,
1
1
3
3
,
1














D
ES
ES
FF
E
Activity
D
ES
ES
FF
A
Activity
Table 1. Critical Path Calculations
of Example No. 2
Activity
(i,j)
Duration
Di,j
ESi LCj ESj
Total Float (Slack)
TFi,j = LCj -ESi - Di,j
Critical
Free Float
FFi,j = ESj - ESi - Di,j
A (1, 3) 3 0 12 4 12 - 0 - 3 = 9 … 4 - 0 - 3 = 1
B (1, 2) 4 0 4 4 4 - 0 - 4 = 0 Yes 4 - 0 - 4 = 0
C (3, 5) 5 4 17 17 17 - 4 - 5 = 8 … 17 - 4 - 5 = 8
D (2, 4) 6 4 10 10 10 - 4 - 6 = 0 Yes 10 - 4 - 6 = 0
E (4, 5) 7 10 17 17 17 - 10 - 7 = 0 Yes 17 - 10 - 7 = 0
F (5, 6) 8 17 25 25 25 -17 - 8 = 0 Yes 25 - 17 - 8 = 0
G (4, 6) 9 10 25 25 25 - 10 - 9 = 6 … 25 -10 - 9 = 6
Critical Path Computation for PERT
 The network diagrams for PERT and CPM are
identical except for the activity times.
 In PERT, each activity has the following three
time estimates:
a = optimistic time estimate under the best of
conditions
b = pessimistic time estimate under the worst of
conditions
c = most likely (probable) time estimate under the
normal conditions
Mean and Variance Computations
for PERT
 The probabilistic nature of the activity
times is described by the beta
distribution whose mean and variance
are given below:
2
,
2
,
]
6
/
)
[(
6
/
)
4
(
)
(
a
b
Variance
m
b
a
D
E
Mean
j
i
j
i






Example No. 3
 Suppose the following estimates of activity
times (days) are provided for Example No. 2
(a) Determine the expected completion time and
variance for the project.
(b) What is the probability that the project will be
completed within 20 days? 25 days?
Activity Optimistic (a)Most Likely (m) Pessimistic (b)
A 1 3 5
B 3 4 5
C 4 5 6
D 3 5 7
E 5 6 13
F 4 7 10
G 6 8 10
Solution for Mean and Variance
Activity (i,j) Expected Time E(Di,j) Variance σ2i,j
A (1, 3) 3 0.4444
B (1, 2) 4 0.1111
C (3, 5) 5 0.1111
D (2, 4) 5 0.4444
E (4, 5) 7 1.7777
F (5, 6) 7 1.0000
G (4, 6) 8 0.4444
Solution for Critical Path
1
2
B
3
A
C
5
D
4
F
G
6
0
0
0,8
4
11
4,3
4
4
11,4
9
9
15,9
16
16
9,16
23
23
23,17
3
7
7
8
5
4
E
5
Critical path is B, D, E, F.
(a) Expected Project Completion Time
(b) Probability that the project completion
time T ≤ 20 days:
3332
.
3
1
7777
.
1
4444
.
0
1111
.
0
Variance
Project
23
7
7
5
4
)
(
)
(
)
(
)
(
)
(
2
2
2
2



















F
T
E
T
E
T
E
T
E
T
E
E
D
B
F
E
D
B




83
.
1
3332
.
3
23
)
(
20





T
E
K
Use of the Normal Distribution
Table
P(T≤20) = P(Z≤C) = P(Z≤-1.64) =0.0505
(from the normal distribution table)
Probability that the project completion time
T≤25 days:
64
.
1
83
.
1
23
20
)
(







T
E
K
C
83
.
1
23
)
(
25




T
E
K
Negative Normal Distribution
Table
Use of the Normal Distribution
Table
P(T≤25) = P(Z≤C) = P(Z≤1.09) =0.8621
(from the normal distribution tables)
Therefore, there is a higher probability that
the project completes in 25 days than in
20 days.
09
.
1
83
.
1
23
25
)
(






T
E
K
C
Positive Normal Distribution
Table
Project Time VS. Project Cost
 The normal time for an activity can
be reduced by using increased
resources.
 The limit beyond which an activity
time cannot be shortened is known
as the crash limit.
Crash Limit
Crash Limit = D – D’
where: D = normal time (duration)
D’ = crash time (duration)
It can also refer to C for cost on the other hand.
Assuming a straight-line cost-duration relationship:
Slope = (C’ – C)/(D – D’) = CRASH COST
PER UNIT TIME
Reduction of the Project Completion
Time
 It can be reduced by reducing the normal
times of critical activities. Reducing the
critical activity with the minimum cost-
duration slope will yield the minimum cost
up to the crash limit.
 This does not guarantee that the project
time will also be reduced by the same
length, since the above reduction may
have led to the a new critical path.
Detection of New Critical Path
 To find whether a new critical path may
occur, check whether a positive free float
of any non-critical activity becomes zero.
 By reducing the duration of the critical
activity by one time unit, compute the new
free floats of the non-critical activities.
Upon Reducing the Duration
 Check which ones have reduced their old positive
free floats by one unit.
 Of these, the one with the smallest old positive
free float gives the positive free float limit.
Reduction Limit = min { crash limit,
positive free float limit }
 Continue to proceed in the above fashion until all
critical activities in the latest critical path are at
their crash limits.
Example No. 4
 Consider the following arrow
diagram with activity times given in
days:
1 4
2
3
A D
C
B
4 10
8
6
The normal and crash data for this
project are as follows:
 Find the critical path
 Find the project completion time and the
corresponding cost.
 If we want to complete the project in 18
days, find the best crash time and cost.
Activity Normal Time (Days) Crash Time (Days) Normal Cost ($) Crash Cost ($)
A 4 3 80 105
B 6 4 180 250
C 8 5 200 320
D 10 6 350 530
Solution for the Critical Path
1 4
2
3
{FF = 10} A D
C
B
4 10
8
6
0
0
10,0
6
6
24
24
14
14
4,14
Solution
(a) Critical Path is B, C, D.
(b) Project completion time = 24 days Project cost
= 80 + 180 + 200 + 350 = $810
(c) From the given data, construct the following
crash time-cost table:
Activity (I,j) Crash Limit (D - D')
Crash Cost/Day
(C' -C)/(D - D')
A(1,3) 4 - 3 = 1 (105 - 80)/(4 - 3) = 25
B(1,20 6 - 4 = 2 (250 - 180)/(6 - 4) = 35
C(2,3) 8 - 5 = 3 (320 - 200)/(8 - 5) = 40
D(3,4) 10 - 6 = 4 (530 - 350)/(10 - 6) = 45
From the critical path calculations,
we have the following information:
 Since the critical activity B has the lowest “crash
cost per day,” it becomes the first candidate for
crash. The length by which B can be reduced is
found as follows:
Reduction Limit = min {crash limit,
positive FF limit}
= min {2, 10} = 2
Activity (I,j) A (1,3) B (1,2) C (2,3) D (3,4)
Critical … yes yes yes
Free Float 10 … … …
Hence, crash activity B by 2 days:
1 4
2
3
{FF = 8} A D
C
B
4 10
8
6
0
0
8,0
4
4
22
22
12
12
4,12
4
From the critical path calculations,
we have the following:
 Critical path is still B, C, D.
 Project completion time = 22 days
 Project cost = 810 + 2*35 = $880
 Since the crash limit for critical activity B
is reached, consider activity C with the
next lowest “crash cost per day” for
crash.
Activity (I,j) A (1,3) B (1,2) C (2,3) D (3,4)
Critical … yes yes yes
Free Float 8 … … …
The length by which C can be
reduced is found as follows:
Reduction Limit = min { 3, 8} = 3
Hence, crash activity C by 3 days.
1 4
2
3
{FF = 5} A D
C
B
4 10
8
6
0
0
0,5
4
4
19
19
9
9
9,4
4 5
From the critical path calculations,
we have the following information:
 Critical path is still B, C, D.
 Project completion time = 19 days.
 Project cost = 880 + 3*40 = $1000.
 Since the crash limit for critical activity C
is reached, consider activity D with the
next lowest “crash cost per day” for
crash.
Activity (I,j) A (1,3) B (1,2) C (2,3) D (3,4)
Critical … yes yes yes
Free Float 5 … … …
The length by which D can be
reduced is found as follows:
Reduction Limit = min {4, 5} = 4
Although we can reduce D by 4 days, it is only
necessary to reduce it by 1 day to reach our
project completion goal of 18 days.
1 4
2
3
A D
C
B
4 10 9
8
6
0
0
5,0
4
4
18
18
9
9
9,4
4 5
Final Answer
 From the critical path calculations,
we have the following information:
 Critical path is still B, C, D.
 Project completion time = 18 days
 Project cost = 1000 + 1*45 = $1045
Assignment No. 5
1. The ABC Company is considering the
construction of a new factory building.
The following table shows the project
activities, precedence relationships, and
time estimates.
a) Develop a CPM network for this project.
b) Identify the critical path.
c) Compute the total and free floats for the
activities.
Activity Description Immediate
Predecessor(s)
Time
A Problem definition 3
B Preliminary study of costs and
constraints
A 3
C Analysis of problem in existing
building
A 3
D Incorporation of requirements in new
building
C 5
E Detailed drawing of new building B, C 6
F Contractor building a prototype D, E 9
G Cost analysis E 5
H Engineers reviewing feasibility G 3
I Contractor building the factory G, F 5
J Building inspection I, H 6
K Final plant layout J 4
2. Draw a PERT network diagram for a
construction project with the
activity information given on the
next slide.
a) Identify the critical path
b) Determine the probability of
completing the project in two years
(104 weeks)
Duration (Weeks)
Activity Immediate
Predecessor(s)
Optimistic
(a)
Most Likely
(m)
Pessimistic (b)
A - 7 16 28
B A 4 19 25
C A 10 16 37
D B 7 13 37
E B, C 13 19 33
F B 19 22 33
G D, E 4 7 19
H F, G 13 19 49
I B, C 13 25 37
J I, H 7 13 19
End of Chapter 5

Chapter 5 - PERT-CPM

  • 1.
  • 2.
    Definition  A projectis a set of activities to be performed in a specific sequence to completion.  An activity is a task to be executed using time and resources.
  • 3.
    Objectives  The objectiveof project management is to minimize the total project time subject to the resource constraints.  The two techniques widely used in project management are PERT (Project/Program Evaluation and Review Technique) and CPM (Critical Path Method)
  • 4.
    PERT/CPM  Although thetwo terms PERT and CPM are used interchangeably today, historically PERT was based on probabilistic times while CPM was based on deterministic times.  Probabilistic times are uncertain and deterministic is certain meaning with definite interval.
  • 5.
    Network Diagram  Thenetwork diagram represents a project in that it shows the precedence relationships of the activities of the project along with activity times.  The activities which consume time and resources, are represented by arrows. The precedence relationships of the activities are indicated through events (nodes). Events are just points in time, represented by circles.
  • 6.
    Construction of theNetwork (Arrow) Diagram  Consider the following diagram in which activity (i,j) with duration Di,j is represented by an arrow between two events or nodes i (tail) and j (head). Usually the activities are named by letters while events are denoted by numbers. i j Di,j 1 2 D1,2 A
  • 7.
    Dummy Activities  Sometimesin a network diagram it is necessary to use dummy activities, which consume no time or resources, represented by dotted arrows. 1 2 D1,2 A
  • 8.
    Purpose of DummyActivities (a) To represent an activity uniquely: 1 2 A B Both activities A and B are represented by events (1, 2) 2 3 1 dummy B A Activity A = events (1, 3) Activity B = events (1, 2)
  • 9.
    (b) To representprecedence relationships exactly: 3 5 2 4 1 A D B C Both activities C and D are individually preceded by both activities A and B. 1 3 5 4 2 6 Activity C is preceded by both A and B. Activity D is preceded by B only. A C B D
  • 10.
    Example No. 1 Construct a network diagram for a project consisting of the following activities: Activity Immediate Predecessor(s) A … B … C A, B D B E D F C, E G D
  • 11.
    Solution:  F andG are the terminal activities of the project: 1 2 B 3 A C 5 D 4 F G 6 E
  • 12.
    Critical Path Computationsfor CPM  Through computations performed on the network (arrow) diagram (chart), CPM provides the following: (a) Start and completion times for each event (b) Critical and noncritical activities (c) Total float and free float times for activities
  • 13.
    Example No. 2 Suppose the project in Example No. 1 has the following activity times: (a) Find the critical path. (b) What is the project completion time? (c) Compute the total floats (slacks) and free floats for the ac- tivities. Activity Time (Days) A 3 B 4 C 5 D 6 E 7 F 8 G 9
  • 14.
    Solution  The criticalpath computations are performed in two passes---forward and backward pass.  In the forward pass, starting with a time of 0 for the first event, the computations proceed from left to right up to the final event.
  • 15.
    Forward Pass Solution The forward pass computation provides the earliest start (ES) times for the events. These times are entered in squares in the immediate vicinities of the corresponding events.  For any activity (i, j), let ES1 denote the earliest start time of event i. ESi 1 2 ESj Di,j ESj = ESi + Di,j
  • 16.
    Then, in ExampleNo. 2, consider Activity A (1, 2) 1 2 B 0 4 4  ES2 = ES1 + D1,2 = 0 + 4 = 4
  • 17.
    If more thanone activity enters an event:  The earliest start time for the event is computed as follows:  This is because the event cannot start until the entering activities are completed. j in entering i all for D ES ES j i i i j }, { max ,  
  • 18.
    Then, in ExampleNo. 2, consider Event 3  The two entering activities into event 3 are A (1, 3) and Dummy (2, 3): 4 } 0 4 , 3 0 { max } , { max 2 , 1 }, { max 3 , 2 2 3 , 1 1 3 , 3           D ES D ES i D ES ES i i i
  • 19.
    Proceeding in similarfashion, 25 } 8 17 , 9 10 { max } , { max 5 , 4 }, { max 17 } 7 10 , 5 4 { max } , { max 4 , 3 }, { max 10 6 4 6 , 5 4 6 , 4 4 6 , 6 5 , 4 3 5 , 3 3 5 , 5 4 , 2 2 4                          D ES D ES i D ES ES D ES D ES i D ES ES D ES ES i i i i i i This ends the forward pass computations, giving a project completion time of 25 days.
  • 20.
    Backward Pass Solution In the backward pass, starting with the final node, the computations proceed from right to left up to the beginning event.  The backward pass computations provide the latest completion (LC) times for the events. These times are entered in semicircles in the immediate vicinities of the corresponding events. ESi i j ESj Di,j LCi = LCj – Di,j LCi LCj
  • 21.
    Then, in ExampleNo. 2, consider Activity F (5, 6)  LC6 = ES6 = 25  LC5 = LC6 – D5,6 = 25 – 8 = 17 5 6 8 F 25 25 17 17
  • 22.
    If more thanone activity leaves an event,  The latest completion time for that event is computed as follows:  In Example No. 2, consider event 4. The two leaving activities from event 4 are E (4,5) and G (4,6). . }, { min , i leaving j all for D LC LC j i j j i   10 } 9 25 , 7 17 { min } { min 6 , 5 }, { min , 6 , 4 6 , 5 , 4 5 , 4 4           D LC D LC j D LC LC j j j
  • 23.
    Proceeding in similarfashion, 0 } 3 12 , 14 4 { min } , { min 3 , 2 }, { min 4 } 6 10 , 0 12 { min } { min 4 , 3 }, { min 12 5 17 3 , 1 3 2 , 1 2 , 1 1 4 , 2 4 , 3 , 2 3 , 2 2 5 , 3 3 3                          D LC D LC j D LC LC D LC D LC j D LC LC D LC LC j j j j j j This ends the backward pass computations, confirming the project start time of 0.
  • 24.
    Complete Network Diagram After completing the critical path (forward pass and backward pass) computations, the complete network diagram appears in Figure 1 below: 1 2 B 3 A C 5 D 4 F G 6 0 0 9,0 4 12 4,3 4 4 12,4 10 10 10,16 17 17 17,9 25 25 25,19 3 7 8 9 6 4 E 5
  • 25.
    Critical Activity  Anactivity is said to be critical, if and only if it satisfies all the conditions below: 1. ESi = LCi 2. ESj = LCj 3. ESj – ESi = LCj – LCi = Di,j
  • 26.
    Then, in ExampleNo. 2, consider the Criticality Test:  A critical path is a continuous path starting with the first event and ending with the last event.  Example No. 2 indicates the following activities to be critical: B, D, E, and F.  In other words, activities B,D,E, and F form the critical path. In terms of events, 1-2-4-5-6 is the critical path.
  • 27.
  • 28.
    Slack or TotalFloat  The total float for an activity is the difference between its maximum available time (LCj – ESi) and its duration (Di,j).  Slack signifies the time by which an activity can be delayed without delaying the project. A zero slack for an activity indicates that it cannot be delayed without delaying the whole project and hence it is called a critical activity. j i i j j i D ES LC TF Float Total Slack , ,     
  • 29.
    Then, in ExampleNo. 2, consider the total floats for activities C and D:  Activity C has a positive slack indicating it is noncritical. 8 5 4 17 5 , 3 3 5 5 , 3         D ES LC TF C Activity 0 6 4 10 4 , 2 2 4 4 , 2         D ES LC TF D Activity  Activity D has a zero slack indicating it is critical. Similarly the total floats for all the other activities in Example No. 2 can be computed.
  • 30.
    Free Floats  Freefloats are useful in considering project time vs. project cost.  Free float for an activity (i,j) is the difference between its available time (based on earliest start times) and its duration: j i i j j i D ES ES FF , ,   
  • 31.
    Then, in ExampleNo. 2, consider the free floats for activities A and E:  Similarly the free floats for all the other activities in Example No. 2 can be calculated. 0 7 10 17 : 1 3 0 4 : 5 , 4 4 5 5 , 4 3 , 1 1 3 3 , 1               D ES ES FF E Activity D ES ES FF A Activity
  • 32.
    Table 1. CriticalPath Calculations of Example No. 2 Activity (i,j) Duration Di,j ESi LCj ESj Total Float (Slack) TFi,j = LCj -ESi - Di,j Critical Free Float FFi,j = ESj - ESi - Di,j A (1, 3) 3 0 12 4 12 - 0 - 3 = 9 … 4 - 0 - 3 = 1 B (1, 2) 4 0 4 4 4 - 0 - 4 = 0 Yes 4 - 0 - 4 = 0 C (3, 5) 5 4 17 17 17 - 4 - 5 = 8 … 17 - 4 - 5 = 8 D (2, 4) 6 4 10 10 10 - 4 - 6 = 0 Yes 10 - 4 - 6 = 0 E (4, 5) 7 10 17 17 17 - 10 - 7 = 0 Yes 17 - 10 - 7 = 0 F (5, 6) 8 17 25 25 25 -17 - 8 = 0 Yes 25 - 17 - 8 = 0 G (4, 6) 9 10 25 25 25 - 10 - 9 = 6 … 25 -10 - 9 = 6
  • 33.
    Critical Path Computationfor PERT  The network diagrams for PERT and CPM are identical except for the activity times.  In PERT, each activity has the following three time estimates: a = optimistic time estimate under the best of conditions b = pessimistic time estimate under the worst of conditions c = most likely (probable) time estimate under the normal conditions
  • 34.
    Mean and VarianceComputations for PERT  The probabilistic nature of the activity times is described by the beta distribution whose mean and variance are given below: 2 , 2 , ] 6 / ) [( 6 / ) 4 ( ) ( a b Variance m b a D E Mean j i j i      
  • 35.
    Example No. 3 Suppose the following estimates of activity times (days) are provided for Example No. 2 (a) Determine the expected completion time and variance for the project. (b) What is the probability that the project will be completed within 20 days? 25 days? Activity Optimistic (a)Most Likely (m) Pessimistic (b) A 1 3 5 B 3 4 5 C 4 5 6 D 3 5 7 E 5 6 13 F 4 7 10 G 6 8 10
  • 36.
    Solution for Meanand Variance Activity (i,j) Expected Time E(Di,j) Variance σ2i,j A (1, 3) 3 0.4444 B (1, 2) 4 0.1111 C (3, 5) 5 0.1111 D (2, 4) 5 0.4444 E (4, 5) 7 1.7777 F (5, 6) 7 1.0000 G (4, 6) 8 0.4444
  • 37.
    Solution for CriticalPath 1 2 B 3 A C 5 D 4 F G 6 0 0 0,8 4 11 4,3 4 4 11,4 9 9 15,9 16 16 9,16 23 23 23,17 3 7 7 8 5 4 E 5
  • 38.
    Critical path isB, D, E, F. (a) Expected Project Completion Time (b) Probability that the project completion time T ≤ 20 days: 3332 . 3 1 7777 . 1 4444 . 0 1111 . 0 Variance Project 23 7 7 5 4 ) ( ) ( ) ( ) ( ) ( 2 2 2 2                    F T E T E T E T E T E E D B F E D B     83 . 1 3332 . 3 23 ) ( 20      T E K
  • 39.
    Use of theNormal Distribution Table P(T≤20) = P(Z≤C) = P(Z≤-1.64) =0.0505 (from the normal distribution table) Probability that the project completion time T≤25 days: 64 . 1 83 . 1 23 20 ) (        T E K C 83 . 1 23 ) ( 25     T E K
  • 40.
  • 41.
    Use of theNormal Distribution Table P(T≤25) = P(Z≤C) = P(Z≤1.09) =0.8621 (from the normal distribution tables) Therefore, there is a higher probability that the project completes in 25 days than in 20 days. 09 . 1 83 . 1 23 25 ) (       T E K C
  • 42.
  • 43.
    Project Time VS.Project Cost  The normal time for an activity can be reduced by using increased resources.  The limit beyond which an activity time cannot be shortened is known as the crash limit.
  • 44.
    Crash Limit Crash Limit= D – D’ where: D = normal time (duration) D’ = crash time (duration) It can also refer to C for cost on the other hand. Assuming a straight-line cost-duration relationship: Slope = (C’ – C)/(D – D’) = CRASH COST PER UNIT TIME
  • 45.
    Reduction of theProject Completion Time  It can be reduced by reducing the normal times of critical activities. Reducing the critical activity with the minimum cost- duration slope will yield the minimum cost up to the crash limit.  This does not guarantee that the project time will also be reduced by the same length, since the above reduction may have led to the a new critical path.
  • 46.
    Detection of NewCritical Path  To find whether a new critical path may occur, check whether a positive free float of any non-critical activity becomes zero.  By reducing the duration of the critical activity by one time unit, compute the new free floats of the non-critical activities.
  • 47.
    Upon Reducing theDuration  Check which ones have reduced their old positive free floats by one unit.  Of these, the one with the smallest old positive free float gives the positive free float limit. Reduction Limit = min { crash limit, positive free float limit }  Continue to proceed in the above fashion until all critical activities in the latest critical path are at their crash limits.
  • 48.
    Example No. 4 Consider the following arrow diagram with activity times given in days: 1 4 2 3 A D C B 4 10 8 6
  • 49.
    The normal andcrash data for this project are as follows:  Find the critical path  Find the project completion time and the corresponding cost.  If we want to complete the project in 18 days, find the best crash time and cost. Activity Normal Time (Days) Crash Time (Days) Normal Cost ($) Crash Cost ($) A 4 3 80 105 B 6 4 180 250 C 8 5 200 320 D 10 6 350 530
  • 50.
    Solution for theCritical Path 1 4 2 3 {FF = 10} A D C B 4 10 8 6 0 0 10,0 6 6 24 24 14 14 4,14
  • 51.
    Solution (a) Critical Pathis B, C, D. (b) Project completion time = 24 days Project cost = 80 + 180 + 200 + 350 = $810 (c) From the given data, construct the following crash time-cost table: Activity (I,j) Crash Limit (D - D') Crash Cost/Day (C' -C)/(D - D') A(1,3) 4 - 3 = 1 (105 - 80)/(4 - 3) = 25 B(1,20 6 - 4 = 2 (250 - 180)/(6 - 4) = 35 C(2,3) 8 - 5 = 3 (320 - 200)/(8 - 5) = 40 D(3,4) 10 - 6 = 4 (530 - 350)/(10 - 6) = 45
  • 52.
    From the criticalpath calculations, we have the following information:  Since the critical activity B has the lowest “crash cost per day,” it becomes the first candidate for crash. The length by which B can be reduced is found as follows: Reduction Limit = min {crash limit, positive FF limit} = min {2, 10} = 2 Activity (I,j) A (1,3) B (1,2) C (2,3) D (3,4) Critical … yes yes yes Free Float 10 … … …
  • 53.
    Hence, crash activityB by 2 days: 1 4 2 3 {FF = 8} A D C B 4 10 8 6 0 0 8,0 4 4 22 22 12 12 4,12 4
  • 54.
    From the criticalpath calculations, we have the following:  Critical path is still B, C, D.  Project completion time = 22 days  Project cost = 810 + 2*35 = $880  Since the crash limit for critical activity B is reached, consider activity C with the next lowest “crash cost per day” for crash. Activity (I,j) A (1,3) B (1,2) C (2,3) D (3,4) Critical … yes yes yes Free Float 8 … … …
  • 55.
    The length bywhich C can be reduced is found as follows: Reduction Limit = min { 3, 8} = 3 Hence, crash activity C by 3 days. 1 4 2 3 {FF = 5} A D C B 4 10 8 6 0 0 0,5 4 4 19 19 9 9 9,4 4 5
  • 56.
    From the criticalpath calculations, we have the following information:  Critical path is still B, C, D.  Project completion time = 19 days.  Project cost = 880 + 3*40 = $1000.  Since the crash limit for critical activity C is reached, consider activity D with the next lowest “crash cost per day” for crash. Activity (I,j) A (1,3) B (1,2) C (2,3) D (3,4) Critical … yes yes yes Free Float 5 … … …
  • 57.
    The length bywhich D can be reduced is found as follows: Reduction Limit = min {4, 5} = 4 Although we can reduce D by 4 days, it is only necessary to reduce it by 1 day to reach our project completion goal of 18 days. 1 4 2 3 A D C B 4 10 9 8 6 0 0 5,0 4 4 18 18 9 9 9,4 4 5
  • 58.
    Final Answer  Fromthe critical path calculations, we have the following information:  Critical path is still B, C, D.  Project completion time = 18 days  Project cost = 1000 + 1*45 = $1045
  • 59.
    Assignment No. 5 1.The ABC Company is considering the construction of a new factory building. The following table shows the project activities, precedence relationships, and time estimates. a) Develop a CPM network for this project. b) Identify the critical path. c) Compute the total and free floats for the activities.
  • 60.
    Activity Description Immediate Predecessor(s) Time AProblem definition 3 B Preliminary study of costs and constraints A 3 C Analysis of problem in existing building A 3 D Incorporation of requirements in new building C 5 E Detailed drawing of new building B, C 6 F Contractor building a prototype D, E 9 G Cost analysis E 5 H Engineers reviewing feasibility G 3 I Contractor building the factory G, F 5 J Building inspection I, H 6 K Final plant layout J 4
  • 61.
    2. Draw aPERT network diagram for a construction project with the activity information given on the next slide. a) Identify the critical path b) Determine the probability of completing the project in two years (104 weeks)
  • 62.
    Duration (Weeks) Activity Immediate Predecessor(s) Optimistic (a) MostLikely (m) Pessimistic (b) A - 7 16 28 B A 4 19 25 C A 10 16 37 D B 7 13 37 E B, C 13 19 33 F B 19 22 33 G D, E 4 7 19 H F, G 13 19 49 I B, C 13 25 37 J I, H 7 13 19
  • 63.