Downloaded 363 times


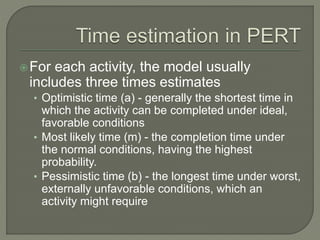
![The expected time for each activity can be
approximated using the following weighted
average
Expected time = (Optimistic + 4 x Most
likely + Pessimistic) / 6
te=(a+4m+b)/6
Variance is [(b – a )/6]2](https://image.slidesharecdn.com/pertandcpm-140523111749-phpapp01/85/Pert-and-CPM-26-320.jpg)


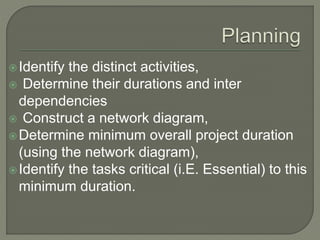
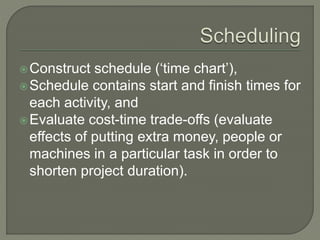
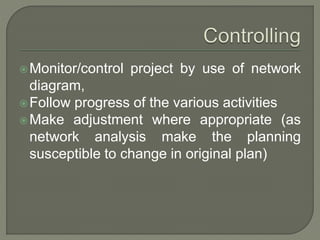
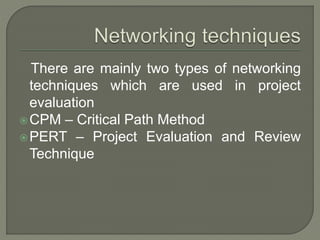
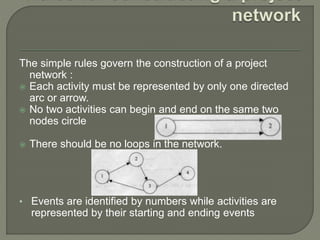
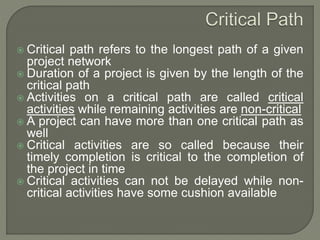
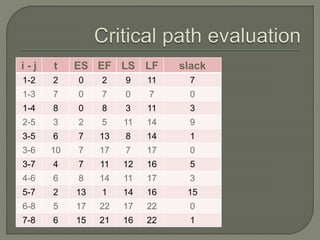
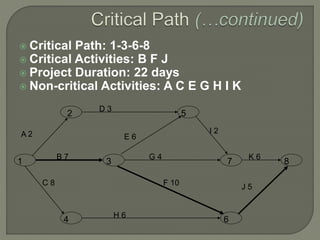
Network analysis techniques like CPM and PERT are useful for planning, scheduling, and controlling projects. They define activities, durations, and dependencies using a network diagram. The critical path is identified as the longest sequence of activities to complete the project. Monitoring progress against the network allows managers to focus on critical tasks and adjust resources if needed to minimize delays. While useful for large projects, activity definitions and time estimates require care to apply these techniques accurately.


