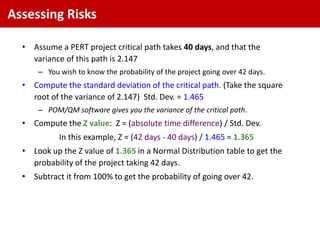
The standard deviation is the square root of the variance, which is 1.465 weeks.
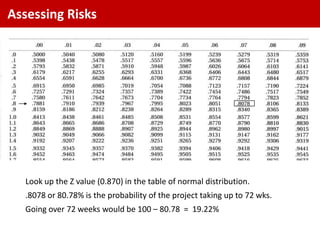
Z = (Target Time - Expected Time) / Standard Deviation
= (42 - 40) / 1.465
= 1.37
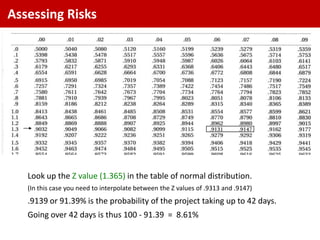
Looking up 1.37 in the standard normal distribution table gives a probability of around 0.085 or 8.5% that the project will take longer than 42 days.