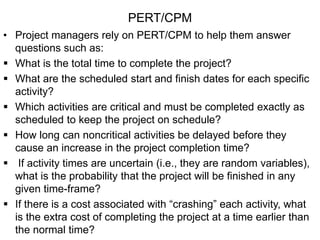
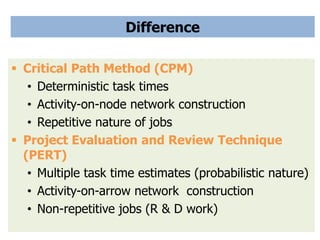
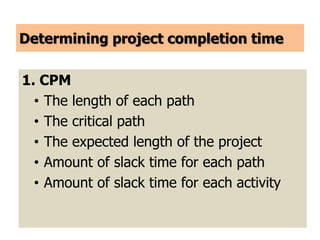
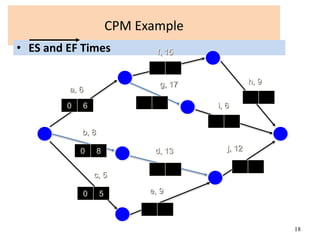
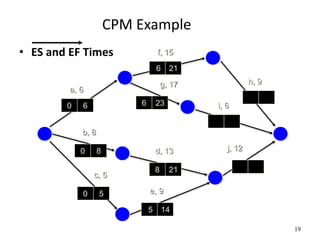
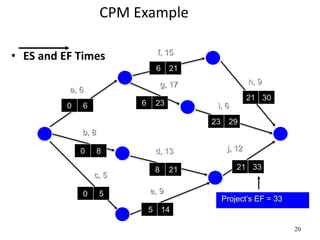
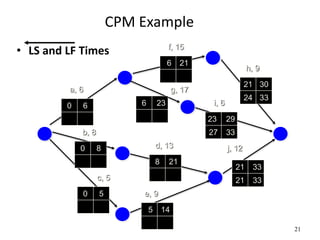
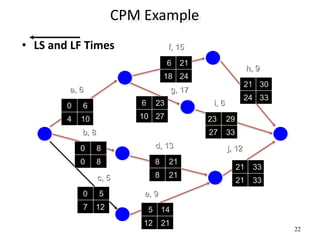
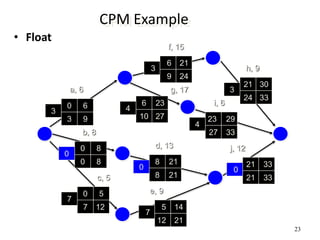
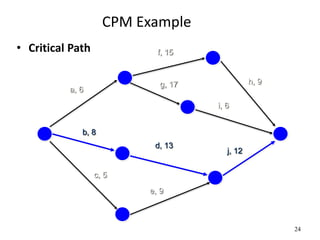
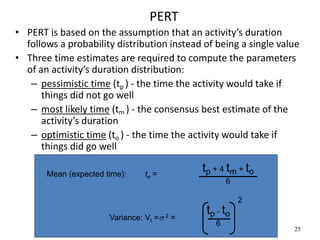
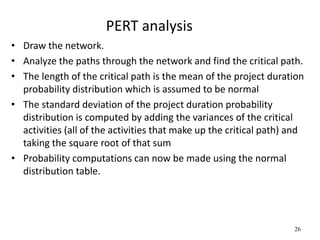
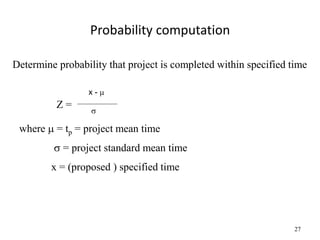
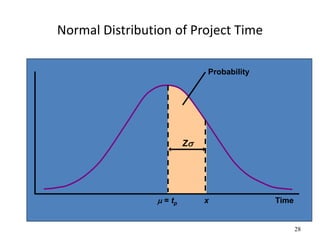
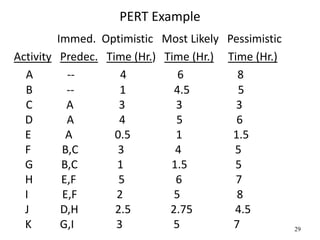
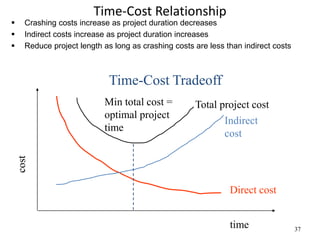
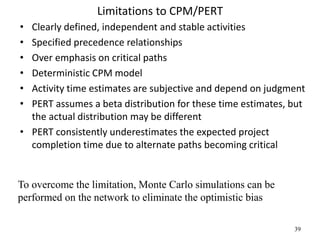
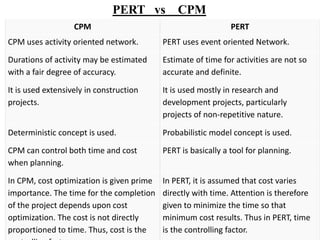
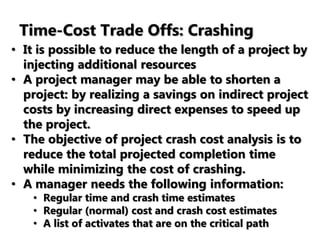
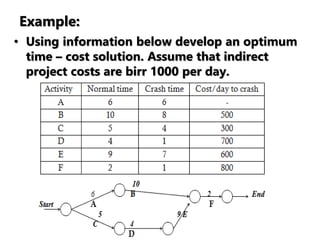
Chapter Six
Network Models and
Project Management
Introduction
• A project is a series of activities designed to
achieve a specific objective, and which has a
definite beginning and a definite end.
• Project life cycle:
• Concept
• Feasibility analysis
• Planning
• Execution
• Termination
PERT AND CPM
• Used techniques for planning and
coordinating large scale projects
 Using PERT and CPM, it is possible to:
• Graphically displays project activities
• Estimates how long the project will take
• Indicates most critical activities
• Show where delays will not affect project
PERT/CPM
• Project managers rely on PERT/CPM to help them answer
questions such as:
 What is the total time to complete the project?
 What are the scheduled start and finish dates for each specific
activity?
 Which activities are critical and must be completed exactly as
scheduled to keep the project on schedule?
 How long can noncritical activities be delayed before they
cause an increase in the project completion time?
 If activity times are uncertain (i.e., they are random variables),
what is the probability that the project will be finished in any
given time-frame?
 If there is a cost associated with “crashing” each activity, what
is the extra cost of completing the project at a time earlier than
the normal time?
5
Difference
 Critical Path Method (CPM)
• Deterministic task times
• Activity-on-node network construction
• Repetitive nature of jobs
 Project Evaluation and Review Technique
(PERT)
• Multiple task time estimates (probabilistic nature)
• Activity-on-arrow network construction
• Non-repetitive jobs (R & D work)
The Network Diagram
 Network diagram is diagram of project activities
that shows sequential relationships by use of
arrows and nodes.
Arrows: Indicate Activity, a time consuming
effort that is required to perform a part of
the work.
Nodes : are represented by a circle
- Indicate Event, a point in time where one or
more activities start and/or finish.
1
2
3
4
5 6
Locate
facilities
Order
furniture
Furniture
setup
Interview
Hire and
train
Remodel
Move in
1
2
3
5
6
Locate
facilities
Order
furniture
Furniture
setup
Interview
Remodel
Move in
4
Hire and
train
7
S
Terms
 Preceding activities: activities which must be
accomplished before a given event can occur
 Succeeding activities: activities which cannot
be accomplished until any event has occurred
 Concurrent activities: activities that can be
accomplished concurrently
 Dummy activities are neither consume time
nor resources
 Merge events
 Burst events
Example: Draw a network diagram
Activity Immediate
Expected time
Predecessor
A -
4
B -
6
C A
EXERCISE
Activity Predecessor Duration (Days)
A - 2
B - 6
C - 4
D A 3
E C 5
F A 4
G B,D,E 2
Determining project completion time
1. CPM
• The length of each path
• The critical path
• The expected length of the project
• Amount of slack time for each path
• Amount of slack time for each activity
13
CPM calculation
 Path
 A connected sequence of activities
leading from the starting event to the
ending event
 Critical Path
 The longest path (time); determines the
project duration
 Critical Activities
 All of the activities that make up the critical
path
14
CPM analysis
 Draw the CPM network
 Analyze the paths through the network
 Determine the float for each activity
 Float = LS - ES = LF – EF
 Float is the maximum amount of time that this activity can
be delay in its completion before it becomes a critical
activity, i.e., delays completion of the project
 Find the critical path is that the sequence of activities and
events where there is no “slack” i.e.. Zero slack
 Find the project duration / minimum project completion
time
 Longest path through a network
15
Forward Pass
 Earliest Start Time (ES)
 Earliest time an activity can start
 ES = maximum EF of immediate predecessors
 Earliest finish time (EF)
 Earliest time an activity can finish
 Earliest start time plus activity time
 EF= ES + t
 Latest Start Time (LS)
 Latest time an activity can start without delaying critical
path time
 LS= LF - t
 Latest finish time (LF)
 latest time an activity can be completed without delaying
critical path time
Backward Pass
Consider below table summarizing the details of a project involving 10
activities
Activity Immediate precedence duration
a - 6
b - 8
c - 5
d b 13
e c 9
f a 15
g a 17
h f 9
i g 6
j d, e 12
Construct the CPM network. Determine the critical path and project
completion time .Also compute total float and free floats for the non-
critical activities
16
17
CPM Example:
• CPM Network
a, 6
f, 15
b, 8
c, 5
e, 9
d, 13
g, 17 h, 9
i, 6
j, 12
18
CPM Example
• ES and EF Times
a, 6
f, 15
b, 8
c, 5
e, 9
d, 13
g, 17 h, 9
i, 6
j, 12
0 6
0 8
0 5
19
CPM Example
• ES and EF Times
a, 6
f, 15
b, 8
c, 5
e, 9
d, 13
g, 17 h, 9
i, 6
j, 12
0 6
0 8
0 5
5 14
8 21
6 23
6 21
20
CPM Example
• ES and EF Times
a, 6
f, 15
b, 8
c, 5
e, 9
d, 13
g, 17 h, 9
i, 6
j, 12
0 6
0 8
0 5
5 14
8 21 21 33
6 23
21 30
23 29
6 21
Project’s EF = 33
21
CPM Example
• LS and LF Times
a, 6
f, 15
b, 8
c, 5
e, 9
d, 13
g, 17
h, 9
i, 6
j, 12
0 6
0 8
0 5
5 14
8 21
21 33
6 23
21 30
23 29
6 21
21 33
27 33
24 33
22
CPM Example
• LS and LF Times
a, 6
f, 15
b, 8
c, 5
e, 9
d, 13
g, 17
h, 9
i, 6
j, 12
0 6
0 8
0 5
5 14
8 21
21 33
6 23
21 30
23 29
6 21
4 10
0 8
7 12
12 21
21 33
27 33
8 21
10 27
24 33
18 24
23
CPM Example
• Float
a, 6
f, 15
b, 8
c, 5
e, 9
d, 13
g, 17
h, 9
i, 6
j, 12
0 6
0 8
0 5
5 14
8 21 21 33
6 23
21 30
23 29
6 21
3 9
0 8
7 12
12 21
21 33
27 33
8 21
10 27
24 33
9 24
3 4
3
3
4
0
0
7
7
0
24
CPM Example
• Critical Path
a, 6
f, 15
b, 8
c, 5
e, 9
d, 13
g, 17 h, 9
i, 6
j, 12
darla/smbs/vit 25
PERT
• PERT is based on the assumption that an activity’s duration
follows a probability distribution instead of being a single value
• Three time estimates are required to compute the parameters
of an activity’s duration distribution:
– pessimistic time (tp ) - the time the activity would take if
things did not go well
– most likely time (tm ) - the consensus best estimate of the
activity’s duration
– optimistic time (to ) - the time the activity would take if
things did go well
Mean (expected time): te =
tp + 4 tm + to
6
Variance: Vt = 2 =
tp - to
6
2
26
PERT analysis
• Draw the network.
• Analyze the paths through the network and find the critical path.
• The length of the critical path is the mean of the project duration
probability distribution which is assumed to be normal
• The standard deviation of the project duration probability
distribution is computed by adding the variances of the critical
activities (all of the activities that make up the critical path) and
taking the square root of that sum
• Probability computations can now be made using the normal
distribution table.
27
Probability computation
Determine probability that project is completed within specified time
Z =
x - 

where  = tp = project mean time
 = project standard mean time
x = (proposed ) specified time
28
Normal Distribution of Project Time
 = tp Time
x
Z
Probability
29
PERT Example
Immed. Optimistic Most Likely Pessimistic
Activity Predec. Time (Hr.) Time (Hr.) Time (Hr.)
A -- 4 6 8
B -- 1 4.5 5
C A 3 3 3
D A 4 5 6
E A 0.5 1 1.5
F B,C 3 4 5
G B,C 1 1.5 5
H E,F 5 6 7
I E,F 2 5 8
J D,H 2.5 2.75 4.5
K G,I 3 5 7
30
PERT Example
A
D
C
B
F
E
G
I
H
K
J
PERT Network
31
PERT Example
Activity Expected Time Variance
A 6 4/9
B 4 4/9
C 3 0
D 5 1/9
E 1 1/36
F 4 1/9
G 2 4/9
H 6 1/9
I 5 1
J 3 1/9
K 5 4/9
32
PERT Example
Activity ES EF LS LF Slack
A 0 6 0 6 0 *critical
B 0 4 5 9 5
C 6 9 6 9 0 *
D 6 11 15 20 9
E 6 7 12 13 6
F 9 13 9 13 0 *
G 9 11 16 18 7
H 13 19 14 20 1
I 13 18 13 18 0 *
J 19 22 20 23 1
K 18 23 18 23 0 *
33
PERT Example
Vpath = VA + VC + VF + VI + VK
= 4/9 + 0 + 1/9 + 1 + 4/9
= 2
path = 1.414
z = (24 - 23)/(24-23)/1.414 = .71
From the Standard Normal Distribution table:
P(z < .71) = .5 + .2612 = .7612
PROJECT COST
35
Cost consideration in project
• Project managers may have the option or requirement to crash
the project, or accelerate the completion of the project.
• This is accomplished by reducing the length of the critical path(s).
• The length of the critical path is reduced by reducing the
duration of the activities on the critical path.
• If each activity requires the expenditure of an amount of money
to reduce its duration by one unit of time, then the project
manager selects the least cost critical activity, reduces it by one
time unit, and traces that change through the remainder of the
network.
• As a result of a reduction in an activity’s time, a new critical path
may be created.
• When there is more than one critical path, each of the critical
paths must be reduced.
• If the length of the project needs to be reduced further, the
process is repeated.
36
Project Crashing
• Crashing
– reducing project time by expending additional resources
• Crash time
– an amount of time an activity is reduced
• Crash cost
– cost of reducing activity time
• Goal
– reduce project duration at minimum cost
37
Time-Cost Relationship
 Crashing costs increase as project duration decreases
 Indirect costs increase as project duration increases
 Reduce project length as long as crashing costs are less than indirect costs
Time-Cost Tradeoff
time
Direct cost
Indirect
cost
Total project cost
Min total cost =
optimal project
time
38
Benefits of CPM/PERT
• Useful at many stages of project management
• Mathematically simple
• Give critical path and slack time
• Provide project documentation
• Useful in monitoring costs
•How long will the entire project take to be completed? What are the risks involved?
•Which are the critical activities or tasks in the project which could delay the entire
project if they were not completed on time?
•Is the project on schedule, behind schedule or ahead of schedule?
•If the project has to be finished earlier than planned, what is the best way to do this
at the least cost?
CPM/PERT can answer the following important
questions:
39
Limitations to CPM/PERT
• Clearly defined, independent and stable activities
• Specified precedence relationships
• Over emphasis on critical paths
• Deterministic CPM model
• Activity time estimates are subjective and depend on judgment
• PERT assumes a beta distribution for these time estimates, but
the actual distribution may be different
• PERT consistently underestimates the expected project
completion time due to alternate paths becoming critical
To overcome the limitation, Monte Carlo simulations can be
performed on the network to eliminate the optimistic bias
40
CPM PERT
CPM uses activity oriented network. PERT uses event oriented Network.
Durations of activity may be estimated
with a fair degree of accuracy.
Estimate of time for activities are not so
accurate and definite.
It is used extensively in construction
projects.
It is used mostly in research and
development projects, particularly
projects of non-repetitive nature.
Deterministic concept is used. Probabilistic model concept is used.
CPM can control both time and cost
when planning.
PERT is basically a tool for planning.
In CPM, cost optimization is given prime
importance. The time for the completion
of the project depends upon cost
optimization. The cost is not directly
proportioned to time. Thus, cost is the
In PERT, it is assumed that cost varies
directly with time. Attention is therefore
given to minimize the time so that
minimum cost results. Thus in PERT, time
is the controlling factor.
PERT vs CPM
Time-Cost Trade Offs: Crashing
• It is possible to reduce the length of a project by
injecting additional resources
• A project manager may be able to shorten a
project: by realizing a savings on indirect project
costs by increasing direct expenses to speed up
the project.
• The objective of project crash cost analysis is to
reduce the total projected completion time
while minimizing the cost of crashing.
• A manager needs the following information:
• Regular time and crash time estimates
• Regular (normal) cost and crash cost estimates
• A list of activates that are on the critical path
Example:
• Using information below develop an optimum
time – cost solution. Assume that indirect
project costs are birr 1000 per day.
End of
Chapter Six

chapter 6.ppt

  • 1.
    Chapter Six Network Modelsand Project Management
  • 2.
    Introduction • A projectis a series of activities designed to achieve a specific objective, and which has a definite beginning and a definite end. • Project life cycle: • Concept • Feasibility analysis • Planning • Execution • Termination
  • 3.
    PERT AND CPM •Used techniques for planning and coordinating large scale projects  Using PERT and CPM, it is possible to: • Graphically displays project activities • Estimates how long the project will take • Indicates most critical activities • Show where delays will not affect project
  • 4.
    PERT/CPM • Project managersrely on PERT/CPM to help them answer questions such as:  What is the total time to complete the project?  What are the scheduled start and finish dates for each specific activity?  Which activities are critical and must be completed exactly as scheduled to keep the project on schedule?  How long can noncritical activities be delayed before they cause an increase in the project completion time?  If activity times are uncertain (i.e., they are random variables), what is the probability that the project will be finished in any given time-frame?  If there is a cost associated with “crashing” each activity, what is the extra cost of completing the project at a time earlier than the normal time?
  • 5.
    5 Difference  Critical PathMethod (CPM) • Deterministic task times • Activity-on-node network construction • Repetitive nature of jobs  Project Evaluation and Review Technique (PERT) • Multiple task time estimates (probabilistic nature) • Activity-on-arrow network construction • Non-repetitive jobs (R & D work)
  • 6.
    The Network Diagram Network diagram is diagram of project activities that shows sequential relationships by use of arrows and nodes. Arrows: Indicate Activity, a time consuming effort that is required to perform a part of the work. Nodes : are represented by a circle - Indicate Event, a point in time where one or more activities start and/or finish.
  • 7.
  • 8.
  • 9.
    Terms  Preceding activities:activities which must be accomplished before a given event can occur  Succeeding activities: activities which cannot be accomplished until any event has occurred  Concurrent activities: activities that can be accomplished concurrently  Dummy activities are neither consume time nor resources  Merge events  Burst events
  • 10.
    Example: Draw anetwork diagram Activity Immediate Expected time Predecessor A - 4 B - 6 C A
  • 11.
    EXERCISE Activity Predecessor Duration(Days) A - 2 B - 6 C - 4 D A 3 E C 5 F A 4 G B,D,E 2
  • 12.
    Determining project completiontime 1. CPM • The length of each path • The critical path • The expected length of the project • Amount of slack time for each path • Amount of slack time for each activity
  • 13.
    13 CPM calculation  Path A connected sequence of activities leading from the starting event to the ending event  Critical Path  The longest path (time); determines the project duration  Critical Activities  All of the activities that make up the critical path
  • 14.
    14 CPM analysis  Drawthe CPM network  Analyze the paths through the network  Determine the float for each activity  Float = LS - ES = LF – EF  Float is the maximum amount of time that this activity can be delay in its completion before it becomes a critical activity, i.e., delays completion of the project  Find the critical path is that the sequence of activities and events where there is no “slack” i.e.. Zero slack  Find the project duration / minimum project completion time  Longest path through a network
  • 15.
    15 Forward Pass  EarliestStart Time (ES)  Earliest time an activity can start  ES = maximum EF of immediate predecessors  Earliest finish time (EF)  Earliest time an activity can finish  Earliest start time plus activity time  EF= ES + t  Latest Start Time (LS)  Latest time an activity can start without delaying critical path time  LS= LF - t  Latest finish time (LF)  latest time an activity can be completed without delaying critical path time Backward Pass
  • 16.
    Consider below tablesummarizing the details of a project involving 10 activities Activity Immediate precedence duration a - 6 b - 8 c - 5 d b 13 e c 9 f a 15 g a 17 h f 9 i g 6 j d, e 12 Construct the CPM network. Determine the critical path and project completion time .Also compute total float and free floats for the non- critical activities 16
  • 17.
    17 CPM Example: • CPMNetwork a, 6 f, 15 b, 8 c, 5 e, 9 d, 13 g, 17 h, 9 i, 6 j, 12
  • 18.
    18 CPM Example • ESand EF Times a, 6 f, 15 b, 8 c, 5 e, 9 d, 13 g, 17 h, 9 i, 6 j, 12 0 6 0 8 0 5
  • 19.
    19 CPM Example • ESand EF Times a, 6 f, 15 b, 8 c, 5 e, 9 d, 13 g, 17 h, 9 i, 6 j, 12 0 6 0 8 0 5 5 14 8 21 6 23 6 21
  • 20.
    20 CPM Example • ESand EF Times a, 6 f, 15 b, 8 c, 5 e, 9 d, 13 g, 17 h, 9 i, 6 j, 12 0 6 0 8 0 5 5 14 8 21 21 33 6 23 21 30 23 29 6 21 Project’s EF = 33
  • 21.
    21 CPM Example • LSand LF Times a, 6 f, 15 b, 8 c, 5 e, 9 d, 13 g, 17 h, 9 i, 6 j, 12 0 6 0 8 0 5 5 14 8 21 21 33 6 23 21 30 23 29 6 21 21 33 27 33 24 33
  • 22.
    22 CPM Example • LSand LF Times a, 6 f, 15 b, 8 c, 5 e, 9 d, 13 g, 17 h, 9 i, 6 j, 12 0 6 0 8 0 5 5 14 8 21 21 33 6 23 21 30 23 29 6 21 4 10 0 8 7 12 12 21 21 33 27 33 8 21 10 27 24 33 18 24
  • 23.
    23 CPM Example • Float a,6 f, 15 b, 8 c, 5 e, 9 d, 13 g, 17 h, 9 i, 6 j, 12 0 6 0 8 0 5 5 14 8 21 21 33 6 23 21 30 23 29 6 21 3 9 0 8 7 12 12 21 21 33 27 33 8 21 10 27 24 33 9 24 3 4 3 3 4 0 0 7 7 0
  • 24.
    24 CPM Example • CriticalPath a, 6 f, 15 b, 8 c, 5 e, 9 d, 13 g, 17 h, 9 i, 6 j, 12
  • 25.
    darla/smbs/vit 25 PERT • PERTis based on the assumption that an activity’s duration follows a probability distribution instead of being a single value • Three time estimates are required to compute the parameters of an activity’s duration distribution: – pessimistic time (tp ) - the time the activity would take if things did not go well – most likely time (tm ) - the consensus best estimate of the activity’s duration – optimistic time (to ) - the time the activity would take if things did go well Mean (expected time): te = tp + 4 tm + to 6 Variance: Vt = 2 = tp - to 6 2
  • 26.
    26 PERT analysis • Drawthe network. • Analyze the paths through the network and find the critical path. • The length of the critical path is the mean of the project duration probability distribution which is assumed to be normal • The standard deviation of the project duration probability distribution is computed by adding the variances of the critical activities (all of the activities that make up the critical path) and taking the square root of that sum • Probability computations can now be made using the normal distribution table.
  • 27.
    27 Probability computation Determine probabilitythat project is completed within specified time Z = x -   where  = tp = project mean time  = project standard mean time x = (proposed ) specified time
  • 28.
    28 Normal Distribution ofProject Time  = tp Time x Z Probability
  • 29.
    29 PERT Example Immed. OptimisticMost Likely Pessimistic Activity Predec. Time (Hr.) Time (Hr.) Time (Hr.) A -- 4 6 8 B -- 1 4.5 5 C A 3 3 3 D A 4 5 6 E A 0.5 1 1.5 F B,C 3 4 5 G B,C 1 1.5 5 H E,F 5 6 7 I E,F 2 5 8 J D,H 2.5 2.75 4.5 K G,I 3 5 7
  • 30.
  • 31.
    31 PERT Example Activity ExpectedTime Variance A 6 4/9 B 4 4/9 C 3 0 D 5 1/9 E 1 1/36 F 4 1/9 G 2 4/9 H 6 1/9 I 5 1 J 3 1/9 K 5 4/9
  • 32.
    32 PERT Example Activity ESEF LS LF Slack A 0 6 0 6 0 *critical B 0 4 5 9 5 C 6 9 6 9 0 * D 6 11 15 20 9 E 6 7 12 13 6 F 9 13 9 13 0 * G 9 11 16 18 7 H 13 19 14 20 1 I 13 18 13 18 0 * J 19 22 20 23 1 K 18 23 18 23 0 *
  • 33.
    33 PERT Example Vpath =VA + VC + VF + VI + VK = 4/9 + 0 + 1/9 + 1 + 4/9 = 2 path = 1.414 z = (24 - 23)/(24-23)/1.414 = .71 From the Standard Normal Distribution table: P(z < .71) = .5 + .2612 = .7612
  • 34.
  • 35.
    35 Cost consideration inproject • Project managers may have the option or requirement to crash the project, or accelerate the completion of the project. • This is accomplished by reducing the length of the critical path(s). • The length of the critical path is reduced by reducing the duration of the activities on the critical path. • If each activity requires the expenditure of an amount of money to reduce its duration by one unit of time, then the project manager selects the least cost critical activity, reduces it by one time unit, and traces that change through the remainder of the network. • As a result of a reduction in an activity’s time, a new critical path may be created. • When there is more than one critical path, each of the critical paths must be reduced. • If the length of the project needs to be reduced further, the process is repeated.
  • 36.
    36 Project Crashing • Crashing –reducing project time by expending additional resources • Crash time – an amount of time an activity is reduced • Crash cost – cost of reducing activity time • Goal – reduce project duration at minimum cost
  • 37.
    37 Time-Cost Relationship  Crashingcosts increase as project duration decreases  Indirect costs increase as project duration increases  Reduce project length as long as crashing costs are less than indirect costs Time-Cost Tradeoff time Direct cost Indirect cost Total project cost Min total cost = optimal project time
  • 38.
    38 Benefits of CPM/PERT •Useful at many stages of project management • Mathematically simple • Give critical path and slack time • Provide project documentation • Useful in monitoring costs •How long will the entire project take to be completed? What are the risks involved? •Which are the critical activities or tasks in the project which could delay the entire project if they were not completed on time? •Is the project on schedule, behind schedule or ahead of schedule? •If the project has to be finished earlier than planned, what is the best way to do this at the least cost? CPM/PERT can answer the following important questions:
  • 39.
    39 Limitations to CPM/PERT •Clearly defined, independent and stable activities • Specified precedence relationships • Over emphasis on critical paths • Deterministic CPM model • Activity time estimates are subjective and depend on judgment • PERT assumes a beta distribution for these time estimates, but the actual distribution may be different • PERT consistently underestimates the expected project completion time due to alternate paths becoming critical To overcome the limitation, Monte Carlo simulations can be performed on the network to eliminate the optimistic bias
  • 40.
    40 CPM PERT CPM usesactivity oriented network. PERT uses event oriented Network. Durations of activity may be estimated with a fair degree of accuracy. Estimate of time for activities are not so accurate and definite. It is used extensively in construction projects. It is used mostly in research and development projects, particularly projects of non-repetitive nature. Deterministic concept is used. Probabilistic model concept is used. CPM can control both time and cost when planning. PERT is basically a tool for planning. In CPM, cost optimization is given prime importance. The time for the completion of the project depends upon cost optimization. The cost is not directly proportioned to time. Thus, cost is the In PERT, it is assumed that cost varies directly with time. Attention is therefore given to minimize the time so that minimum cost results. Thus in PERT, time is the controlling factor. PERT vs CPM
  • 41.
    Time-Cost Trade Offs:Crashing • It is possible to reduce the length of a project by injecting additional resources • A project manager may be able to shorten a project: by realizing a savings on indirect project costs by increasing direct expenses to speed up the project. • The objective of project crash cost analysis is to reduce the total projected completion time while minimizing the cost of crashing. • A manager needs the following information: • Regular time and crash time estimates • Regular (normal) cost and crash cost estimates • A list of activates that are on the critical path
  • 42.
    Example: • Using informationbelow develop an optimum time – cost solution. Assume that indirect project costs are birr 1000 per day.
  • 43.