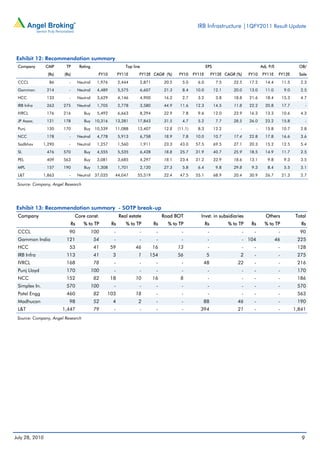
1QFY2011 Result Update | Infrastructure
                                                                                                                                             July 28, 2010


     IRB Infrastructure                                                                            ACCUMULATE
                                                                                                   CMP                                              Rs263
     Performance Highlights                                                                        Target Price                                     Rs275


 Y/E March (Rs cr)       1QFY11        1QFY10       % chg (yoy)         4QFY10     % chg (qoq)     Investment Period                         12 Months
 Net sales                  512.0        414.1             23.6          501.7            2.0
 Operating profit         229.3#         166.2             38.0          231.0           (0.8)     Stock Info
 Net profit                 117.5          81.5            44.2          141.7          (17.1)     Sector                                    Infrastructure
 Source: Company, Angel Research; Note:      #
                                                 Dividend of Rs20cr from SPV is deducted from      Market Cap (Rs cr)                                8,735
 operating profit and has been put under extra-ordinary income                                     Beta                                                1.1
 IRB Infrastructure (IRB) reported consolidated top-line growth below our estimates,               52 Week High / Low                            300/172
 primarily led by below-expectation performance by the construction vertical. The
 operating margin at the consolidated level outperformed our estimates, primarily                  Avg. Daily Volume                                411639
 because of (all time) high construction vertical margins leading to higher-than-                  Face Value (Rs)                                      10
 expected bottom line. Against this backdrop, we prune our estimates. However, given               BSE Sensex                                       17,957
 the robust outlook for the road segment (IRB’s forte) and decent portfolio of BOT
 assets, we maintain our Accumulate rating on the stock.                                           Nifty                                             5,398

 Top line below estimates, higher OPM boost bottom line: IRB reported modest top-line              Reuters Code                                     IRBI.BO
 growth of 23.6% to Rs512cr, well below our expectations of Rs714cr. This was                      Bloomberg Code                                   IRB@IN
 primarily due to modest growth of 20.1% in the construction vertical, against over 50%
 growth in the last four quarters. Management is awaiting commencement nod from
 NHAI on its four road BOT projects, which dampened the construction segment’s top
 line. The consolidated OPM stood at 44.8% (40.1%) against our expectation of 39.7%,               Shareholding Pattern (%)
 aided by an all-time high construction vertical margin of 28.8%. Depreciation costs               Promoters                                          73.9
 were in line with estimates, whereas interest costs came in below our expectation. The
                                                                                                   MF / Banks / Indian Fls                             7.6
 company’s bottom line registered 44.2% growth to Rs117.5cr (Rs81.5cr) against our
 expectation of Rs94.1cr.                                                                          FII / NRIs / OCBs                                  15.4

 Outlook and valuation: NHAI has targeted to award orders worth Rs1lakh cr over the                Indian Public / Others                              3.1
 next one year, in line with the long-term target of achieving 20km a day. We believe if
 NHAI is able to achieve even 50% of its targets, then it would imply abundant
 opportunities for road developers (read IRB). The recent structural changes have also
                                                                                                   Abs. (%)                        3m         1yr      3yr#
 lessened the vagaries in road development. Hence, we are optimistic on the road
 segment. We have valued IRB's business model on an SOTP basis at Rs275, where                     Sensex                          3.3       17.1      1.7
 road BOT SPVs have been valued on an NPV basis (FY2012E) and have accorded a                      IRB                           (6.2)       36.5     39.1
 10% growth premium (Rs154/share) and the construction segment has been valued at                 #Note: Since Listing on February 25,2008
 8x FY2012E EV/EBITDA (Rs113/share). IRB's other investments have been valued at 1x
 FY2010 book value (Rs8/share). We maintain Accumulate on the stock with a Target
 Price of Rs275.

 Key financials (Consolidated)
     Y/E March (Rs cr)                      FY2009        FY2010E        FY2011E     FY2012E
     Net sales                                    992        1,705         2,778        3,580
     % chg                                        35.4           71.9       62.9         28.9
     Adj. net profit                          175.8          385.3         410.2        482.2
     % chg                                        54.4       119.1           6.4         17.6
     EBITDA (%)                                   44.1           46.9       42.2         40.5
     FDEPS (Rs)                                    5.3           11.6       12.3         14.5
     P/E (x)                                      49.7           22.7       21.3         18.1     Shailesh Kanani
     P/BV (x)                                      5.0            4.2        3.6          3.1     022-40403800 Ext:321
     RoE (%)                                      10.5           20.3       18.3         18.5     shailesh.kanani@angeltrade.com

     RoCE (%)                                      8.1           13.2       15.8         13.6
                                                                                                  Aniruddha Mate
     EV/Sales (x)                                 10.9            6.5        4.6          3.9
                                                                                                  022-40403800 Ext:335
     EV/EBITDA (x)                                24.7           14.0       10.8          9.7     aniruddha.mate@angeltrade.com
 Source: Company, Angel Research


Please refer to important disclosures at the end of this report                                                                                          1
IRB Infrastructure |1QFY2011 Result Update


Exhibit 1: 1QFY2011 performance (Consolidated)
                                                                                % chg                     % chg                              % chg
Y/E March (Rs cr)                               1QFY11       1QFY10                       4QFY10                     FY2010    FY2009
                                                                                 (yoy)                    (qoq)                               (yoy)
Income from operations                            512.0        414.1             23.6       501.7           2.0       1,705     991.9         71.9
Total expenditure                                 262.7        248.0              6.0       270.7          (2.9)      905.8     553.1         63.8
                   #
Operating profit                                  229.3        166.2             38.0       231.0          (0.8)      799.1     438.8         82.1
OPM (%)                                            44.8         40.1        470bp            46.0       (120)bp         46.9      44.2      270bp
Interest                                           66.1         46.7             41.5        81.5         (18.8)      249.4     137.7         81.2
Depreciation                                       53.7         37.6             42.6        51.6           4.1       181.9     114.4         59.0
Non-operating income                               21.7         21.5              0.8        11.4          90.7         49.0      28.2        73.8
                                            #          #
Nonrecurring items/dividend from SPVs             20.0           0.0                 -           0.0             -       0.0           -            -
PBT                                               151.2        103.3             46.3       109.4          38.2       416.7     214.9         93.9
Tax                                                30.3         18.2            66.5        (39.3)               -      13.4      37.8       (64.6)
PAT                                               120.8         85.1             41.9       148.7         (18.7)      403.4     177.2        127.7
Share of profits/(losses) of asso.                   0.0         0.0                -            0.0                     0.0           -            -
Share of profits/(losses) of MI                      3.3         3.7             (9.8)           6.9      (52.1)        17.9           -            -
PAT after MI and share of assoc.                  117.5         81.5             44.2       141.7         (17.1)      385.4     177.2        117.5
PAT (%)                                            22.9         19.7                -        28.2                       22.6      17.9
FDEPS (Rs)                                           3.5         2.5             44.2            4.3      (17.1)        11.6       5.3       117.5
                                        #
Source: Company, Angel Research; Note: Dividend of Rs20cr from SPV is deducted from operating profit and has been put under extra-ordinary income


Exhibit 2: 1QFY2011 segmental performance (Consolidated)
Particulars                          1QFY11       1QFY10               % chg        4QFY10              % chg          FY10    FY09          % chg
Construction segment                  330.1         274.9               20.1             312.0             5.8       1,024.2   567.2          80.6
BOT segment                           203.6         160.7               26.7             201.1             1.2        729.7    454.3          60.6
Total income                          533.7         435.6               22.5             513.1             4.0       1,753.8 1,021.5          71.7
Construction segment                   95.2           50.5              88.4              57.8           64.6         200.6    101.3          98.0
BOT segment                           175.8         137.1               28.2             184.6           (4.8)        647.4    365.7          77.1
EBITDA                                271.0         187.7               44.4             242.4           11.8         848.0    467.0          81.6
Construction segment (%)               28.8           18.4         1040bp                 18.5         1030bp          19.6     17.9        170bp
BOT segment (%)                        86.3           85.3          100bp                 91.8         (550)bp         88.7     80.5        820bp
EBITDAM (%)                            50.8           43.1          770bp                 47.2          360bp          48.4     45.7        270bp
Construction segment                    5.9            6.3              (6.1)              4.8           23.1          22.5     10.2         120.3
BOT segment                            60.2           40.5              48.9              76.7          (21.4)        226.8    127.4          78.0
Financial expenses                     66.1           46.7              41.5              81.5          (18.8)        249.4    137.7          81.2
Construction segment                   11.0           12.9           (15.2)               13.2          (16.8)         52.1     20.8         149.9
BOT segment                            42.7           24.7              72.9              38.4           11.3         129.9     93.6          38.8
Depreciation                           53.7           37.6              42.6              51.6             4.1        181.9    114.4          59.0
Construction segment                   78.4           31.3             150.0              39.9           96.6         126.0     70.3          79.3
BOT segment                            72.8           72.0               1.2              69.5             4.8        290.7    144.7         100.9
PBT                                   151.2         103.3               46.3             109.4           38.3         416.7    214.9          93.9
Construction segment                   55.9           25.3             121.0              35.6           57.0         101.2     49.0         106.5
BOT segment                            64.9           59.8               8.4             113.0          (42.6)        302.2    128.2         135.8
PAT                                   120.8           85.1              41.9             148.6          (18.7)        403.4    177.2         127.7
Source: Company, Angel Research


July 28, 2010                                                                                                                                       2
IRB Infrastructure |1QFY2011 Result Update


                                                   Exhibit 3: 1QFY2011 actual vs. Angel estimates
                                                    Particulars                             Estimates                   Actual     Variation (%)
                                                     Revenue                                   714.2                    533.7             (25.3)
                                                     Construction segment                      503.2                    330.1             (34.4)
                                                     Road BOT segment                          211.0                    203.6              (3.5)
                                                     EBITDA margin (%)                              39.7                  48.7            900bp
                                                     Construction segment                           18.5                  28.8          1,034bp
                                                     Road BOT segment                               90.2                  86.3          (386)bp
                                                     PAT                                            94.1                117.5               24.8
                                                     Construction segment                           45.8                  55.9              22.1
                                                     Road BOT segment                               48.3                  64.9              34.3
                                                    Source: Company, Angel Research


Exhibit 4: Road BOT project-wise toll revenue growth
 Project Name                               1QFY11 1QFY10              % chg 4QFY10          % chg(qoq) FY2010         FY2009 % chg(yoy)
               ^
 Surat Dahisar                                  88.2        77.8         13.4      90.7            (2.8) 333.7             33.6        893.2
 Mumbai- Pune                                   80.2        76.4          5.0      76.1              5.4 306.3           288.0            6.4
 Thane Bhiwandi Bypass                          13.3        11.2         18.8      13.0              2.3     47.2          40.3          17.1
 Thane Ghodbunder                                 7.2         6.9         4.3        7.0             2.9     27.7          26.5           4.5
 Pune - Nashik                                    4.8         4.2        14.3        4.8                -    18.1          16.4          10.4
 Pune - Sholapur                                  3.6         3.6            -       3.5             2.9     13.3          12.7           4.7
 Nagar Karmala Tembhurni                          3.8         2.9        31.0        3.6             5.6     13.5          11.3          19.5
 Mohol Mandrup Kamtee                             1.7         1.7            -       1.4           21.4        6.3          6.5          (3.1)
 Kharpada Bridge                                  1.9         1.8         5.6        1.8             5.6       6.7          7.1          (5.6)
 Bharuch Surat ^^                               29.8             -           -     31.7            (6.0)     66.3              -             -
 Kaman Paygaon **                                    -        0.9            -          -               -      2.2          3.6        (38.9)
 Khambatki Ghat *                                    -        1.2            -          -               -      1.2         13.1        (90.8)
 Bhiwandi Wada #                                     -           -           -          -               -         -         1.6              -
 Total                                         234.5       188.6         24.3     233.6              0.4 842.5           460.7           82.9
Source: Company, Angel Research; Note: * Concession period of Khambatki Ghat BOT project ended on May 3, 2009, # Concession period of Bhiwandi
                                                                                                    ^^
Wada BOT project ended on September 22, 2008, ^ Surat-Dahisar commissioned on February 20,2009,          Bharuch Surat BOT Project commissioned on
September 25,2009, ** Kaman-Paygaon BOT Project concession period stopped from November 22, 2009.


July 28, 2010                                                                                                                                  3
IRB Infrastructure |1QFY2011 Result Update


                                                          Top line below estimates
                                                          IRB reported modest top-line growth of 23.6% to Rs512cr, well below our
                                                          expectations of Rs714cr. This was primarily due to modest growth of 20.1% in the
                                                          construction vertical, against over 50% growth in the last four quarters.
                                                          Management is awaiting commencement nod from NHAI on its four road BOT
                                                          projects, which dampened the construction segment’s top line during the quarter.
                                                          The consolidated OPM stood at 44.8% (40.1%) against our expectation of 39.7%,
                                                          aided by an all-time high construction vertical margin of 28.8%.
                                                          IRB’s current order book at Rs7,431cr (excluding O&M orders) provides revenue
                                                          visibility for its construction arm.


Exhibit 5: Quarterly revenue trend                                                 Exhibit 6: Quarterly EBITDA trend
  600                                                                 90.0
                                                                                       300.0                                                                                                                            60.0
                                         81.1                                                                                                                              52.4                           48.7
                  80.0                                                80.0                          49.5                                                     49.1
  500                        76.5                                                      250.0
                                                                                                                                                                                      46.0
                                                                                                                                                                                                                        50.0
                                                                      70.0                                     42.5
                                                                                                                            37.5               40.1
  400                                                                 60.0             200.0                                                                                                                            40.0
                                                   56.3
                                                                      50.0             150.0                                                                                                                            30.0
  300
                                                                      40.0             100.0                                                                                                                            20.0
  200                                                                 30.0                  50.0                                                                                                                        10.0
                                                              23.6
                                                                      20.0
  100                                                                                         -                                                                                                                         -
                                                                      10.0
                                                                                                      2QFY09


                                                                                                                3QFY09


                                                                                                                             4QFY09


                                                                                                                                                1QFY10


                                                                                                                                                               2QFY10


                                                                                                                                                                             3QFY10


                                                                                                                                                                                        4QFY10


                                                                                                                                                                                                           1QFY11
     0                                                                -
         1QFY10       2QFY10     3QFY10    4QFY10      1QFY11
                                                                                                                          EBITDA (Rs cr, LHS)                           EBITDAM (%, RHS)
                Net Sales (Rs cr, LHS)          Growth (yoy %, RHS)


Source: Company, Angel Research                                                    Source: Company, Angel Research


                                                          …higher OPM boosts bottom line

                                                          IRB’s operating margin at the consolidated level outperformed our estimates,
                                                          primarily on account of (all time) high construction vertical margins leading to
                                                          higher-than-expected bottom line. Depreciation costs were in line with our
                                                          estimates, whereas interest costs came in below our expectations. Bottom line
                                                          registered 44.2% growth to Rs117.5cr (Rs81.5cr) against our expectation of
                                                          Rs94.1cr.

                                                          Exhibit 7: Quarterly bottom-line trend
                                                                                                                                                                          28.2
                                                            160                                                                                                                                                     30.0
                                                            140                                                                                                                            22.9
                                                                                                                                 20.9                     22.0                                                      25.0
                                                            120           20.4                                 19.7
                                                            100                    16.0                                                                                                                             20.0
                                                             80                                    13.6                                                                                                             15.0
                                                             60                                                                                                                                                     10.0
                                                             40
                                                             20                                                                                                                                                     5.0
                                                              0                                                                                                                                                     -
                                                                          2QFY09


                                                                                   3QFY09


                                                                                                   4QFY09


                                                                                                                 1QFY10


                                                                                                                                      2QFY10


                                                                                                                                                           3QFY10


                                                                                                                                                                             4QFY10


                                                                                                                                                                                                 1QFY11


                                                                                                   PAT (Rs cr, LHS)                                      PATM (%, RHS)


                                                          Source: Company, Angel Research


July 28, 2010                                                                                                                                                                                                                  4
IRB Infrastructure |1QFY2011 Result Update


                                                      Outlook and Valuation
                                                      NHAI has targeted to award orders worth Rs1lakh cr over the next one year, in line
                                                      with the long-term target of achieving 20km a day. We believe if NHAI is able to
                                                      achieve even 50% of its targets, then it would imply abundant opportunities for
                                                      road developers (read IRB). Further, the recent structural changes have also
                                                      lessened the vagaries in road development. Hence, we are optimistic on the road
                                                      segment. IRB has one of the largest domestic BOT project portfolios in the road
                                                      and highway sector comprising 17 projects. In light of the immense opportunities
                                                      that exist in the road sector in the near future along with IRB’s vast experience and
                                                      mutually dependent business model, we maintain our bullish stance on the
                                                      company. Moreover, IRB’s construction arm has a robust order book of Rs7,431cr
                                                      (excluding O&M orders) (7.2x FY2010 revenue), which lends high revenue
                                                      visibility.

                                                      Rationale for change in estimates

                                                      Modern Road Makers Private Limited (MRMPL), the construction arm of IRB,
                                                      reported 1QFY2011 top line below our estimates, primarily on account of the
                                                      recently secured road BOT projects (Goa-Karnataka, Pathankot-Amritsar, Jaipur-
                                                      Deol and Talegoan-Amravati) not commencing construction activity. These projects
                                                      with a project capitalisation of ~Rs4,300cr are to be executed over 30 months.
                                                      Management is awaiting clearance from NHAI to commence with the construction
                                                      work and expects revenue booking to a certain extent from these projects in
                                                      2QFY2011 and 3QFY2011.

                                                      In line with the management’s guidance, we have factored in delays in the
                                                      commencement of construction activity in these four road BOT projects and expect
                                                      construction to begin by 3QFY2011. Accordingly, for the full year, we have cut our
                                                      construction top-line estimates by 23.5% and 12.0%, respectively, for FY2011E
                                                      and FY2012E. Management expects to maintain construction vertical margins at
                                                      around ~20% going ahead, which we think is achievable and accordingly factor in
                                                      our assumptions, leading to a revision in margin estimates. However, delay in
                                                      construction commencement will eventually have a cascading effect in the
                                                      commencement of tolling going ahead. Hence, we factor a delay of six months in
                                                      tolling and expect tolling to commence from the beginning of 2HFY2014 as
                                                      against FY2014, which gets captured in our NPV computations for these four
                                                      projects. Accordingly, NPV/share for the four projects gets revised downwards.


Exhibit 8: Change in estimates
                                                       FY2011E                                                 FY2012E
       Parameters                 Earlier estimates    Revised estimates                   Earlier estimates Revised estimates
                                                                           Variation (%)                                         Variation (%)
Revenue (Rs cr)                       3,352.1               2,777.7                            3,915.6           3,579.8
                                                                              (17.1)                                                 (8.6)
Construction(Rs cr)                   2,432.0               1,860.2                            2,790.3           2,454.5
                                                                              (23.5)                                                (12.0)
Road BOT segment(Rs cr)                917.5                 917.5                             1,125.3           1,125.3
                                                                                 -                                                     -
EBITDA margin (%)                       37.3                 42.2                               38.0               40.5
                                                                              490bp                                                 250bp
PAT(Rs cr)                             459.2                 410.2                              508.0             482.2
                                                                              (10.7)                                                 (5.1)
Source: Company, Angel Research


July 28, 2010                                                                                                                                5
IRB Infrastructure |1QFY2011 Result Update


                                                       We have valued IRB's business model on an SOTP basis at Rs275, where road BOT
                                                       SPVs have been valued on NPV basis (FY2012E) and have accorded a 10% growth
                                                       premium (Rs154/share) and the construction segment has been valued at 8x
                                                       FY2012E EV/EBITDA (Rs113/share). IRB's other investments have been valued at 1x
                                                       FY2010 book value (Rs8/share). We maintain Accumulate on the stock with a
                                                       Target Price of Rs275.


Exhibit 9: SOTP valuation summary
Business segment                                     Methodology          Rs cr       IRB's stake(%)           Rs/share            % to target price
4 BOT Projects                                                FCFE         270                  100                  8.1                        3.0
Kharpada Bridge                                               FCFE           29                 100                  0.9                        0.3
Nagar-Karmala Tembhurni                                       FCFE           69                 100                  2.1                        0.8
Mohol-Mandup-Kamtee                                           FCFE           41                 100                  1.2                        0.5
Pune-Solapur                                                  FCFE           95                 100                  2.9                        1.0
Pune-Nashik                                                   FCFE         157                  100                  4.7                        1.7
Mumbai-Pune                                                   FCFE       1,611                  100                48.5                        17.6
Thane Ghodbunder                                              FCFE         262                  100                  7.9                        2.9
Surat Dahisar                                                 FCFE         178                   90                  4.8                        1.8
Bharuch-Surat                                                 FCFE         624                  100                18.8                         6.8
IRDP Kolhapur                                                 FCFE         501                  100                15.1                         5.5
Goa Karnataka Border                                          FCFE         203                  100                  5.7                        2.1
Pathankot-Amritsar                                            FCFE         255                  100                  6.4                        2.3
Jaipur Deoli                                                  FCFE         458                  100                  8.4                        3.1
Talegaon-Amravati                                             FCFE         237                  100                  4.3                        1.6
Total Road BOT Asset Portfolio Valuation                                                                          139.6
Value post 10% growth premium                                                                                     153.5
Modern Road Makers Pvt. Ltd.                            EV/EBITDA        3,871                  100               113.2                        41.2
Land Parcel Valuation                                  Book Value          135                   66                  2.7                        1.0
Sindhudurg Airport Project                             Book Value          175                  100                  5.3                        1.9
Total                                                                                                             274.7                        100
Source: Company, Angel Research; Note: We have used cost of equity as 12.7% for computing net present values for the road BOT projects


July 28, 2010                                                                                                                                      6
IRB Infrastructure |1QFY2011 Result Update


Exhibit 10: Key assumptions
                                                    Traffic growth                    Toll hike          Interest
Road project
                                                           rate (%)                    p.a. (%)              rate
4 BOT Projects                                                 7.0                          6.0              N.A
Kharpada Bridge                                                8.0                         6.0              N.A.
Nagar-Karmala Tembhurni                                        7.0                         6.0              N.A.
Mohol-Mandup-Kamtee                                            7.0                         6.0              N.A.
Pune-Solapur                                                   7.0                         6.0              N.A.
Pune-Nashik                                                    7.0                         6.0              N.A.
Mumbai-Pune                                                    8.0           18 (every 3 years)             11.0
Thane Ghodbunder                                               7.0                         6.0               N.A
Surat Dahisar                                                  8.0                         6.0              12.3
Bharuch-Surat                                                  7.0                         6.0              11.5
IRDP Kolhapur                                                  7.0                         6.0              11.5
Goa Karnataka Border                                           7.0                         6.0              12.0
Pathankot-Amritsar                                             7.0                         6.0              12.0
Jaipur Deoli                                                   7.0                         6.0              12.0
Talegaon-Amravati                                              7.0                         6.0              12.0
Source: Company, Angel Research


                                  Exhibit 11: Angel EPS forecast v/s consensus
                                                         Angel forecast       Bloomberg consensus    Variation (%)
                                  FY2011E                         13.8                       14.6              5.5
                                  FY2012E                         15.3                       16.4              7.2
                                  Source: Company, Angel Research


July 28, 2010                                                                                                   7
IRB Infrastructure |1QFY2011 Result Update


                Investment Arguments

                Vast opportunity in the road sector       IRB the prime beneficiary: IRB has some of
                the very high-density, strategically aligned road stretched in its gamut. These high-
                density stretches reduce the average payback period for a typical road BOT
                project. The Government of India is aggressively focusing on road development
                and expects awarding of road BOT projects worth Rs1lakh cr in FY2011, after a
                dismal award activity in FY2009. About 34% of this proposed investment is
                expected to come through the private sector, and we believe that this is where IRB
                stands to benefit. Moreover, of the 2,986km awarded till February 2010, IRB has
                been the forerunner by securing 12.8% of the projects.

                Infrastructure and economy-linked play: IRB has an interdependent business model
                wherein, the internal construction arm, MRMPL undertakes EPC work relating to
                secured road BOT projects. While the time-bound construction work of secured
                road BOT projects lends revenue visibility for the construction arm, any prior
                completion of construction work ushers in revenue upsides from the road BOT (toll)
                segment. Revenue from the toll segment is moreover linked with traffic intensity
                (and pre-determined toll rate hikes), which is directly co-related with the economic
                well being. (Elasticity of traffic to GDP stands at 1.25x). Thus, the company’s
                interdependent business model and the expected improved economic scenario
                lend revenue predictability for IRB. The positives of the business model and net
                debt to equity at 1.2x reflect in the company’s strong operating cash flows, thereby
                alleviating possible concerns over equity funding for new road BOT projects in
                future.


July 28, 2010                                                                                      8
IRB Infrastructure |1QFY2011 Result Update


Exhibit 12: Recommendation summary
 Company        CMP      TP      Rating                     Top line                                        EPS                              Adj. P/E                OB/
                 (Rs)   (Rs)                FY10         FY11E     FY12E CAGR (%)          FY10     FY11E        FY12E CAGR (%)    FY10       FY11E     FY12E        Sale
 CCCL            86        -    Neutral     1,976        2,444         2,871        20.5     5.0      6.0          7.5     22.5    17.2        14.4         11.5     2.3
 Gammon         214        -    Neutral     4,489        5,575         6,607        21.3     8.4     10.0         12.1     20.0    13.0        11.0          9.0     2.5
 HCC            133        -    Neutral     3,629        4,146         4,900        16.2     2.7      3.2          3.8     18.8    21.6        18.4         15.3     4.7
 IRB Infra      263     275     Neutral     1,705        2,778         3,580        44.9    11.6     12.3         14.5     11.8    22.2        20.8         17.7          -
 IVRCL          176     216        Buy      5,492        6,663         8,294        22.9     7.8      9.6         12.0     23.9    16.3        13.3         10.6     4.3
 JP Assoc.      121     178        Buy     10,316    13,281       17,843            31.5     4.7      5.2          7.7     28.5    26.0        23.2         15.8          -
 Punj           130     170        Buy     10,539    11,088       13,407            12.8   (11.1)     8.3         12.2        -          -     15.8         10.7     2.8
 NCC            178        -    Neutral     4,778        5,913         6,758        18.9     7.8     10.0         10.7     17.4    22.8        17.8         16.6     3.6
 Sadbhav       1,290       -    Neutral     1,257        1,560         1,911        23.3    43.0     57.5         69.5     27.1    20.3        15.2         12.5     5.4
 SI.            476     570        Buy      4,555        5,535         6,428        18.8    25.7     31.9         40.7     25.9    18.5        14.9         11.7     2.5
 PEL            409     563        Buy      3,081        3,685         4,297        18.1    23.4     31.2         32.9     18.6    13.1          9.8         9.3     3.5
 MPL            157     190        Buy      1,308        1,701         2,120        27.3     5.8      6.4          9.8     29.8     9.3          8.4         5.5     3.1
 L&T           1,863       -    Neutral    37,035    44,047       55,519            22.4    47.5     55.1         68.9     20.4    30.9        26.7         21.3     2.7

 Source: Company, Angel Research


Exhibit 13: Recommendation summary - SOTP break-up
 Company                       Core const.               Real estate                Road BOT           Invst. in subsidiaries                  Others              Total
                           Rs      % to TP          Rs      % to TP            Rs     % to TP               Rs           % to TP    Rs         % to TP                Rs
 CCCL                      90             100        -             -            -            -               -                 -     -                  -            90
 Gammon India            121               54        -             -            -            -               -                 - 104                   46           225
 HCC                       53              41       59           46            16          13                -                 -     -                  -           128
 IRB Infra               113               41       3              1       154             56               5                 2      -                  -           275
 IVRCL                   168               78        -             -            -            -          48                   22      -                  -           216
 Punj Lloyd              170              100        -             -            -            -               -                 -     -                  -           170
 NCC                     152               82       18           10            16           8                -                 -     -                  -           186
 Simplex In.             570              100        -             -            -            -               -                 -     -                  -           570
 Patel Engg              460               82   103              18             -            -               -                 -     -                  -           563
 Madhucon                  98              52       4              2            -            -          88                   46      -                  -           190
 L&T                    1,447              79        -             -            -            -         394                   21      -                  -          1,841
 Source: Company, Angel Research


July 28, 2010                                                                                                                                                         9
IRB Infrastructure |1QFY2011 Result Update


                Profit & loss statement (Consolidated)
                Y/E March (Rs cr)                FY2008   FY2009   FY2010       FY2011E    FY2012E
                Net sales                         732.7    991.9   1,705.0       2,777.7    3,579.8
                Other operating income                -        -            -          -          -
                Total operating income            732.7    991.9   1,705.0       2,777.7    3,579.8
                % chg                             139.7     35.4      71.9          62.9       28.9
                Total expenditure                 320.8    554.5     906.0       1,605.5    2,130.0
                Net raw materials                 158.9    305.4     450.0        838.9     1,127.6
                Other mfg. costs                   39.2     57.0     122.0        165.3      221.9
                Personnel                          95.3    134.5     284.0        445.8      583.5
                Other                              27.4     57.6      50.0        155.5      196.9
                EBITDA                            411.9    437.4     799.0       1,172.2    1,449.8
                % chg                             148.9      6.2      82.7          46.7       23.7
                (% of net sales)                   56.2     44.1      46.9          42.2       40.5
                Depreciation                      101.6    114.4     181.9        216.6      365.8
                EBIT                              310.3    323.0     617.1        955.6     1,084.0
                % chg                             174.8      4.1      91.0          54.9       13.4
                (% of net sales)                   42.3     32.6      36.2          34.4       30.3
                Interest & other charges          195.8    137.7     249.4        418.4      462.3
                Other income                       52.0     29.6      49.0         23.6       43.4
                (% of PBT)                         31.2     13.8      11.7           4.2        6.5
                Share in profit of associates         -        -            -          -          -
                Recurring PBT                     166.5    214.9     416.6        560.8      665.1
                % chg                             273.4     29.1      93.8          34.6       18.6
                Extraordinary expense/(Inc.)          -        -            -          -          -
                PBT (reported)                    166.5    214.9     416.6        560.8      665.1
                Tax                                40.0     37.8      13.4        150.6      182.9
                (% of PBT)                         24.0     17.6       3.2          26.9       27.5
                PAT (reported)                    126.5    177.2     403.3        410.2      482.2
                Add: Share of earnings of ass.        -        -            -          -          -
                Less: Minority interest (MI)       12.6      1.3      17.9             -          -
                Prior period items                    -        -            -          -          -
                PAT after MI (reported)           113.9    175.8     385.3        410.2      482.2
                ADJ. PAT                          113.9    175.8     385.3        410.2      482.2
                % chg                             403.9     54.4     119.1           6.4       17.6
                (% of net sales)                   15.5     17.7      22.6          14.8       13.5
                Basic EPS (Rs)                      4.2      5.3      11.6         12.3       14.5
                Fully diluted EPS (Rs)              4.2      5.3      11.6         12.3       14.5
                % chg                             357.3     26.6     119.2           6.4       17.6


July 28, 2010                                                                                   10
IRB Infrastructure |1QFY2011 Result Update


                Balance sheet (Consolidated)
                Y/E March (Rs cr)           FY2008       FY2009       FY2010E       FY2011E       FY2012E
                SOURCES OF FUNDS
                Equity share capital          332.4        332.4         332.4         332.4         332.4
                Preference capital                   -            -             -             -             -
                Reserves & surplus            1,288        1,398         1,733         2,077         2,476
                Shareholders’ funds           1,621        1,730         2,066         2,409         2,808
                Minority interest               28           60            60            60            60
                Total loans                   2,021        2,486         2,880         4,569         5,966
                Deferred tax liability           3           18            18            18            18
                Total liabilities             3,673        4,294         5,024         7,057         8,852
                APPLICATION OF FUNDS
                Gross block                   2,219        2,460         3,386         4,995         8,025
                Less: Acc. depreciation        334          444           602           818          1,184
                Net block                     1,885        2,016         2,784         4,177         6,841
                Capital work-in-progress       889         1,455         1,233         1,554          479
                Goodwill                             -            -             -             -             -
                Investments                    198          111           111           111           111
                Current assets                 959         1,033         1,446         1,990         2,478
                Cash                           522          415           467           633           641
                Loans & advances               375          399           546           653           877
                Other                           62          218           434           704           959
                Current liabilities            260          321           551           775          1,056
                Net current assets             699          712           895          1,215         1,422
                Mis. exp. not written off        2            1                 -             -             -
                Total assets                  3,673        4,294         5,024         7,057         8,852


July 28, 2010                                                                                          11
IRB Infrastructure |1QFY2011 Result Update


                Cash flow statement (Consolidated)
                Y/E March (Rs cr)             FY2008    FY2009    FY2010E    FY2011E     FY2012E
                Profit before tax              166.5     214.9      416.6       560.8       665.1
                Depreciation                   101.6     114.4      181.9       216.6       365.8
                Change in working capital       41.9     120.0      132.0       153.1       198.5
                Less: Other income              52.0      29.6       49.0        23.6        43.4
                Direct taxes paid               40.0      37.8       13.4       150.6       182.9
                Cash flow from operations      134.2     141.9      404.3       450.0       606.1
                (Inc.)/Dec. in fixed assets   (433.1)   (806.9)    (705.0)   (1,929.7)   (1,954.4)
                (Inc.)/Dec. in Investments    (156.8)     87.3           -           -           -
                Other income                    52.0      29.6       49.0        23.6        43.4
                Cash flow from investing      (537.9)   (690.1)    (656.0)   (1,906.1)   (1,911.0)
                Issue of equity               1,089.9     (1.3)          -           -           -
                Inc./(Dec.) in loans          (496.7)    464.6      394.5     1,688.9     1,396.3
                Dividend paid (incl. tax)         3.0     65.2       49.9        66.5        83.1
                Others                          63.2      42.6      (41.0)           -           -
                Cash flow from financing       653.5     440.7      303.6     1,622.4     1,313.3
                Inc./(Dec.) in cash            249.9    (107.4)      51.9       166.3         8.4
                Opening cash balances          272.3     522.1      414.7       466.6       632.9
                Closing cash balances          522.1     414.7      466.6       632.9       641.3


July 28, 2010                                                                                  12
IRB Infrastructure |1QFY2011 Result Update


                Key Ratios
                Y/E March                                FY2008 FY2009 FY2010E FY2011E FY2012E
                Valuation ratio (x)
                P/E (on FDEPS)                             76.7   49.7    22.7    21.3    18.1
                P/CEPS                                     40.5   30.1    15.4    13.9    10.3
                P/BV                                        5.4    5.0     4.2     3.6     3.1
                Dividend yield (%)                          0.0    0.6     0.5     0.6     0.6
                EV/Sales                                   14.0   10.9     6.5     4.6     3.9
                EV/EBITDA                                  24.9   24.7    14.0    10.8     9.7
                EV/Total assets                             2.8    2.5     2.2     1.8     1.6
                Per share data (Rs)
                EPS (Basic)                                 3.4    5.3    11.6    12.3    14.5
                EPS (fully diluted)                         3.4    5.3    11.6    12.3    14.5
                Cash EPS                                    6.5    8.7    17.1    18.9    25.5
                DPS                                         0.0    1.5     1.2     1.7     1.7
                Book value                                 48.8   52.1    62.1    72.5    84.5
                DuPont analysis
                EBIT margin                                42.3   32.6    36.2    34.4    30.3
                Tax retention ratio                        76.0   82.4    96.8    73.1    72.5
                Asset turnover (x)                          0.3    0.3     0.4     0.5     0.5
                ROIC (post-tax)                             8.1    7.6    14.2    12.7    10.7
                Cost of debt (post-tax)                     6.6    5.0     9.0     8.2     6.4
                Leverage (x)                                3.3    1.1     1.2     1.4     1.8
                Operating RoE                              13.4   10.3    20.3    19.1    18.5
                Returns (%)
                ROCE (Pre-tax)                              9.3    8.1    13.2    15.8    13.6
                Angel RoIC (Pre-tax)                       14.3   13.8    21.5    23.3    17.2
                RoE                                        11.4   10.5    20.3    18.3    18.5
                Turnover ratios (x)
                Asset turnover (gross block)                0.3    0.4     0.6     0.7     0.5
                Inventory/Sales (days)                      15      47     66      71      81
                Receivables (days)                          39       5       4       4       4
                Payables (days)                            118      77     71      64      70
                Working capital cycle (ex-cash) (days)      78      87     78      66      69
                Solvency ratios (x)
                Net debt to equity                          0.9    1.2     1.2     1.6     1.9
                Net debt to EBITDA                          3.6    4.7     3.0     3.4     3.7
                Interest coverage (EBIT/Interest)           1.6    2.3     2.5     2.3     2.3


July 28, 2010                                                                              13
IRB Infrastructure |1QFY2011 Result Update


  Research Team Tel: 022 - 4040 3800                E-mail: research@angeltrade.com                   Website: www.angeltrade.com

  DISCLAIMER
  This document is solely for the personal information of the recipient, and must not be singularly used as the basis of any investment
  decision. Nothing in this document should be construed as investment or financial advice. Each recipient of this document should make
  such investigations as they deem necessary to arrive at an independent evaluation of an investment in the securities of the companies
  referred to in this document (including the merits and risks involved), and should consult their own advisors to determine the merits and
  risks of such an investment.

  Angel Broking Limited, its affiliates, directors, its proprietary trading and investment businesses may, from time to time, make
  investment decisions that are inconsistent with or contradictory to the recommendations expressed herein. The views contained in this
  document are those of the analyst, and the company may or may not subscribe to all the views expressed within.

  Reports based on technical and derivative analysis center on studying charts of a stock's price movement, outstanding positions and
  trading volume, as opposed to focusing on a company's fundamentals and, as such, may not match with a report on a company's
  fundamentals.

  The information in this document has been printed on the basis of publicly available information, internal data and other reliable
  sources believed to be true, but we do not represent that it is accurate or complete and it should not be relied on as such, as this
  document is for general guidance only. Angel Broking Limited or any of its affiliates/ group companies shall not be in any way
  responsible for any loss or damage that may arise to any person from any inadvertent error in the information contained in this report.
  Angel Broking Limited has not independently verified all the information contained within this document. Accordingly, we cannot testify,
  nor make any representation or warranty, express or implied, to the accuracy, contents or data contained within this document. While
  Angel Broking Limited endeavours to update on a reasonable basis the information discussed in this material, there may be regulatory,
  compliance, or other reasons that prevent us from doing so.
  This document is being supplied to you solely for your information, and its contents, information or data may not be reproduced,
  redistributed or passed on, directly or indirectly.

  Angel Broking Limited and its affiliates may seek to provide or have engaged in providing corporate finance, investment banking or
  other advisory services in a merger or specific transaction to the companies referred to in this report, as on the date of this report or in
  the past.

  Neither Angel Broking Limited, nor its directors, employees or affiliates shall be liable for any loss or damage that may arise from or in
  connection with the use of this information.

  Note: Please refer to the important `Stock Holding Disclosure' report on the Angel website (Research Section). Also, please
  refer to the latest update on respective stocks for the disclosure status in respect of those stocks. Angel Broking Limited and
  its affiliates may have investment positions in the stocks recommended in this report.


 Disclosure of Interest Statement (Company name)                                IRB Infra
 1. Analyst ownership of the stock                                                  No
 2. Angel and its Group companies ownership of the stock                            Yes
 3. Angel and its Group companies' Directors ownership of the stock                 No
 4. Broking relationship with company covered                                       No

 Note: We have not considered any Exposure below Rs 1 lakh for Angel, its Group companies and Directors.


 Ratings (Returns) :             Buy (> 15%)                      Accumulate (5% to 15%)                 Neutral (-5 to 5%)
                                 Reduce (-5% to 15%)              Sell (< -15%)


July 28, 2010                                                                                                                             14

IRB

  • 1.
    1QFY2011 Result Update| Infrastructure July 28, 2010 IRB Infrastructure ACCUMULATE CMP Rs263 Performance Highlights Target Price Rs275     Y/E March (Rs cr) 1QFY11 1QFY10 % chg (yoy) 4QFY10 % chg (qoq) Investment Period 12 Months Net sales 512.0 414.1 23.6 501.7 2.0 Operating profit 229.3# 166.2 38.0 231.0 (0.8) Stock Info Net profit 117.5 81.5 44.2 141.7 (17.1) Sector Infrastructure Source: Company, Angel Research; Note: # Dividend of Rs20cr from SPV is deducted from Market Cap (Rs cr) 8,735 operating profit and has been put under extra-ordinary income Beta 1.1 IRB Infrastructure (IRB) reported consolidated top-line growth below our estimates, 52 Week High / Low 300/172 primarily led by below-expectation performance by the construction vertical. The operating margin at the consolidated level outperformed our estimates, primarily Avg. Daily Volume 411639 because of (all time) high construction vertical margins leading to higher-than- Face Value (Rs) 10 expected bottom line. Against this backdrop, we prune our estimates. However, given BSE Sensex 17,957 the robust outlook for the road segment (IRB’s forte) and decent portfolio of BOT assets, we maintain our Accumulate rating on the stock. Nifty 5,398 Top line below estimates, higher OPM boost bottom line: IRB reported modest top-line Reuters Code IRBI.BO growth of 23.6% to Rs512cr, well below our expectations of Rs714cr. This was Bloomberg Code IRB@IN primarily due to modest growth of 20.1% in the construction vertical, against over 50% growth in the last four quarters. Management is awaiting commencement nod from NHAI on its four road BOT projects, which dampened the construction segment’s top line. The consolidated OPM stood at 44.8% (40.1%) against our expectation of 39.7%, Shareholding Pattern (%) aided by an all-time high construction vertical margin of 28.8%. Depreciation costs Promoters 73.9 were in line with estimates, whereas interest costs came in below our expectation. The MF / Banks / Indian Fls 7.6 company’s bottom line registered 44.2% growth to Rs117.5cr (Rs81.5cr) against our expectation of Rs94.1cr. FII / NRIs / OCBs 15.4 Outlook and valuation: NHAI has targeted to award orders worth Rs1lakh cr over the Indian Public / Others 3.1 next one year, in line with the long-term target of achieving 20km a day. We believe if NHAI is able to achieve even 50% of its targets, then it would imply abundant opportunities for road developers (read IRB). The recent structural changes have also Abs. (%) 3m 1yr 3yr# lessened the vagaries in road development. Hence, we are optimistic on the road segment. We have valued IRB's business model on an SOTP basis at Rs275, where Sensex 3.3 17.1 1.7 road BOT SPVs have been valued on an NPV basis (FY2012E) and have accorded a IRB (6.2) 36.5 39.1 10% growth premium (Rs154/share) and the construction segment has been valued at #Note: Since Listing on February 25,2008 8x FY2012E EV/EBITDA (Rs113/share). IRB's other investments have been valued at 1x FY2010 book value (Rs8/share). We maintain Accumulate on the stock with a Target Price of Rs275. Key financials (Consolidated) Y/E March (Rs cr) FY2009 FY2010E FY2011E FY2012E Net sales 992 1,705 2,778 3,580 % chg 35.4 71.9 62.9 28.9 Adj. net profit 175.8 385.3 410.2 482.2 % chg 54.4 119.1 6.4 17.6 EBITDA (%) 44.1 46.9 42.2 40.5 FDEPS (Rs) 5.3 11.6 12.3 14.5 P/E (x) 49.7 22.7 21.3 18.1 Shailesh Kanani P/BV (x) 5.0 4.2 3.6 3.1 022-40403800 Ext:321 RoE (%) 10.5 20.3 18.3 18.5 shailesh.kanani@angeltrade.com RoCE (%) 8.1 13.2 15.8 13.6 Aniruddha Mate EV/Sales (x) 10.9 6.5 4.6 3.9 022-40403800 Ext:335 EV/EBITDA (x) 24.7 14.0 10.8 9.7 aniruddha.mate@angeltrade.com Source: Company, Angel Research Please refer to important disclosures at the end of this report 1
  • 2.
    IRB Infrastructure |1QFY2011Result Update Exhibit 1: 1QFY2011 performance (Consolidated) % chg % chg % chg Y/E March (Rs cr) 1QFY11 1QFY10 4QFY10 FY2010 FY2009 (yoy) (qoq) (yoy) Income from operations 512.0 414.1 23.6 501.7 2.0 1,705 991.9 71.9 Total expenditure 262.7 248.0 6.0 270.7 (2.9) 905.8 553.1 63.8 # Operating profit 229.3 166.2 38.0 231.0 (0.8) 799.1 438.8 82.1 OPM (%) 44.8 40.1 470bp 46.0 (120)bp 46.9 44.2 270bp Interest 66.1 46.7 41.5 81.5 (18.8) 249.4 137.7 81.2 Depreciation 53.7 37.6 42.6 51.6 4.1 181.9 114.4 59.0 Non-operating income 21.7 21.5 0.8 11.4 90.7 49.0 28.2 73.8 # # Nonrecurring items/dividend from SPVs 20.0 0.0 - 0.0 - 0.0 - - PBT 151.2 103.3 46.3 109.4 38.2 416.7 214.9 93.9 Tax 30.3 18.2 66.5 (39.3) - 13.4 37.8 (64.6) PAT 120.8 85.1 41.9 148.7 (18.7) 403.4 177.2 127.7 Share of profits/(losses) of asso. 0.0 0.0 - 0.0 0.0 - - Share of profits/(losses) of MI 3.3 3.7 (9.8) 6.9 (52.1) 17.9 - - PAT after MI and share of assoc. 117.5 81.5 44.2 141.7 (17.1) 385.4 177.2 117.5 PAT (%) 22.9 19.7 - 28.2 22.6 17.9 FDEPS (Rs) 3.5 2.5 44.2 4.3 (17.1) 11.6 5.3 117.5 # Source: Company, Angel Research; Note: Dividend of Rs20cr from SPV is deducted from operating profit and has been put under extra-ordinary income Exhibit 2: 1QFY2011 segmental performance (Consolidated) Particulars 1QFY11 1QFY10 % chg 4QFY10 % chg FY10 FY09 % chg Construction segment 330.1 274.9 20.1 312.0 5.8 1,024.2 567.2 80.6 BOT segment 203.6 160.7 26.7 201.1 1.2 729.7 454.3 60.6 Total income 533.7 435.6 22.5 513.1 4.0 1,753.8 1,021.5 71.7 Construction segment 95.2 50.5 88.4 57.8 64.6 200.6 101.3 98.0 BOT segment 175.8 137.1 28.2 184.6 (4.8) 647.4 365.7 77.1 EBITDA 271.0 187.7 44.4 242.4 11.8 848.0 467.0 81.6 Construction segment (%) 28.8 18.4 1040bp 18.5 1030bp 19.6 17.9 170bp BOT segment (%) 86.3 85.3 100bp 91.8 (550)bp 88.7 80.5 820bp EBITDAM (%) 50.8 43.1 770bp 47.2 360bp 48.4 45.7 270bp Construction segment 5.9 6.3 (6.1) 4.8 23.1 22.5 10.2 120.3 BOT segment 60.2 40.5 48.9 76.7 (21.4) 226.8 127.4 78.0 Financial expenses 66.1 46.7 41.5 81.5 (18.8) 249.4 137.7 81.2 Construction segment 11.0 12.9 (15.2) 13.2 (16.8) 52.1 20.8 149.9 BOT segment 42.7 24.7 72.9 38.4 11.3 129.9 93.6 38.8 Depreciation 53.7 37.6 42.6 51.6 4.1 181.9 114.4 59.0 Construction segment 78.4 31.3 150.0 39.9 96.6 126.0 70.3 79.3 BOT segment 72.8 72.0 1.2 69.5 4.8 290.7 144.7 100.9 PBT 151.2 103.3 46.3 109.4 38.3 416.7 214.9 93.9 Construction segment 55.9 25.3 121.0 35.6 57.0 101.2 49.0 106.5 BOT segment 64.9 59.8 8.4 113.0 (42.6) 302.2 128.2 135.8 PAT 120.8 85.1 41.9 148.6 (18.7) 403.4 177.2 127.7 Source: Company, Angel Research July 28, 2010 2
  • 3.
    IRB Infrastructure |1QFY2011Result Update Exhibit 3: 1QFY2011 actual vs. Angel estimates Particulars Estimates Actual Variation (%) Revenue 714.2 533.7 (25.3) Construction segment 503.2 330.1 (34.4) Road BOT segment 211.0 203.6 (3.5) EBITDA margin (%) 39.7 48.7 900bp Construction segment 18.5 28.8 1,034bp Road BOT segment 90.2 86.3 (386)bp PAT 94.1 117.5 24.8 Construction segment 45.8 55.9 22.1 Road BOT segment 48.3 64.9 34.3 Source: Company, Angel Research Exhibit 4: Road BOT project-wise toll revenue growth Project Name 1QFY11 1QFY10 % chg 4QFY10 % chg(qoq) FY2010 FY2009 % chg(yoy) ^ Surat Dahisar 88.2 77.8 13.4 90.7 (2.8) 333.7 33.6 893.2 Mumbai- Pune 80.2 76.4 5.0 76.1 5.4 306.3 288.0 6.4 Thane Bhiwandi Bypass 13.3 11.2 18.8 13.0 2.3 47.2 40.3 17.1 Thane Ghodbunder 7.2 6.9 4.3 7.0 2.9 27.7 26.5 4.5 Pune - Nashik 4.8 4.2 14.3 4.8 - 18.1 16.4 10.4 Pune - Sholapur 3.6 3.6 - 3.5 2.9 13.3 12.7 4.7 Nagar Karmala Tembhurni 3.8 2.9 31.0 3.6 5.6 13.5 11.3 19.5 Mohol Mandrup Kamtee 1.7 1.7 - 1.4 21.4 6.3 6.5 (3.1) Kharpada Bridge 1.9 1.8 5.6 1.8 5.6 6.7 7.1 (5.6) Bharuch Surat ^^ 29.8 - - 31.7 (6.0) 66.3 - - Kaman Paygaon ** - 0.9 - - - 2.2 3.6 (38.9) Khambatki Ghat * - 1.2 - - - 1.2 13.1 (90.8) Bhiwandi Wada # - - - - - - 1.6 - Total 234.5 188.6 24.3 233.6 0.4 842.5 460.7 82.9 Source: Company, Angel Research; Note: * Concession period of Khambatki Ghat BOT project ended on May 3, 2009, # Concession period of Bhiwandi ^^ Wada BOT project ended on September 22, 2008, ^ Surat-Dahisar commissioned on February 20,2009, Bharuch Surat BOT Project commissioned on September 25,2009, ** Kaman-Paygaon BOT Project concession period stopped from November 22, 2009. July 28, 2010 3
  • 4.
    IRB Infrastructure |1QFY2011Result Update Top line below estimates IRB reported modest top-line growth of 23.6% to Rs512cr, well below our expectations of Rs714cr. This was primarily due to modest growth of 20.1% in the construction vertical, against over 50% growth in the last four quarters. Management is awaiting commencement nod from NHAI on its four road BOT projects, which dampened the construction segment’s top line during the quarter. The consolidated OPM stood at 44.8% (40.1%) against our expectation of 39.7%, aided by an all-time high construction vertical margin of 28.8%. IRB’s current order book at Rs7,431cr (excluding O&M orders) provides revenue visibility for its construction arm. Exhibit 5: Quarterly revenue trend Exhibit 6: Quarterly EBITDA trend 600 90.0 300.0 60.0 81.1 52.4 48.7 80.0 80.0 49.5 49.1 500 76.5 250.0 46.0 50.0 70.0 42.5 37.5 40.1 400 60.0 200.0 40.0 56.3 50.0 150.0 30.0 300 40.0 100.0 20.0 200 30.0 50.0 10.0 23.6 20.0 100 - - 10.0 2QFY09 3QFY09 4QFY09 1QFY10 2QFY10 3QFY10 4QFY10 1QFY11 0 - 1QFY10 2QFY10 3QFY10 4QFY10 1QFY11 EBITDA (Rs cr, LHS) EBITDAM (%, RHS) Net Sales (Rs cr, LHS) Growth (yoy %, RHS) Source: Company, Angel Research Source: Company, Angel Research …higher OPM boosts bottom line IRB’s operating margin at the consolidated level outperformed our estimates, primarily on account of (all time) high construction vertical margins leading to higher-than-expected bottom line. Depreciation costs were in line with our estimates, whereas interest costs came in below our expectations. Bottom line registered 44.2% growth to Rs117.5cr (Rs81.5cr) against our expectation of Rs94.1cr. Exhibit 7: Quarterly bottom-line trend 28.2 160 30.0 140 22.9 20.9 22.0 25.0 120 20.4 19.7 100 16.0 20.0 80 13.6 15.0 60 10.0 40 20 5.0 0 - 2QFY09 3QFY09 4QFY09 1QFY10 2QFY10 3QFY10 4QFY10 1QFY11 PAT (Rs cr, LHS) PATM (%, RHS) Source: Company, Angel Research July 28, 2010 4
  • 5.
    IRB Infrastructure |1QFY2011Result Update Outlook and Valuation NHAI has targeted to award orders worth Rs1lakh cr over the next one year, in line with the long-term target of achieving 20km a day. We believe if NHAI is able to achieve even 50% of its targets, then it would imply abundant opportunities for road developers (read IRB). Further, the recent structural changes have also lessened the vagaries in road development. Hence, we are optimistic on the road segment. IRB has one of the largest domestic BOT project portfolios in the road and highway sector comprising 17 projects. In light of the immense opportunities that exist in the road sector in the near future along with IRB’s vast experience and mutually dependent business model, we maintain our bullish stance on the company. Moreover, IRB’s construction arm has a robust order book of Rs7,431cr (excluding O&M orders) (7.2x FY2010 revenue), which lends high revenue visibility. Rationale for change in estimates Modern Road Makers Private Limited (MRMPL), the construction arm of IRB, reported 1QFY2011 top line below our estimates, primarily on account of the recently secured road BOT projects (Goa-Karnataka, Pathankot-Amritsar, Jaipur- Deol and Talegoan-Amravati) not commencing construction activity. These projects with a project capitalisation of ~Rs4,300cr are to be executed over 30 months. Management is awaiting clearance from NHAI to commence with the construction work and expects revenue booking to a certain extent from these projects in 2QFY2011 and 3QFY2011. In line with the management’s guidance, we have factored in delays in the commencement of construction activity in these four road BOT projects and expect construction to begin by 3QFY2011. Accordingly, for the full year, we have cut our construction top-line estimates by 23.5% and 12.0%, respectively, for FY2011E and FY2012E. Management expects to maintain construction vertical margins at around ~20% going ahead, which we think is achievable and accordingly factor in our assumptions, leading to a revision in margin estimates. However, delay in construction commencement will eventually have a cascading effect in the commencement of tolling going ahead. Hence, we factor a delay of six months in tolling and expect tolling to commence from the beginning of 2HFY2014 as against FY2014, which gets captured in our NPV computations for these four projects. Accordingly, NPV/share for the four projects gets revised downwards. Exhibit 8: Change in estimates FY2011E FY2012E Parameters Earlier estimates Revised estimates Earlier estimates Revised estimates Variation (%) Variation (%) Revenue (Rs cr) 3,352.1 2,777.7 3,915.6 3,579.8 (17.1) (8.6) Construction(Rs cr) 2,432.0 1,860.2 2,790.3 2,454.5 (23.5) (12.0) Road BOT segment(Rs cr) 917.5 917.5 1,125.3 1,125.3 - - EBITDA margin (%) 37.3 42.2 38.0 40.5 490bp 250bp PAT(Rs cr) 459.2 410.2 508.0 482.2 (10.7) (5.1) Source: Company, Angel Research July 28, 2010 5
  • 6.
    IRB Infrastructure |1QFY2011Result Update We have valued IRB's business model on an SOTP basis at Rs275, where road BOT SPVs have been valued on NPV basis (FY2012E) and have accorded a 10% growth premium (Rs154/share) and the construction segment has been valued at 8x FY2012E EV/EBITDA (Rs113/share). IRB's other investments have been valued at 1x FY2010 book value (Rs8/share). We maintain Accumulate on the stock with a Target Price of Rs275. Exhibit 9: SOTP valuation summary Business segment Methodology Rs cr IRB's stake(%) Rs/share % to target price 4 BOT Projects FCFE 270 100 8.1 3.0 Kharpada Bridge FCFE 29 100 0.9 0.3 Nagar-Karmala Tembhurni FCFE 69 100 2.1 0.8 Mohol-Mandup-Kamtee FCFE 41 100 1.2 0.5 Pune-Solapur FCFE 95 100 2.9 1.0 Pune-Nashik FCFE 157 100 4.7 1.7 Mumbai-Pune FCFE 1,611 100 48.5 17.6 Thane Ghodbunder FCFE 262 100 7.9 2.9 Surat Dahisar FCFE 178 90 4.8 1.8 Bharuch-Surat FCFE 624 100 18.8 6.8 IRDP Kolhapur FCFE 501 100 15.1 5.5 Goa Karnataka Border FCFE 203 100 5.7 2.1 Pathankot-Amritsar FCFE 255 100 6.4 2.3 Jaipur Deoli FCFE 458 100 8.4 3.1 Talegaon-Amravati FCFE 237 100 4.3 1.6 Total Road BOT Asset Portfolio Valuation 139.6 Value post 10% growth premium 153.5 Modern Road Makers Pvt. Ltd. EV/EBITDA 3,871 100 113.2 41.2 Land Parcel Valuation Book Value 135 66 2.7 1.0 Sindhudurg Airport Project Book Value 175 100 5.3 1.9 Total 274.7 100 Source: Company, Angel Research; Note: We have used cost of equity as 12.7% for computing net present values for the road BOT projects July 28, 2010 6
  • 7.
    IRB Infrastructure |1QFY2011Result Update Exhibit 10: Key assumptions Traffic growth Toll hike Interest Road project rate (%) p.a. (%) rate 4 BOT Projects 7.0 6.0 N.A Kharpada Bridge 8.0 6.0 N.A. Nagar-Karmala Tembhurni 7.0 6.0 N.A. Mohol-Mandup-Kamtee 7.0 6.0 N.A. Pune-Solapur 7.0 6.0 N.A. Pune-Nashik 7.0 6.0 N.A. Mumbai-Pune 8.0 18 (every 3 years) 11.0 Thane Ghodbunder 7.0 6.0 N.A Surat Dahisar 8.0 6.0 12.3 Bharuch-Surat 7.0 6.0 11.5 IRDP Kolhapur 7.0 6.0 11.5 Goa Karnataka Border 7.0 6.0 12.0 Pathankot-Amritsar 7.0 6.0 12.0 Jaipur Deoli 7.0 6.0 12.0 Talegaon-Amravati 7.0 6.0 12.0 Source: Company, Angel Research Exhibit 11: Angel EPS forecast v/s consensus Angel forecast Bloomberg consensus Variation (%) FY2011E 13.8 14.6 5.5 FY2012E 15.3 16.4 7.2 Source: Company, Angel Research July 28, 2010 7
  • 8.
    IRB Infrastructure |1QFY2011Result Update Investment Arguments Vast opportunity in the road sector IRB the prime beneficiary: IRB has some of the very high-density, strategically aligned road stretched in its gamut. These high- density stretches reduce the average payback period for a typical road BOT project. The Government of India is aggressively focusing on road development and expects awarding of road BOT projects worth Rs1lakh cr in FY2011, after a dismal award activity in FY2009. About 34% of this proposed investment is expected to come through the private sector, and we believe that this is where IRB stands to benefit. Moreover, of the 2,986km awarded till February 2010, IRB has been the forerunner by securing 12.8% of the projects. Infrastructure and economy-linked play: IRB has an interdependent business model wherein, the internal construction arm, MRMPL undertakes EPC work relating to secured road BOT projects. While the time-bound construction work of secured road BOT projects lends revenue visibility for the construction arm, any prior completion of construction work ushers in revenue upsides from the road BOT (toll) segment. Revenue from the toll segment is moreover linked with traffic intensity (and pre-determined toll rate hikes), which is directly co-related with the economic well being. (Elasticity of traffic to GDP stands at 1.25x). Thus, the company’s interdependent business model and the expected improved economic scenario lend revenue predictability for IRB. The positives of the business model and net debt to equity at 1.2x reflect in the company’s strong operating cash flows, thereby alleviating possible concerns over equity funding for new road BOT projects in future. July 28, 2010 8
  • 9.
    IRB Infrastructure |1QFY2011Result Update Exhibit 12: Recommendation summary Company CMP TP Rating Top line EPS Adj. P/E OB/ (Rs) (Rs) FY10 FY11E FY12E CAGR (%) FY10 FY11E FY12E CAGR (%) FY10 FY11E FY12E Sale CCCL 86 - Neutral 1,976 2,444 2,871 20.5 5.0 6.0 7.5 22.5 17.2 14.4 11.5 2.3 Gammon 214 - Neutral 4,489 5,575 6,607 21.3 8.4 10.0 12.1 20.0 13.0 11.0 9.0 2.5 HCC 133 - Neutral 3,629 4,146 4,900 16.2 2.7 3.2 3.8 18.8 21.6 18.4 15.3 4.7 IRB Infra 263 275 Neutral 1,705 2,778 3,580 44.9 11.6 12.3 14.5 11.8 22.2 20.8 17.7 - IVRCL 176 216 Buy 5,492 6,663 8,294 22.9 7.8 9.6 12.0 23.9 16.3 13.3 10.6 4.3 JP Assoc. 121 178 Buy 10,316 13,281 17,843 31.5 4.7 5.2 7.7 28.5 26.0 23.2 15.8 - Punj 130 170 Buy 10,539 11,088 13,407 12.8 (11.1) 8.3 12.2 - - 15.8 10.7 2.8 NCC 178 - Neutral 4,778 5,913 6,758 18.9 7.8 10.0 10.7 17.4 22.8 17.8 16.6 3.6 Sadbhav 1,290 - Neutral 1,257 1,560 1,911 23.3 43.0 57.5 69.5 27.1 20.3 15.2 12.5 5.4 SI. 476 570 Buy 4,555 5,535 6,428 18.8 25.7 31.9 40.7 25.9 18.5 14.9 11.7 2.5 PEL 409 563 Buy 3,081 3,685 4,297 18.1 23.4 31.2 32.9 18.6 13.1 9.8 9.3 3.5 MPL 157 190 Buy 1,308 1,701 2,120 27.3 5.8 6.4 9.8 29.8 9.3 8.4 5.5 3.1 L&T 1,863 - Neutral 37,035 44,047 55,519 22.4 47.5 55.1 68.9 20.4 30.9 26.7 21.3 2.7 Source: Company, Angel Research Exhibit 13: Recommendation summary - SOTP break-up Company Core const. Real estate Road BOT Invst. in subsidiaries Others Total Rs % to TP Rs % to TP Rs % to TP Rs % to TP Rs % to TP Rs CCCL 90 100 - - - - - - - - 90 Gammon India 121 54 - - - - - - 104 46 225 HCC 53 41 59 46 16 13 - - - - 128 IRB Infra 113 41 3 1 154 56 5 2 - - 275 IVRCL 168 78 - - - - 48 22 - - 216 Punj Lloyd 170 100 - - - - - - - - 170 NCC 152 82 18 10 16 8 - - - - 186 Simplex In. 570 100 - - - - - - - - 570 Patel Engg 460 82 103 18 - - - - - - 563 Madhucon 98 52 4 2 - - 88 46 - - 190 L&T 1,447 79 - - - - 394 21 - - 1,841 Source: Company, Angel Research July 28, 2010 9
  • 10.
    IRB Infrastructure |1QFY2011Result Update Profit & loss statement (Consolidated) Y/E March (Rs cr) FY2008 FY2009 FY2010 FY2011E FY2012E Net sales 732.7 991.9 1,705.0 2,777.7 3,579.8 Other operating income - - - - - Total operating income 732.7 991.9 1,705.0 2,777.7 3,579.8 % chg 139.7 35.4 71.9 62.9 28.9 Total expenditure 320.8 554.5 906.0 1,605.5 2,130.0 Net raw materials 158.9 305.4 450.0 838.9 1,127.6 Other mfg. costs 39.2 57.0 122.0 165.3 221.9 Personnel 95.3 134.5 284.0 445.8 583.5 Other 27.4 57.6 50.0 155.5 196.9 EBITDA 411.9 437.4 799.0 1,172.2 1,449.8 % chg 148.9 6.2 82.7 46.7 23.7 (% of net sales) 56.2 44.1 46.9 42.2 40.5 Depreciation 101.6 114.4 181.9 216.6 365.8 EBIT 310.3 323.0 617.1 955.6 1,084.0 % chg 174.8 4.1 91.0 54.9 13.4 (% of net sales) 42.3 32.6 36.2 34.4 30.3 Interest & other charges 195.8 137.7 249.4 418.4 462.3 Other income 52.0 29.6 49.0 23.6 43.4 (% of PBT) 31.2 13.8 11.7 4.2 6.5 Share in profit of associates - - - - - Recurring PBT 166.5 214.9 416.6 560.8 665.1 % chg 273.4 29.1 93.8 34.6 18.6 Extraordinary expense/(Inc.) - - - - - PBT (reported) 166.5 214.9 416.6 560.8 665.1 Tax 40.0 37.8 13.4 150.6 182.9 (% of PBT) 24.0 17.6 3.2 26.9 27.5 PAT (reported) 126.5 177.2 403.3 410.2 482.2 Add: Share of earnings of ass. - - - - - Less: Minority interest (MI) 12.6 1.3 17.9 - - Prior period items - - - - - PAT after MI (reported) 113.9 175.8 385.3 410.2 482.2 ADJ. PAT 113.9 175.8 385.3 410.2 482.2 % chg 403.9 54.4 119.1 6.4 17.6 (% of net sales) 15.5 17.7 22.6 14.8 13.5 Basic EPS (Rs) 4.2 5.3 11.6 12.3 14.5 Fully diluted EPS (Rs) 4.2 5.3 11.6 12.3 14.5 % chg 357.3 26.6 119.2 6.4 17.6 July 28, 2010 10
  • 11.
    IRB Infrastructure |1QFY2011Result Update Balance sheet (Consolidated) Y/E March (Rs cr) FY2008 FY2009 FY2010E FY2011E FY2012E SOURCES OF FUNDS Equity share capital 332.4 332.4 332.4 332.4 332.4 Preference capital - - - - - Reserves & surplus 1,288 1,398 1,733 2,077 2,476 Shareholders’ funds 1,621 1,730 2,066 2,409 2,808 Minority interest 28 60 60 60 60 Total loans 2,021 2,486 2,880 4,569 5,966 Deferred tax liability 3 18 18 18 18 Total liabilities 3,673 4,294 5,024 7,057 8,852 APPLICATION OF FUNDS Gross block 2,219 2,460 3,386 4,995 8,025 Less: Acc. depreciation 334 444 602 818 1,184 Net block 1,885 2,016 2,784 4,177 6,841 Capital work-in-progress 889 1,455 1,233 1,554 479 Goodwill - - - - - Investments 198 111 111 111 111 Current assets 959 1,033 1,446 1,990 2,478 Cash 522 415 467 633 641 Loans & advances 375 399 546 653 877 Other 62 218 434 704 959 Current liabilities 260 321 551 775 1,056 Net current assets 699 712 895 1,215 1,422 Mis. exp. not written off 2 1 - - - Total assets 3,673 4,294 5,024 7,057 8,852 July 28, 2010 11
  • 12.
    IRB Infrastructure |1QFY2011Result Update Cash flow statement (Consolidated) Y/E March (Rs cr) FY2008 FY2009 FY2010E FY2011E FY2012E Profit before tax 166.5 214.9 416.6 560.8 665.1 Depreciation 101.6 114.4 181.9 216.6 365.8 Change in working capital 41.9 120.0 132.0 153.1 198.5 Less: Other income 52.0 29.6 49.0 23.6 43.4 Direct taxes paid 40.0 37.8 13.4 150.6 182.9 Cash flow from operations 134.2 141.9 404.3 450.0 606.1 (Inc.)/Dec. in fixed assets (433.1) (806.9) (705.0) (1,929.7) (1,954.4) (Inc.)/Dec. in Investments (156.8) 87.3 - - - Other income 52.0 29.6 49.0 23.6 43.4 Cash flow from investing (537.9) (690.1) (656.0) (1,906.1) (1,911.0) Issue of equity 1,089.9 (1.3) - - - Inc./(Dec.) in loans (496.7) 464.6 394.5 1,688.9 1,396.3 Dividend paid (incl. tax) 3.0 65.2 49.9 66.5 83.1 Others 63.2 42.6 (41.0) - - Cash flow from financing 653.5 440.7 303.6 1,622.4 1,313.3 Inc./(Dec.) in cash 249.9 (107.4) 51.9 166.3 8.4 Opening cash balances 272.3 522.1 414.7 466.6 632.9 Closing cash balances 522.1 414.7 466.6 632.9 641.3 July 28, 2010 12
  • 13.
    IRB Infrastructure |1QFY2011Result Update Key Ratios Y/E March FY2008 FY2009 FY2010E FY2011E FY2012E Valuation ratio (x) P/E (on FDEPS) 76.7 49.7 22.7 21.3 18.1 P/CEPS 40.5 30.1 15.4 13.9 10.3 P/BV 5.4 5.0 4.2 3.6 3.1 Dividend yield (%) 0.0 0.6 0.5 0.6 0.6 EV/Sales 14.0 10.9 6.5 4.6 3.9 EV/EBITDA 24.9 24.7 14.0 10.8 9.7 EV/Total assets 2.8 2.5 2.2 1.8 1.6 Per share data (Rs) EPS (Basic) 3.4 5.3 11.6 12.3 14.5 EPS (fully diluted) 3.4 5.3 11.6 12.3 14.5 Cash EPS 6.5 8.7 17.1 18.9 25.5 DPS 0.0 1.5 1.2 1.7 1.7 Book value 48.8 52.1 62.1 72.5 84.5 DuPont analysis EBIT margin 42.3 32.6 36.2 34.4 30.3 Tax retention ratio 76.0 82.4 96.8 73.1 72.5 Asset turnover (x) 0.3 0.3 0.4 0.5 0.5 ROIC (post-tax) 8.1 7.6 14.2 12.7 10.7 Cost of debt (post-tax) 6.6 5.0 9.0 8.2 6.4 Leverage (x) 3.3 1.1 1.2 1.4 1.8 Operating RoE 13.4 10.3 20.3 19.1 18.5 Returns (%) ROCE (Pre-tax) 9.3 8.1 13.2 15.8 13.6 Angel RoIC (Pre-tax) 14.3 13.8 21.5 23.3 17.2 RoE 11.4 10.5 20.3 18.3 18.5 Turnover ratios (x) Asset turnover (gross block) 0.3 0.4 0.6 0.7 0.5 Inventory/Sales (days) 15 47 66 71 81 Receivables (days) 39 5 4 4 4 Payables (days) 118 77 71 64 70 Working capital cycle (ex-cash) (days) 78 87 78 66 69 Solvency ratios (x) Net debt to equity 0.9 1.2 1.2 1.6 1.9 Net debt to EBITDA 3.6 4.7 3.0 3.4 3.7 Interest coverage (EBIT/Interest) 1.6 2.3 2.5 2.3 2.3 July 28, 2010 13
  • 14.
    IRB Infrastructure |1QFY2011Result Update Research Team Tel: 022 - 4040 3800 E-mail: research@angeltrade.com Website: www.angeltrade.com DISCLAIMER This document is solely for the personal information of the recipient, and must not be singularly used as the basis of any investment decision. Nothing in this document should be construed as investment or financial advice. Each recipient of this document should make such investigations as they deem necessary to arrive at an independent evaluation of an investment in the securities of the companies referred to in this document (including the merits and risks involved), and should consult their own advisors to determine the merits and risks of such an investment. Angel Broking Limited, its affiliates, directors, its proprietary trading and investment businesses may, from time to time, make investment decisions that are inconsistent with or contradictory to the recommendations expressed herein. The views contained in this document are those of the analyst, and the company may or may not subscribe to all the views expressed within. Reports based on technical and derivative analysis center on studying charts of a stock's price movement, outstanding positions and trading volume, as opposed to focusing on a company's fundamentals and, as such, may not match with a report on a company's fundamentals. The information in this document has been printed on the basis of publicly available information, internal data and other reliable sources believed to be true, but we do not represent that it is accurate or complete and it should not be relied on as such, as this document is for general guidance only. Angel Broking Limited or any of its affiliates/ group companies shall not be in any way responsible for any loss or damage that may arise to any person from any inadvertent error in the information contained in this report. Angel Broking Limited has not independently verified all the information contained within this document. Accordingly, we cannot testify, nor make any representation or warranty, express or implied, to the accuracy, contents or data contained within this document. While Angel Broking Limited endeavours to update on a reasonable basis the information discussed in this material, there may be regulatory, compliance, or other reasons that prevent us from doing so. This document is being supplied to you solely for your information, and its contents, information or data may not be reproduced, redistributed or passed on, directly or indirectly. Angel Broking Limited and its affiliates may seek to provide or have engaged in providing corporate finance, investment banking or other advisory services in a merger or specific transaction to the companies referred to in this report, as on the date of this report or in the past. Neither Angel Broking Limited, nor its directors, employees or affiliates shall be liable for any loss or damage that may arise from or in connection with the use of this information. Note: Please refer to the important `Stock Holding Disclosure' report on the Angel website (Research Section). Also, please refer to the latest update on respective stocks for the disclosure status in respect of those stocks. Angel Broking Limited and its affiliates may have investment positions in the stocks recommended in this report. Disclosure of Interest Statement (Company name) IRB Infra 1. Analyst ownership of the stock No 2. Angel and its Group companies ownership of the stock Yes 3. Angel and its Group companies' Directors ownership of the stock No 4. Broking relationship with company covered No Note: We have not considered any Exposure below Rs 1 lakh for Angel, its Group companies and Directors. Ratings (Returns) : Buy (> 15%) Accumulate (5% to 15%) Neutral (-5 to 5%) Reduce (-5% to 15%) Sell (< -15%) July 28, 2010 14