Download to read offline
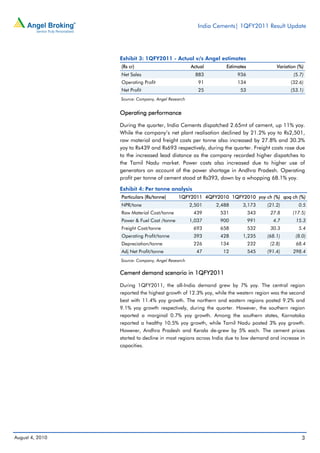
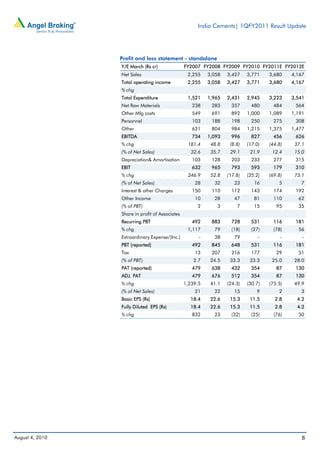

India Cements' net sales and profits declined significantly in the first quarter of fiscal year 2011 compared to the same period last year. Net sales decreased 8.1% and operating profit declined 71.2% due to a substantial decline in cement prices in Andhra Pradesh, which accounts for around 45% of the company's revenues. Net profit dropped 82.7% to Rs25cr as a result of the poor operating performance, despite a profit from selling shares in another company. The company expects pricing pressure to continue in the southern region in the coming quarters due to excess capacity.