1. 1QCY2010 Result Update I Pharmaceutical
April 28, 2010
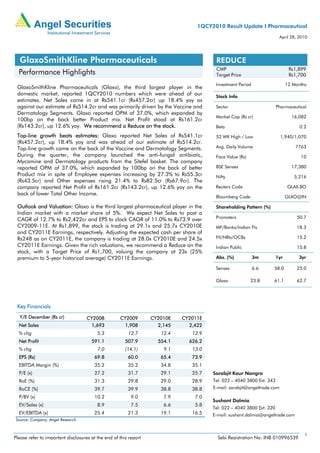
GlaxoSmithKline Pharmaceuticals REDUCE
CMP Rs1,899
Performance Highlights Target Price Rs1,700
Investment Period 12 Months
GlaxoSmithKline Pharmaceuticals (Glaxo), the third largest player in the
domestic market, reported 1QCY2010 numbers which were ahead of our Stock Info
estimates. Net Sales came in at Rs541.1cr (Rs457.2cr) up 18.4% yoy as
against our estimate of Rs514.2cr and was primarily driven by the Vaccine and Sector Pharmaceutical
Dermatology Segments. Glaxo reported OPM of 37.0%, which expanded by
Market Cap (Rs cr) 16,082
100bp on the back better Product mix. Net Profit stood at Rs161.2cr
(Rs143.2cr), up 12.6% yoy. We recommend a Reduce on the stock. Beta 0.2
Top-line growth beats estimates: Glaxo reported Net Sales of Rs541.1cr 52 WK High / Low 1,940/1,070
(Rs457.2cr), up 18.4% yoy and was ahead of our estimate of Rs514.2cr.
Top-line growth came on the back of the Vaccine and Dermatology Segments. Avg. Daily Volume 7763
During the quarter, the company launched the anti-fungal antibiotic, Face Value (Rs) 10
Mycamine and Dermatology products from the Sitefel basket. The company
reported OPM of 37.0%, which expanded by 100bp on the back of better BSE Sensex 17,380
Product mix in spite of Employee expenses increasing by 27.3% to Rs55.3cr Nifty 5,216
(Rs43.5cr) and Other expenses rising 21.4% to Rs82.5cr (Rs67.9cr). The
company reported Net Profit of Rs161.2cr (Rs143.2cr), up 12.6% yoy on the Reuters Code GLAX.BO
back of lower Total Other Income.
Bloomberg Code GLXO@IN
Outlook and Valuation: Glaxo is the third largest pharmaceutical player in the Shareholding Pattern (%)
Indian market with a market share of 5%. We expect Net Sales to post a
CAGR of 12.7% to Rs2,422cr and EPS to clock CAGR of 11.0% to Rs73.9 over Promoters 50.7
CY2009-11E. At Rs1,899, the stock is trading at 29.1x and 25.7x CY2010E MF/Banks/Indian FIs 18.3
and CY2011E Earnings, respectively. Adjusting the expected cash per share of
Rs248 as on CY2011E, the company is trading at 28.0x CY2010E and 24.5x FII/NRIs/OCBs 15.2
CY2011E Earnings. Given the rich valuations, we recommend a Reduce on the Indian Public 15.8
stock, with a Target Price of Rs1,700, valuing the company at 23x (25%
premium to 5-year historical average) CY2011E Earnings. Abs. (%) 3m 1yr 3yr
Sensex 6.6 58.0 25.0
Glaxo 23.8 61.1 62.7
Key Financials
Y/E December (Rs cr) CY2008 CY2009 CY2010E CY2011E
Net Sales 1,693 1,908 2,145 2,422
% chg 5.3 12.7 12.4 12.9
Net Profit 591.1 507.9 554.1 626.2
% chg 7.0 (14.1) 9.1 13.0
EPS (Rs) 69.8 60.0 65.4 73.9
EBITDA Margin (%) 35.2 35.3 34.8 35.1
P/E (x) 27.2 31.7 29.1 25.7 Sarabjit Kour Nangra
RoE (%) 31.3 29.8 29.0 28.9 Tel: 022 – 4040 3800 Ext: 343
RoCE (%) 39.7 39.9 38.8 38.8 E-mail: sarabjit@angeltrade.com
P/BV (x) 10.2 9.0 7.9 7.0
Sushant Dalmia
EV/Sales (x) 8.9 7.5 6.6 5.8
Tel: 022 – 4040 3800 Ext: 320
EV/EBITDA (x) 25.4 21.3 19.1 16.5 E-mail: sushant.dalmia@angeltrade.com
Source: Company, Angel Research.
1
Please refer to important disclosures at the end of this report Sebi Registration No: INB 010996539
2. Glaxo I 1QCY2010 Result Update
Exhibit 1: 1QCY2010 Performance (Standalone)
Y/E Dec (Rs cr) 1QCY2010 1QCY2009 % chg. CY2009 CY2008 % chg.
Net Sales 541 457 18.4 1,870 1,660 12.7
Other Income 43.8 30.0 45.7 120.1 118.5 1.4
Total Income 585 487 20.1 1,991 1,779 11.9
PBIDT 200.2 164.5 21.7 654.9 577.7 13.4
Operating Margin (%) 37.0 36.0 35.3 34.8
Interest 0.0 0.0 - 0.0 0.5 -
Depreciation &
Amortisation 3.8 3.7 2.5 16.4 16.3 0.2
PBT & Exceptional
Items 240.2 190.8 25.9 758.7 679.9 11.6
Less : Exceptional
Items 0.0 17.8 - (13.6) (128.2) (89.4)
Profit before tax 240.2 208.7 15.1 772.7 808.1 (4.4)
Provision for Taxation 79.0 65.5 20.6 260.7 238.1 9.5
Net Profit 161.2 143.2 12.6 511.7 570.0 (10.2)
EPS (Rs) 19.0 16.9 60.0 69.8
Source: Company, Angel Research
Key Highlights
Revenues up 18%, beat estimates: Glaxo reported Net Sales of Rs541.1cr
(Rs457.2cr), up 18.4% yoy and was ahead of our estimate of Rs514.2cr. Top-line
growth was driven by the Vaccine and Dermatology Segments. During the quarter,
the company launched the anti-fungal antibiotic, Mycamine and Dermatology
products from the Sitefel basket.
Exhibit 2: Sales Trend
550 512 541 35.0
457 457 444 30.0
450
25.0
350
20.0
(Rs cr)
(%)
250 15.0
10.0
150
5.0
50
0.0
-50 1QCY2009 2QCY2009 3QCY2009 4QCY2009 1QCY2010 -5.0
Sales Growth (YoY)
Source: Company, Angel Research
April 28, 2010 2
3. Glaxo I 1QCY2010 Result Update
OPM expands on better Product mix: Glaxo reported OPM of 37.0%, which
expanded by 100bp on better Product mix in spite of Employee expenses increasing
by 27.3% to Rs55.3cr (Rs43.5cr) and Other expenses rising 21.4% to Rs82.5cr
(Rs67.9cr). The company reported Net Profit of Rs161.2cr (Rs143.2cr), up 12.6%
yoy on the back of lower total Other Income.
Exhibit 3: OPM Trend
40.0
36.9 37.0
35.0 36.0 35.6
(%)
31.2
30.0
25.0
1QCY2009 2QCY2009 3QCY2009 4QCY2009 1QCY2010
Source: Company, Angel Research
Outlook and Valuation
Glaxo is the third largest pharmaceutical player in the India market with a market
share of 5%. The company’s product portfolio includes both prescription medicines
and vaccines. Glaxo sells prescription medicines across therapeutic areas such as
anti-infectives, dermatology, gynaecology, diabetes, oncology, cardiovascular
disease and respiratory diseases. Majority proportion of the company’s Revenue
comes from the acute therapeutic portfolio. However, the company is now scouting
for opportunities in high-growth therapeutic areas like CVS, CNS, Diabetes and
Oncology. Further, with a strong parentage, Glaxo plans to increase its product
portfolio through patented launches and vaccines.
We expect Net Sales to post CAGR of 12.7% to Rs2,422cr and EPS to clock CAGR of
11.0% to Rs73.9 over CY2009-11E. At Rs1,899, the stock is trading at 29.1x and
25.7x CY2010E and CY2011E Earnings, respectively. Adjusting the expected cash
per share of Rs248 as on CY2011E, the company is trading at 28.0x CY2010E and
24.5x CY2011E Earnings. Given the rich valuations, we recommend a Reduce on
the stock, with a Target Price of Rs1,700, valuing the company at 23x (25%
premium to its 5-year historical average) CY2011E Earnings.
Exhibit 4: One-year forward PE Band
2,500
2,000
25x
1,500
20x
(Rs)
1,000 15x
10x
500
0
Jan-05
Jul-05
Jan-06
Jul-06
Jan-07
Jul-07
Jan-08
Jul-08
Jan-09
Jul-09
Jan-10
Apr-05
Apr-06
Apr-07
Apr-08
Apr-09
Apr-10
Oct-05
Oct-06
Oct-07
Oct-08
Oct-09
Source: C-line, Angel Research
April 28, 2010 3
7. Glaxo I 1QCY2010 Result Update
Research Team Tel: 022- 4040 3800 E-mail: research@angeltrade.com Website: www.angeltrade.com
DISCLAIMER
This document is solely for the personal information of the recipient, and must not be singularly used as the basis of any investment decision. Nothing in this
document should be construed as investment or financial advice. Each recipient of this document should make such investigations as they deem necessary to
arrive at an independent evaluation of an investment in the securities of the companies referred to in this document (including the merits and risks involved),
and should consult their own advisors to determine the merits and risks of such an investment.
Angel Securities Limited, its affiliates, directors, its proprietary trading and investment businesses may, from time to time, make investment decisions that are
inconsistent with or contradictory to the recommendations expressed herein. The views contained in this document are those of the analyst, and the company
may or may not subscribe to all the views expressed within.
Reports based on technical and derivative analysis center on studying charts of a stock's price movement, outstanding positions and trading volume, as
opposed to focusing on a company's fundamentals and, as such, may not match with a report on a company's fundamentals.
The information in this document has been printed on the basis of publicly available information, internal data and other reliable sources believed to be true,
and is for general guidance only. Angel Securities Limited has not independently verified all the information contained within this document. Accordingly, we
cannot testify, nor make any representation or warranty, express or implied, to the accuracy, contents or data contained within this document. While Angel
Securities Limited endeavours to update on a reasonable basis the information discussed in this material, there may be regulatory, compliance, or other
reasons that prevent us from doing so.
This document is being supplied to you solely for your information, and its contents, information or data may not be reproduced, redistributed or passed on,
directly or indirectly.
Angel Securities Limited and its affiliates may seek to provide or have engaged in providing corporate finance, investment banking or other advisory services
in a merger or specific transaction to the companies referred to in this report, as on the date of this report or in the past.
Neither Angel Securities Limited, nor its directors, employees or affiliates shall be liable for any loss or damage that may arise from or in connection with the
use of this information.
Note: Please refer to the important `Stock Holding Disclosure' report on the Angel website (Research Section).
Disclosure of Interest Statement Glaxo
1. Analyst ownership of the stock No
2. Angel and its Group companies ownership of the stock No
3. Angel and its Group companies’ Directors ownership of the stock No
4. Broking relationship with company covered No
Note: We have not considered any Exposure below Rs 1 lakh for Angel and its Group companies.
Address: Acme Plaza, ‘A’ Wing, 3rd Floor, M.V. Road, Opp. Sangam Cinema, Andheri (E), Mumbai - 400 059.
Tel : (022) 3952 4568 / 4040 3800
Angel Broking Ltd: BSE Sebi Regn No : INB 010996539 / CDSL Regn No: IN - DP - CDSL - 234 - 2004 / PMS Regn Code: PM/INP000001546 Angel Securities Ltd:BSE: INB010994639/INF010994639 NSE:
INB230994635/INF230994635 Membership numbers: BSE 028/NSE:09946
Angel Capital & Debt Market Ltd: INB 231279838 / NSE FNO: INF 231279838 / NSE Member code -12798 Angel Commodities Broking (P) Ltd: MCX Member ID: 12685 / FMC Regn No: MCX / TCM /
CORP / 0037 NCDEX : Member ID 00220 / FMC Regn No: NCDEX / TCM / CORP / 0302
April 28, 2010 7