Download to read offline
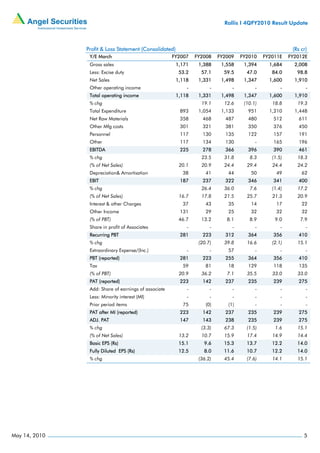
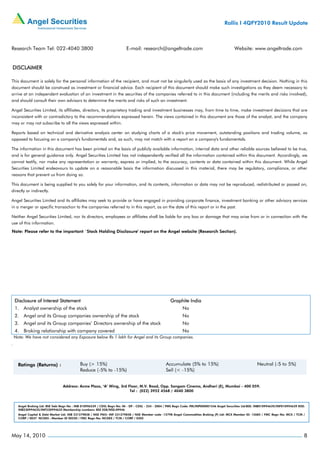

Graphite India reported a 66% year-over-year increase in 4QFY2010 sales, in line with estimates. Full year FY2010 sales fell 10.1%, lower than expected, due to lower production at the company's German facility. However, operating margins increased to a strong 29.4% for FY2010 due to higher realizations. Going forward, the company is well positioned for growth due to increasing demand from the steel industry and its capacity expansion plans. The report maintains a "Buy" recommendation on the stock based on its attractive valuation and growth outlook.


