VVIP Pune Call Girls Katraj (7001035870) Pune Escorts Nearby with Complete Sa...
Hindalco
1. 1QFY2011 Result Update | Base Metals
August 03, 2010
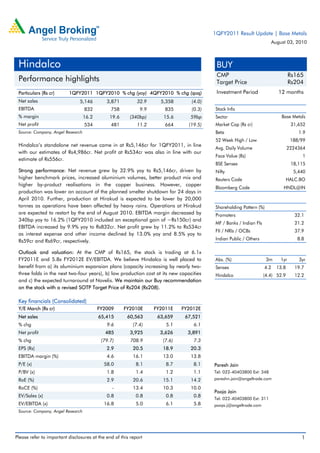
Hindalco BUY
CMP Rs165
Performance highlights Target Price Rs204
Particulars (Rs cr) 1QFY2011 1QFY2010 % chg (yoy) 4QFY2010 % chg (qoq) Investment Period 12 months
Net sales 5,146 3,871 32.9 5,358 (4.0)
EBITDA 832 758 9.9 835 (0.3) Stock Info
% margin 16.2 19.6 (340bp) 15.6 59bp Sector Base Metals
Net profit 534 481 11.2 664 (19.5) Market Cap (Rs cr) 31,652
Source: Company, Angel Research Beta 1.9
52 Week High / Low 188/99
Hindalco’s standalone net revenue came in at Rs5,146cr for 1QFY2011, in line
Avg. Daily Volume 2224364
with our estimates of Rs4,986cr. Net profit at Rs534cr was also in line with our
Face Value (Rs) 1
estimate of Rs556cr.
BSE Sensex 18,115
Strong performance: Net revenue grew by 32.9% yoy to Rs5,146cr, driven by Nifty 5,440
higher benchmark prices, increased aluminium volumes, better product mix and Reuters Code HALC.BO
higher by-product realisations in the copper business. However, copper
Bloomberg Code HNDL@IN
production was lower on account of the planned smelter shutdown for 24 days in
April 2010. Further, production at Hirakud is expected to be lower by 20,000
tonnes as operations have been affected by heavy rains. Operations at Hirakud Shareholding Pattern (%)
are expected to restart by the end of August 2010. EBITDA margin decreased by Promoters 32.1
340bp yoy to 16.2% (1QFY2010 included an exceptional gain of ~Rs150cr) and
MF / Banks / Indian Fls 21.2
EBITDA increased by 9.9% yoy to Rs832cr. Net profit grew by 11.2% to Rs534cr
FII / NRIs / OCBs 37.9
as interest expense and other income declined by 13.0% yoy and 8.5% yoy to
Rs59cr and Rs69cr, respectively. Indian Public / Others 8.8
Outlook and valuation: At the CMP of Rs165, the stock is trading at 6.1x
FY2011E and 5.8x FY2012E EV/EBITDA. We believe Hindalco is well placed to Abs. (%) 3m 1yr 3yr
benefit from a) its aluminium expansion plans (capacity increasing by nearly two- Sensex 4.2 13.8 19.7
three folds in the next two-four years), b) low production cost at its new capacities Hindalco (4.4) 52.9 12.2
and c) the expected turnaround at Novelis. We maintain our Buy recommendation
on the stock with a revised SOTP Target Price of Rs204 (Rs208).
Key financials (Consolidated)
Y/E March (Rs cr) FY2009 FY2010E FY2011E FY2012E
Net sales 65,415 60,563 63,659 67,521
% chg 9.6 (7.4) 5.1 6.1
Net profit 485 3,925 3,626 3,891
% chg (79.7) 708.9 (7.6) 7.3
EPS (Rs) 2.9 20.5 18.9 20.3
EBITDA margin (%) 4.6 16.1 13.0 13.8
P/E (x) 58.0 8.1 8.7 8.1 Paresh Jain
P/BV (x) 1.8 1.4 1.2 1.1 Tel: 022-40403800 Ext: 348
RoE (%) 2.9 20.6 15.1 14.2 pareshn.jain@angeltrade.com
RoCE (%) - 13.4 10.3 10.0
Pooja Jain
EV/Sales (x) 0.8 0.8 0.8 0.8
Tel: 022-40403800 Ext: 311
EV/EBITDA (x) 16.8 5.0 6.1 5.8 pooja.j@angeltrade.com
Source: Company, Angel Research
Please refer to important disclosures at the end of this report 1
2. Hindalco | 1QFY2011 Result Update
Exhibit 1: 1QFY2011 performance (Standalone)
( Rs cr) 1QFY11 1QFY10 yoy% FY10 FY09 yoy%
Net sales 5,146 3,871 32.9 19,408 18,053 7.5
Raw material 3,121 2,512 24.3 12,542 11,060 13.4
% of net sales 60.7 64.9 64.6 61.3
Power and fuel 510 421 21.1 1,938 2,232 (13.2)
% of net sales 9.9 10.9 10.0 12.4
Staff cost 228 207 10.1 878 668 31.5
% of net sales 4.4 5.3 4.5 3.7
Other expenses 487 2 27,555.1 1,228 1,225 0.3
% of net sales 9.5 0.0 6.3 6.8
Total expenditure 4,346 3,142 38.3 16,586 15,184 9.2
% of net sales 84.5 81.2 85.5 84.1
Operating Income 33 29 14.5 128 167 (23.1)
EBIDTA 832 758 9.9 2,950 3,036 (2.8)
% of net sales 16.2 19.6 15.2 16.8
Interest 59 68 (13.0) 25 31 (17.5)
Depreciation 169 165 2.3 667 645 3.4
Other income 69 75 (8.5) 260 637 (59.2)
Exceptional Items 0 0 0 0
PBT 673 600 12.2 2,265 2,690 (15.8)
% of net sales 13.1 15.5 11.7 14.9
Provision for tax 139 119 16.4 349 460 (24.2)
% of PBT 20.6 19.8 15.4 17.1
PAT 534 481 11.2 1,916 2,230 (14.1)
% of net sales 10.4 12.4 9.9 12.4
Diluted EPS (Rs) 2.8 2.8 (1.4) 10.6 14.8 (28.5)
Source: Company, Angel Research
Exhibit 2: 1QFY2011 - Actual vs. Angel estimates
(Rs cr) Actual Estimate Variation (%)
Net sales 5,146 4,986 3.2
EBITDA 832 863 (3.5)
EBITDA margin (%) 16.2 17.3 (112bp)
PBT 673 695 (3.2)
PAT 534 556 (3.9)
Source: Company, Angel Research
August 03, 2010 2
3. Hindalco | 1QFY2011 Result Update
Key result highlights
Hindalco’s net revenue grew by 32.9% yoy to Rs5,146cr, driven by higher
benchmark prices, increased aluminium volumes, better product mix and higher
by-product realisations in the copper business.
The company’s EBITDA margin decreased by 340bp yoy to 16.2% (1QFY2010
included an exceptional gain of ~Rs150cr) and EBITDA increased by 9.9% yoy to
Rs832cr. Net profit increased by 11.2% to Rs534cr as interest expense and other
income declined by 13.0% yoy and 8.5% yoy to Rs59cr and Rs69cr, respectively.
Segmental performance
Revenue from the copper division increased by 33.7% yoy to Rs3,314cr, whereas
that from the aluminium division increased by 31.4% yoy to Rs1,867cr.
Cathode production declined by 4.4% yoy to 76,309 tonnes, while production of
CC rods increased by 12.3% yoy to 40,708 tonnes. Copper production was lower
on account of the planned smelter shutdown for 24 days in April 2010. Further,
production at Hirakud is expected to be lower by 20,000 tonnes as operations
have been affected by heavy rains. Operations at Hirakud are expected to restart
by the end of August 2010.
Exhibit 3: Quarterly copper production trend
(tonnes) 1QFY10 2QFY10 3QFY10 4QFY10 1QFY11 yoy % qoq %
Copper cathodes 79,782 89,692 89,152 74,734 76,309 (4.4) 2.1
CC rods 36,241 37,490 32,969 36,870 40,708 12.3 10.4
Source: Company, Angel Research
During the quarter, alumina production grew by 9.5% yoy to 341,419 tonnes and
metal production increased by 3.4% yoy to 140,061 tonnes.
Exhibit 4: Quarterly aluminium production trend
(tonnes) 1QFY10 2QFY10 3QFY10 4QFY10 1QFY11 yoy % qoq %
Alumina 311,917 311,706 339,899 343,801 341,419 9.5 (0.7)
Aluminium metal 135,439 139,894 142,048 138,023 140,061 3.4 1.5
Wire rods 22,108 23,255 23,363 23,177 23,326 5.5 0.6
Flat rolled
52,904 57,787 55,030 47,781 51,373 (2.9) 7.5
products/foil
Extrusions 8,812 9,815 10,531 9,751 9,617 9.1 (1.4)
Source: Company, Angel Research
August 03, 2010 3
4. Hindalco | 1QFY2011 Result Update
EBIT affected by lower TC/RC and higher energy cost
The copper division’s EBIT margin declined from 6.3% in 1QFY2010 to 3.7% in
1QFY2011. The positive impact of higher by-product realisations was negated by
lower TC/RC margin and higher energy cost. Consequently, copper EBIT declined
by 20.5% yoy to Rs124cr.
Exhibit 5: TC/RC margin at low levels
10
8
6
(c/lb)
4
2
0
1QFY10 2QFY10 3QFY10 4QFY10 1QFY11
Source: Company, Angel Research
The aluminium division’s EBIT margin fell to 29.6% in 1QFY2011from 32.0% in
1QFY2010 on account of higher energy cost and rupee appreciation. Thus,
aluminium EBIT grew by 21.3% yoy to Rs552cr.
Exhibit 6: Segmental performance
(Rs cr) 1QFY10 2QFY10 3QFY10 4QFY10 1QFY11 yoy % qoq %
Aluminium 1,421 1,650 1,885 2,045 1,867 31.4 (8.7)
Copper 2,480 3,269 3,432 3,361 3,314 33.7 (1.4)
Gross revenue 3,901 4,919 5,317 5,406 5,181 32.8 (4.2)
Less: Inter-segment
(1) (2) (2) (2) (3) - -
revenue
Net sales 3,899 4,917 5,315 5,404 5,178 32.8 (4.2)
Aluminium 455 259 438 614 552 21.3 (10.1)
Copper 156 217 159 127 124 (20.5) (2.5)
EBIT 612 476 598 742 676 10.6 (8.8)
EBIT margin (%)
Aluminium 32.0 15.7 23.2 30.0 29.6 - -
Copper 6.3 6.6 4.6 3.8 3.7 - -
Source: Company, Angel Research
August 03, 2010 4
5. Hindalco | 1QFY2011 Result Update
Investment rationale
Aluminium capacity to increase two-three folds in the next 2–4years
Hindalco is increasing its aluminium capacity by two-three folds in the next
wo-four years. The first commissioning is expected at Hirakud in 2QFY2011,
where capacity is being increased to 161ktpa in Phase-1 and to 213ktpa in Phase-
2 by 4QFY2012E. Moreover, capacities at Mahan Aluminium and Aditya
Aluminium are expected to come on stream by FY2012E. Consequently, we expect
sales volume to grow at a 26.6% CAGR over FY2010–13E. Further, the company’s
Jharkhand Aluminium project is expected to be commissioned in 1QFY2014.
On the alumina front, with the commissioning of the Utkal refinery in FY2012E, we
expect alumina sales volume to grow at a 42.9% CAGR over FY2010–12E.
Moreover, these new capacities are coming at the lower end of the cost curve,
which is likely to further benefit the company in terms of cost reduction.
Exhibit 7: Expansion plans
Project Timeline
Smelter Hirakud Phase I (115kt-161kt) 2QFY11E
Phase II (161kt-213kt) 4QFY12E
Phase III (213kt-316kt) -
Mahan Aluminim 2QFY12E
Aditya Aluminium 3QFY12E
Jharkhand Aluminium 1QFY14E
Refinery Utkal Alumina 2QFY12E
Aditya Alumina 1QFY14E
Belgaum Special Alumina Project -
Source: Company, Angel Research
Turnaround at Novelis
With the renewal of its long-term contracts, we believe the risk in the company’s
earnings has eased out as there is a condition of price revision in the new
contracts. Further, Novelis is expanding its rolling capacity in Brazil at a capex of
US $300mn.
August 03, 2010 5
6. Hindalco | 1QFY2011 Result Update
Outlook and valuation
At the CMP of Rs165, the stock is trading at 6.1x FY2011E and 5.8x FY2012E
EV/EBITDA. We believe Hindalco is well placed to benefit from a) its aluminium
expansion plans (capacity increasing by nearly two-three folds in the next two-four
years), b) low production cost at its new capacities and c) the expected turnaround
at Novelis. We maintain our Buy recommendation on the stock with a revised
SOTP Target Price of Rs204 (Rs208).
Exhibit 8: SOTP valuation
FY2012 EV/ EBITDA (Rs cr) Multiple EV (Rs cr) Stake (%) Attributable EV Value (Rs/share)
Hindalco (Standalone) 4,380 6.5 28,471 100 28,471 149
Novelis 4,945 5.5 27,196 100 27,196 142
Total EV 55,667 55,667 291
Less: Net debt (FY11E) 18,896 99
Value of investments @25% discount 2,280 12
Value per share 204
Source: Angel Research
Exhibit 9: Key assumptions
FY11 FY12
Sales volume (tonnes)
Aluminium 517,313 663,492
Copper 370,684 370,626
Alumina 280,000 316,650
LME prices (US $/tonne)
Aluminium 2,100 2,200
Copper 6,500 6,500
Alumina 315 330
Source: Company, Angel Research
Exhibit 10: Change in estimates
(Rs cr) Earlier estimates Revised estimates Upgrade/(downgrade) (%)
FY11E FY12E FY11E FY12E FY11E FY12E
Net sales 63,898 67,521 63,659 67,521 (0.4) 0.0
EBITDA 8,333 9,325 8,284 9,325 (0.6) 0.0
EBITDA margin (%) 13.0 13.8 13.0 13.8 (3bp) 0bp
PBT 5,282 5,610 5,233 5,612 (0.9) 0.0
Net income 3,664 3,890 3,626 3,891 (1.0) 0.0
Net margin (%) 5.7 5.8 5.7 5.8 (4bp) 0bp
Source: Company, Angel Research
Exhibit 11: EPS - Angel forecast vs. consensus
Year (%) Angel forecast Bloomberg consensus Variation (%)
FY11E 18.9 14.5 30.6
FY12E 20.3 17.6 15.3
Source: Bloomberg, Angel Research
August 03, 2010 6
13. Hindalco | 1QFY2011 Result Update
Research Team Tel: 022 - 4040 3800 E-mail: research@angeltrade.com Website: www.angeltrade.com
DISCLAIMER
This document is solely for the personal information of the recipient, and must not be singularly used as the basis of any investment
decision. Nothing in this document should be construed as investment or financial advice. Each recipient of this document should make
such investigations as they deem necessary to arrive at an independent evaluation of an investment in the securities of the companies
referred to in this document (including the merits and risks involved), and should consult their own advisors to determine the merits and
risks of such an investment.
Angel Broking Limited, its affiliates, directors, its proprietary trading and investment businesses may, from time to time, make
investment decisions that are inconsistent with or contradictory to the recommendations expressed herein. The views contained in this
document are those of the analyst, and the company may or may not subscribe to all the views expressed within.
Reports based on technical and derivative analysis center on studying charts of a stock's price movement, outstanding positions and
trading volume, as opposed to focusing on a company's fundamentals and, as such, may not match with a report on a company's
fundamentals.
The information in this document has been printed on the basis of publicly available information, internal data and other reliable
sources believed to be true, but we do not represent that it is accurate or complete and it should not be relied on as such, as this
document is for general guidance only. Angel Broking Limited or any of its affiliates/ group companies shall not be in any way
responsible for any loss or damage that may arise to any person from any inadvertent error in the information contained in this report.
Angel Broking Limited has not independently verified all the information contained within this document. Accordingly, we cannot testify,
nor make any representation or warranty, express or implied, to the accuracy, contents or data contained within this document. While
Angel Broking Limited endeavours to update on a reasonable basis the information discussed in this material, there may be regulatory,
compliance, or other reasons that prevent us from doing so.
This document is being supplied to you solely for your information, and its contents, information or data may not be reproduced,
redistributed or passed on, directly or indirectly.
Angel Broking Limited and its affiliates may seek to provide or have engaged in providing corporate finance, investment banking or
other advisory services in a merger or specific transaction to the companies referred to in this report, as on the date of this report or in
the past.
Neither Angel Broking Limited, nor its directors, employees or affiliates shall be liable for any loss or damage that may arise from or in
connection with the use of this information.
Note: Please refer to the important `Stock Holding Disclosure' report on the Angel website (Research Section). Also, please
refer to the latest update on respective stocks for the disclosure status in respect of those stocks. Angel Broking Limited and
its affiliates may have investment positions in the stocks recommended in this report.
Disclosure of Interest Statement Hindalco
1. Analyst ownership of the stock No
2. Angel and its Group companies ownership of the stock No
3. Angel and its Group companies' Directors ownership of the stock No
4. Broking relationship with company covered No
Note: We have not considered any Exposure below Rs 1 lakh for Angel, its Group companies and Directors.
Ratings (Returns) : Buy (> 15%) Accumulate (5% to 15%) Neutral (-5 to 5%)
Reduce (-5% to 15%) Sell (< -15%)
August 03, 2010 13