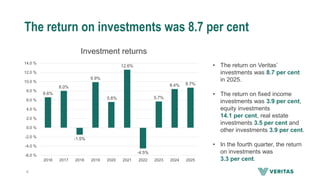
In 2025, the return on Veritas’ fixed-term investments was 3.9 per cent, equity investments 14.1 per cent, real estate investments 3.5 per cent and other investments 3.9 per cent.
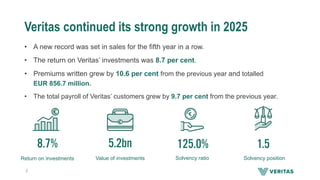
Veritas continued itsstrong growth in 2025
• A new record was set in sales for the fifth year in a row.
• The return on Veritas’ investments was 8.7 per cent.
• Premiums written grew by 10.6 per cent from the previous year and totalled
EUR 856.7 million.
• The total payroll of Veritas’ customers grew by 9.7 per cent from the previous year.
5.2bn
Value of investments
1.5
Solvency position
125.0%
Solvency ratio
8.7%
Return on investments
2
The return oninvestments was 8.7 per cent
Investment returns
6.6%
8.0%
-1.5%
9.9%
5.6%
12.6%
-4.5%
5.7%
8.4% 8.7%
-6.0 %
-4.0 %
-2.0 %
0.0 %
2.0 %
4.0 %
6.0 %
8.0 %
10.0 %
12.0 %
14.0 %
2016 2017 2018 2019 2020 2021 2022 2023 2024 2025
• The return on Veritas’
investments was 8.7 per cent
in 2025.
• The return on fixed income
investments was 3.9 per cent,
equity investments
14.1 per cent, real estate
investments 3.5 per cent and
other investments 3.9 per cent.
• In the fourth quarter, the return
on investments was
3.3 per cent.
4
5.
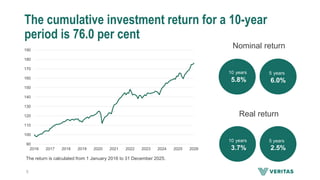
The cumulative investmentreturn for a 10-year
period is 76.0 per cent
90
100
110
120
130
140
150
160
170
180
190
2016 2017 2018 2019 2020 2021 2022 2023 2024 2025 2026
The return is calculated from 1 January 2016 to 31 December 2025.
Nominal return
Real return
5
10 years
5.8%
5 years
6.0%
10 years
3.7%
5 years
2.5%
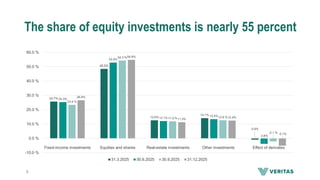
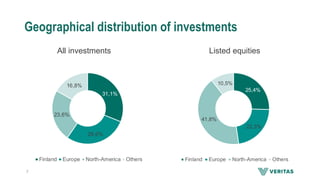
Geographical distribution ofinvestments
All investments Listed equities
7
31,1%
28,6%
23,6%
16,8%
Finland Europe North-America Others
25,4%
22,3%
41,8%
10,5%
Finland Europe North-America Others
8.
Breakdown of investmentsat fair value
¹ Includes accrued interest
² Includes cash and bank balance as well as
settlement receivables and liabilities
³ Includes private equity and mezzanine funds
⁴ Includes unlisted real estate investment
companies
⁵ Includes all types of hedge fund shares,
regardless of the fund’s strategy
⁶ Includes items that cannot be allocated to other
investment groups
⁷ Includes the effect of derivatives on the
difference between risk-adjusted breakdown and
basic breakdown. The effect may be positive or
negative (+/-). When the effect is taken into
account, the sums of the risk-adjusted
breakdown and the basic breakdown are equal.
⁸ The relative proportion is calculated using the
total of the line ‘Total investments at fair value’ as
the divisor.
The table has been compiled according to the
guidelines of the Finnish Pension Alliance Tela.
8
Basic breakdown
Risk-adjusted
breakdown
Return
31 Dec 2025 31 Dec 2025 1-12/2025
EUR million % EUR million % ⁸ %
Fixed-income investments 1 185.2 22.8 1 384.1 26.6 3.9
Loan receivables ¹ 65.7 1.3 65.7 1.3 5.4
Bonds ¹ 992.5 19.1 1 191.3 22.9 4.1
Government bonds 642.5 12.3 841.4 16.2 4.4
Other bonds 349.9 6.7 349.9 6.7 3.6
Other money market instruments and deposits ¹ ² 127.1 2.4 127.1 2.4 2.6
Equity investments 2 788.5 53.5 2 852.8 54.8 14.1
Listed equities 2 221.5 42.6 2 285.7 43.9 17.1
Private equity investments ³ 492.7 9.5 492.7 9.5 2.9
Unlisted equities ⁴ 74.4 1.4 74.4 1.4 6.0
Real estate investments 590.6 11.3 590.6 11.3 3.5
Direct real estate investments 485.7 9.3 485.7 9.3 4.7
Real estate funds 104.9 2.0 104.9 2.0 -1.6
Other investments 645.4 12.4 645.4 12.4 3.9
Hedge fund investments ⁵ 502.0 9.6 502.0 9.6 2.6
Other investments ⁶ 143.4 2.8 143.4 2.8 8.6
Total investments 5 209.7 100.0 5 472.8 105.1 8.7
Effect of derivatives ⁷ -263.1 -5.1
Total investments at fair value 5 209.7 100.0
Modified duration of the bond portfolio 5.7
Open currency position, % of the market value of investments 26.4
9.
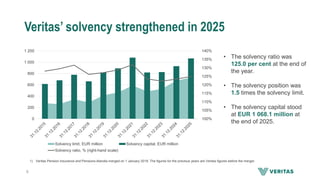
Veritas’ solvency strengthenedin 2025
100%
105%
110%
115%
120%
125%
130%
135%
140%
0
200
400
600
800
1 000
1 200
Solvency limit, EUR million Solvency capital, EUR million
Solvency ratio, % (right-hand scale)
• The solvency ratio was
125.0 per cent at the end of
the year.
• The solvency position was
1.5 times the solvency limit.
• The solvency capital stood
at EUR 1 068.1 million at
the end of 2025.
1) Veritas Pension Insurance and Pensions-Alandia merged on 1 January 2019. The figures for the previous years are Veritas figures before the merger.
9
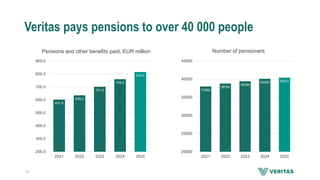
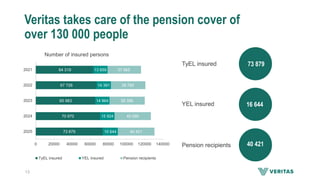
Veritas pays pensionsto over 40 000 people
Pensions and other benefits paid, EUR million
601.9
635.2
701.0
759.6
815.0
200.0
300.0
400.0
500.0
600.0
700.0
800.0
900.0
2021 2022 2023 2024 2025
Number of pensioners
37965
38785
39396
40090 40421
20000
25000
30000
35000
40000
45000
2021 2022 2023 2024 2025
11
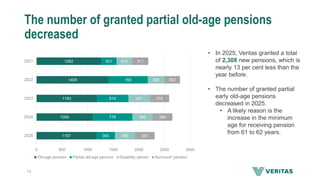
12.
The number ofgranted partial old-age pensions
decreased
12
• In 2025, Veritas granted a total
of 2,308 new pensions, which is
nearly 13 per cent less than the
year before.
• The number of granted partial
early old-age pensions
decreased in 2025.
• A likely reason is the
increase in the minimum
age for receiving pension
from 61 to 62 years.
1167
1095
1180
1408
1262
365
778
614
765
301
389
395
421
326
310
387
385
376
303
311
0 500 1000 1500 2000 2500 3000
2025
2024
2023
2022
2021
Old-age pension Partial old-age pension Disability penion Survivors' pension
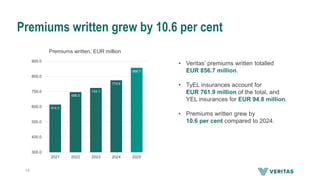
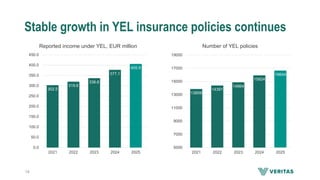
Premiums written grewby 10.6 per cent
Premiums written, EUR million
614.3
696.5
724.1
774.6
856.7
300.0
400.0
500.0
600.0
700.0
800.0
900.0
2021 2022 2023 2024 2025
• Veritas’ premiums written totalled
EUR 856.7 million.
• TyEL insurances account for
EUR 761.9 million of the total, and
YEL insurances for EUR 94.8 million.
• Premiums written grew by
10.6 per cent compared to 2024.
14
15.
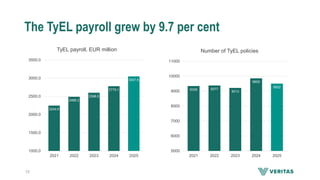
The TyEL payrollgrew by 9.7 per cent
TyEL payroll, EUR million
2244.6
2488.2
2598.9
2779.1
3047.6
1000.0
1500.0
2000.0
2500.0
3000.0
3500.0
2021 2022 2023 2024 2025
Number of TyEL policies
9339 9377
9213
9859
9502
5000
6000
7000
8000
9000
10000
11000
2021 2022 2023 2024 2025
15
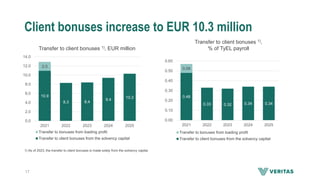
Client bonuses increaseto EUR 10.3 million
Transfer to client bonuses 1), EUR million
10.9
8.3 8.4
9.4
10.3
2.0
0.0
2.0
4.0
6.0
8.0
10.0
12.0
14.0
2021 2022 2023 2024 2025
Transfer to bonuses from loading profit
Transfer to client bonuses from the solvency capital
Transfer to client bonuses 1),
% of TyEL payroll
0.48
0.33 0.32 0.34 0.34
0.09
0.00
0.10
0.20
0.30
0.40
0.50
0.60
2021 2022 2023 2024 2025
Transfer to bonuses from loading profit
Transfer to client bonuses from the solvency capital
1) As of 2023, the transfer to client bonuses is made solely from the solvency capital.
17
18.
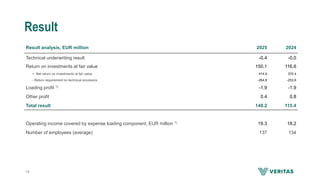
Result
18
Result analysis, EURmillion 2025 2024
Technical underwriting result -0.4 -0.0
Return on investments at fair value 150.1 116.6
+ Net return on investments at fair value 414.9 370.4
- Return requirement on technical provisions -264.8 -253.8
Loading profit 1) -1.9 -1.9
Other profit 0.4 0.8
Total result 148.2 115.4
Operating income covered by expense loading component, EUR million 1) 19.3 18.2
Number of employees (average) 137 134
19.
Outlook for 2026
•Finland’s economic growth appears to be picking up. Growth is particularly visible in the
export sector, although consumers remain cautious.
• The turnaround in employment growth in the final quarter of the year is positive news
and is also reflected in the pension sector’s premiums written.
• Growth in the euro area is strengthening this year, helped by German fiscal stimulus,
particularly through increased defense spending.
• In the United States, economic growth remains steady. Alongside a strong services
sector, the manufacturing sector is also returning to a growth trajectory.
• Markets remain cautious regarding public sector deficits and sustainability, which, at
worst, could limit investment in infrastructure, climate change mitigation, and research
and development.
• The pension reform is set to be submitted to Parliament as a legislative proposal during
the spring.
• The government is preparing a proposal to reform the pension system for entrepreneurs.
• Veritas is developing a new customer-focused strategy.
19