Download to read offline
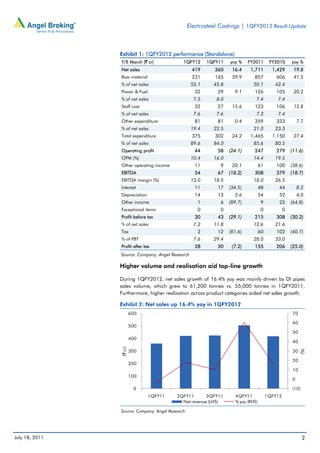
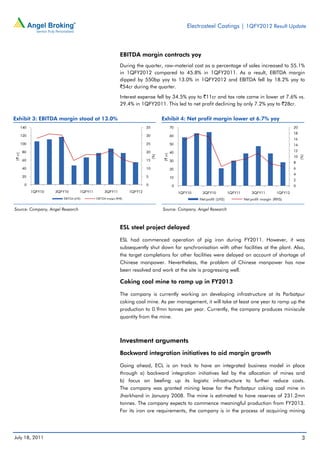
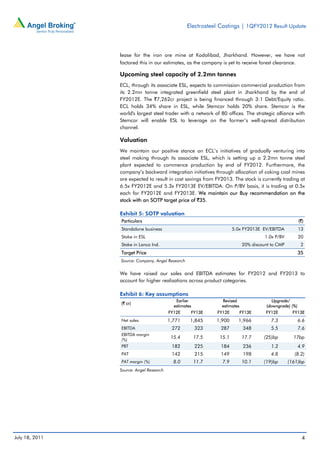
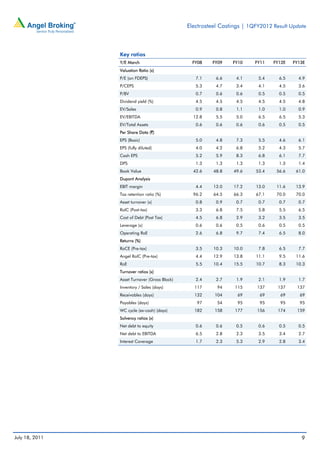

1) For 1QFY2012, Electrosteel Castings reported 16.4% sales growth but margins declined due to higher raw material costs. EBITDA fell 18.2% and net profit declined 7.2%. 2) While sales volumes grew, costs increased more due to a rise in raw material costs as a percentage of sales. 3) The company maintains a buy recommendation due to initiatives in steelmaking and backward integration that should lower costs starting in FY2013 and valuation remains attractive.


