SlideShare a Scribd company logo
1 of 7
Download to read offline
4QFY2010 Result Update I Capital Goods
                                                                                                                           May 24, 2010


  Jyoti Structures                                                                         BUY
                                                                                           CMP                                    Rs139
  Performance Highlights                                                                   Target Price                           Rs215
  Jyoti Structures reported a moderate 4QFY2010 performance, with a 20.3%                  Investment Period                   12 Months
  yoy growth in its bottom-line to Rs25cr, which was slightly below our
  estimates. The operating margins of the company, however, surprised                      Stock Info
  positively, with a wider-than-expected 235bp expansion at 12.8%. Currently,
                                                                                           Sector                        Capital Goods
  the stock trades at 10.3x FY2011E EPS and at 8.4x FY2012E EPS. We
  maintain our Buy recommendation on the stock.                                            Market Cap (Rs cr)                      1139

                                                                                           Beta                                      0.9
  Operating margins expand: Jyoti Structures posted a moderate top-line
  growth of 16.1% yoy to Rs546cr (Rs470cr) for 4QFY2010, primarily driven by               52 WK High / Low                     197/115
  the steady execution of its outstanding order book. For FY2010, the
  company’s top-line grew by 16.8% yoy to Rs2,006cr (Rs1,717cr).                           Avg. Daily Volume                     127069

                                                                                           Face Value (Rs)                             2
  On the operating front, however, the company surprised positively, with a
  wider-than-expected expansion in the EBITDA margin, by 235bp to 12.8%                    BSE Sensex                            16,070
  (10.4%). This was primarily driven by lower raw material costs (including                Nifty                                  4,944
  erection and sub-contracting expenses), which reduced by a substantial
  244bp to 73.2% (75.6%) of net sales. For the full year FY2010, the company               Reuters Code                         JYTS.BO
  broadly maintained its operating margins at 11.3% (11.4%).
                                                                                           Bloomberg Code                        JYS@IN

  However, higher depreciation, coupled with a higher effective tax rate,                  Shareholding Pattern (%)
  resulted in a moderate 20.3% yoy growth in the net profit to Rs25cr (Rs21cr)
  for the quarter. For the full year FY2010, the net profit grew by 15.3% yoy to           Promoters                                26.8
  Rs92cr (Rs80cr).                                                                         MF/Banks/Indian FIs                      40.6

  Outlook and Valuation                                                                    FII/NRIs/OCBs                            19.7

                                                                                           Indian Public                            12.9
  Jyoti Structures is among the top three players in the Transmission Engineering
  Procurement Construction (EPC) space in India. We believe that the company               Abs. (%)            3m        1yr         3yr
  will continue to ride high on the back of the massive investments lined-up in
                                                                                           Sensex              1.3       18.6       15.8
  the Transmission sector of the country. At the current price, the stock is
  quoting at 10.3x and at 8.4x its FY2011E and FY2012E EPS, respectively,                  JSL               (10.2)      10.6       (25.6)
  which we believe is attractive. We maintain our Buy recommendation on the
  stock, with a Target Price of Rs215.

    Key Financials
    Y/E March (Rs cr)                FY2009         FY2010        FY2011E   FY2012E
   Net Sales                           1,717          2,006         2,447     2,851
   % chg                                 25.3           16.8         22.0      16.5
   Adj Net Profit                          80             92         111       135
   % chg                                 10.1           15.3         20.3      22.4
   EBITDA (%)                            11.4           11.3         11.0      11.0
   EPS (Rs)                               9.7           11.2         13.5      16.5
   P/E (x)                               14.3           12.4         10.3       8.4
   P/BV (x)                               2.7            2.3          1.9       1.6
   RoE (%)                               21.1           20.1         20.2      20.6
   RoCE (%)                              19.6           18.5         18.8      19.3
                                                                                         Puneet Bambha
   EV/Sales (x)                           0.8            0.7          0.6       0.5
                                                                                         Tel: 022 – 4040 3800 Ext: 347
   EV/EBITDA (x)                          7.2            6.5          5.5       4.7
                                                                                         E-mail: puneet.bambha@angeltrade.com
   Source: Company, Angel Research


                                                                                                                                           1
Please refer to important disclosures at the end of this report                             Sebi Registration No: INB 010996539
Jyoti Structures I 4QFY2010 Result Update


               Exhibit 1: 4QFY2010 Performance
               Y/E March (Rs cr)                    4QFY10     4QFY09         % chg          FY10         FY09   % chg
               Net Sales                              545.6      469.9         16.1       2,006.0      1,717.1    16.8
               Raw Material                           311.2      271.5         14.6       1,234.2      1,101.9    12.0
               (% of Net Sales)                        57.0       57.8                       61.5         64.2
               Erection & Sub contracting              88.0       83.8            5.0       303.7        220.1      38.0
               (% of Net Sales)                        16.1       17.8                       15.1         12.8
               Employee Cost                           16.4       11.5           42.2        59.9         43.5      37.7
               (% of Net Sales)                         3.0        2.5                        3.0          2.5
               Other Expenses                          60.3       54.1           11.5       180.9        155.6      16.2
               (% of Net Sales)                        11.1       11.5                        9.0          9.1
               Total Expenditure                      475.9      420.9           13.1     1,778.8      1,521.1      16.9
               EBITDA                                  69.7       49.0           42.3       227.3        195.9      16.0
               EBITDA (%)                              12.8       10.4                       11.3         11.4
               Interest                                24.9       19.0         30.9          78.6         68.3      15.2
               Depreciation                             6.2        2.9        115.5          16.9          8.6      95.6
               Other Income                             2.0        3.8        (45.6)         12.6          7.3      71.7
               Profit before Tax                       40.7       30.9         31.8         144.4        126.4      14.2
               (% of Net Sales)                         7.5        6.6                        7.2          7.4
               Total Tax                               15.4        9.8           56.4        52.4         46.6      12.5
               (% of PBT)                              37.8       31.9                       36.3         36.9
               Reported PAT                            25.3       21.0           20.3        91.9         79.7      15.3
               (% of Net Sales)                         4.6        4.5                        4.6          4.6
               Source: Company, Angel Research


               Order Book

               The order backlog came in at Rs4,150cr, up 15.1% yoy. Transmission, sub-station
               and rural electrification segments constitute 70%, 10% and 20% of the backlog,
               respectively. On a geographical basis, the international orders constituted only
               around 10% of the order book, while the rest was accounted for by domestic orders.
               The order inflows for the quarter grew by 16.7% yoy to Rs665cr (Rs570cr).

               Exhibit 2: Order Book Trend
                          4,500                                                                              4150
                                                                             3959                   4030
                                                                                          3869
                          4,000              3616                   3606
                                    3560               3510
                          3,500
                          3,000
                          2,500
                (Rs cr)


                          2,000
                          1,500
                          1,000                                            843
                                  551                          570                               681       665
                                           484                                          408
                           500                       322

                             0
                                  1QFY09   2QFY09   3QFY09    4QFY09       1QFY10       2QFY10   3QFY10    4QFY10

                                                     Order Inflow      Order Backlog

               Source: Company, Angel Research


May 24, 2010                                                                                                         2
Jyoti Structures I 4QFY2010 Result Update

               Outlook and Valuation

               Jyoti Structures is among the top three players in the Transmission Engineering
               Procurement Construction (EPC) space in India. We believe that the company will
               continue to ride high on the back of the massive investments lined up in the
               Transmission Sector of the country. Besides, the company's large domestic presence
               helps to insulate its margins from raw material price fluctuations and volatile
               currency movements.

               At the current price, the stock is quoting at 10.3x and at 8.4x its FY2011E and
               FY2012E EPS, respectively, well below its average P/E of 13-13.5x in the past five
               years. Going ahead, we expect the stock to outperform and maintain our Buy
               recommendation on the stock, with a 12-month Target Price of Rs215.

               Exhibit 3: 12-month Forward Rolling P/E Band
                                     350
                                                                                                                                                                21x
                                     300

                                     250                                                                                                                        17x
                  Share Price (Rs)


                                     200
                                                                                                                                                                13x

                                     150
                                                                                                                                                                9x
                                     100
                                                                                                                                                                5x
                                     50

                                       0
                                           Apr-04


                                                             Apr-05


                                                                               Apr-06


                                                                                                 Apr-07


                                                                                                                   Apr-08


                                                                                                                                     Apr-09


                                                                                                                                                       Apr-10
                                                    Oct-04


                                                                      Oct-05


                                                                                        Oct-06


                                                                                                          Oct-07


                                                                                                                            Oct-08


                                                                                                                                              Oct-09
               Source: C-line, Angel Research


May 24, 2010                                                                                                                                                          3
Jyoti Structures I 4QFY2010 Result Update


               Profit & Loss Statement                                                           (Rs cr)
               Y/E March                      FY2007   FY2008    FY2009    FY2010E    FY2011E    FY2012E
               Net Sales                        971     1,370     1,717      2,006      2,447      2,851
               Other operating income              -         -         -          -          -          -
               Total operating income           971     1,370     1,717      2,006      2,447      2,851
               % chg                            39.1     41.2      25.3       16.8       22.0       16.5
               Total Expenditure                845     1,199     1,521      1,779      2,177      2,537
               Net Raw Materials                588       894     1,102      1,234      1,518      1,776
               Other Mfg costs                  231       270       376        485        589        681
               Personnel                         27        35        44         60         71         80
               Other                               -         -         -          -          -          -
               EBITDA                           125       172       196        227        270        314
               % chg                            67.7     37.1      14.0       16.0       18.7       16.5
               (% of Net Sales)                 12.9     12.5      11.4       11.3       11.0       11.0
               Depreciation& Amortisation        5.8       6.7       8.6      16.9       20.9       23.5
               EBIT                             120       165       187        210        249        291
               % chg                            70.9     38.1      13.4       12.3       18.3       16.9
               (% of Net Sales)                 12.3     12.1      10.9       10.5       10.2       10.2
               Interest & other Charges          33        46        68         79         91         95
               Other Income                        1         2         7        13         13         14
               (% of PBT)                        0.9       1.3       5.8        8.7        7.9        6.8
               Others                              -         -         -          -          -          -
               Recurring PBT                     88       120       126        144        171        210
               % chg                            89.4     37.4        5.1      14.2       18.8       22.4
               Extraordinary Expense/(Inc.)      0.5       4.6         -          -          -          -
               PBT (reported)                    87       116       126        144        171        210
               Tax                              32.5     47.8      46.6       52.4       60.9       74.5
               (% of PBT)                       37.3     41.3      36.9       36.3       35.5       35.5
               PAT (reported)                    55        68        80         92        111        135
               Add: Share of earnings of
                                                   -         -         -          -          -             -
               associate
               Less: Minority interest (MI)        -        -         -          -          -          -
               Prior period items                  -        -         -          -          -          -
               PAT after MI (reported)           55       68        80         92        111        135
               ADJ. PAT                          55       72        80         92        111        135
               % chg                            98.8     31.6      10.1       15.3       20.3       22.4
               (% of Net Sales)                  5.7      5.3       4.6        4.6        4.5        4.7
               Basic EPS (Rs)                    6.8      8.9       9.8       11.2       13.5       16.5
               Fully Diluted EPS (Rs)            6.7      8.8       9.7       11.2       13.5       16.5
               % chg                            98.8     31.6      10.1       15.3       20.3       22.4


May 24, 2010                                                                                               4
Jyoti Structures I 4QFY2010 Result Update


               Balance Sheet                                                                        (Rs cr)
               Y/E March                      FY2007     FY2008     FY2009     FY2010E    FY2011E   FY2012E
               SOURCES OF FUNDS
               Equity Share Capital              16         16         16          16         16          16
               Preference Capital                 -          -          -           -          -           -
               Reserves& Surplus                260        325        400         483        582         703
               Shareholders Funds               276        341        417         499        598         719
               Minority Interest                  -          -          -           -          -           -
               Total Loans                      159        225        304         369        389         389
               Deferred Tax Liability             8          8          8           8          8           8
               Total Liabilities                443        574        729         876        995       1,116
               APPLICATION OF FUNDS
               Gross Block                       94        106         169         231        262        292
               Less: Acc. Depreciation           37         44          52          69         90        114
               Net Block                         56         62         117         162        172        178
               Capital Work-in-Progress           0          1           4           2          1          1
               Goodwill                           -          -           -           -          -          -
               Investments                       19         16          23          23         23         23
               Current Assets                   646        824       1,101       1,156      1,478      1,569
               Cash                               9         14          30          41         52         49
               Loans & Advances                 106        115         178         201        245        285
               Other                             91        118          93         110        135        157
               Current liabilities              280        331         517         469        680        657
               Net Current Assets               366        493         583         688        798        912
               Mis. Exp. not written off          2          2           1           1          1          1
               Total Assets                     443        574         729         876        995      1,116


               Cash Flow Statement                                                                   (Rs cr)
               Y/E March                      FY2007     FY2008     FY2009     FY2010E    FY2011E   FY2012E
               Profit before tax                   87       116        126        144        171          210
               Depreciation                          6          7          9        17         21           24
               (Inc)/Dec in Working Capital    (141)      (123)        (74)       (93)       (99)       (118)
               Less: Other income                    1          2          7        13         13           14
               Direct taxes paid                   33         47         46         52         61           75
               Cash Flow from Operations         (82)       (50)           7          3        19           27
               (Inc.)/Dec.in Fixed Assets          (7)      (13)       (66)       (60)       (30)         (30)
               (Inc.)/Dec. in Investments          (2)          3        (7)          -         -             -
               Other income                          1          2          7        13         13           14
               Cash Flow from Investing            (8)        (9)      (66)       (47)       (17)         (16)
               Issue of Equity                   105            4          4          0         -             -
               Inc./(Dec.) in loans                (1)        65         79         65         20             -
               Dividend Paid (Incl. Tax)             6          8          9        10         12           14
               Others                              (2)          2          1        (0)         -             -
               Cash Flow from Financing            98         61         74         55          8         (14)
               Inc./(Dec.) in Cash                   5          5        16         11         11           (3)
               Opening Cash balances                 4          9        14         30         41           52
               Closing Cash balances                 9        14         30         41         52           49


May 24, 2010                                                                                                      5
Jyoti Structures I 4QFY2010 Result Update


               Key Ratios
               Y/E March                         FY2007   FY2008   FY2009   FY2010E   FY2011E   FY2012E
               Valuation Ratio (x)
               P/E (on FDEPS)                      20.7     15.7     14.3      12.4      10.3       8.4
               P/CEPS                              18.7     14.4     12.9      10.5       8.7       7.2
               P/BV                                 4.2      3.4      2.7       2.3       1.9       1.6
               Dividend yield (%)                   0.4      0.6      0.6       0.7       0.9       1.1
               EV/Sales                             1.3      1.0      0.8       0.7       0.6       0.5
               EV/EBITDA                           10.3      7.9      7.2       6.5       5.5       4.7
               EV/Total Assets                      2.9      2.4      1.9       1.7       1.5       1.3
               Per Share Data (Rs)
               EPS (Basic)                          6.8      8.9      9.8      11.2      13.5      16.5
               EPS (fully diluted)                  6.7      8.8      9.7      11.2      13.5      16.5
               Cash EPS                             7.4      9.6     10.8      13.3      16.0      19.4
               DPS                                  0.6      0.8      0.9       1.0       1.2       1.5
               Book Value                          33.3     41.4     50.7      60.7      72.8      87.6
               Dupont Analysis
               EBIT margin (%)                     12.3     12.1     10.9      10.5      10.2      10.2
               Tax retention ratio                  0.6      0.6      0.6       0.6       0.6       0.6
               Asset turnover (x)                   2.7      2.8      2.7       2.6       2.8       2.8
               ROIC (Post-tax) (%)                 20.9     19.5     18.8      17.5      18.1      18.7
               Cost of Debt (Post Tax) (%)         12.9     14.2     16.3      14.9      15.5      15.8
               Leverage (x)                         0.5      0.6      0.7       0.7       0.6       0.5
               Operating RoE (%)                   25.3     22.8     20.4      19.2      19.5      20.0
               Returns (%)
               RoCE (Pre-tax)                      32.6     32.5     28.8      26.2      26.6      27.6
               Angel RoIC (Pre-tax)                33.4     33.3     29.9      27.6      28.1      29.0
               RoE                                 27.9     23.6     21.1      20.1      20.2      20.6
               Turnover ratios (x)
               Asset Turnover (Gross Block)        10.8     13.8     12.5      10.0      9.9       10.3
               Inventory / Sales (days)             37       21       24        26        23        22
               Receivables (days)                  115      115      123       120       115       114
               Payables (days)                      68       56       64        62        60        60
               Working capital cycle (ex-cash)
                                                   134      128      118       118       111       111
               (days)
               Solvency ratios (x)
               Net debt to equity                   0.5      0.6      0.7       0.7       0.6       0.5
               Net debt to EBITDA                   1.2      1.2      1.4       1.4       1.2       1.1
               Interest Coverage (EBIT /
                                                    3.6      3.6      2.7       2.7       2.7       3.1
               Interest)


May 24, 2010                                                                                          6
Jyoti Structures I 4QFY2010 Result Update


Research Team Tel: 022-4040 3800                                          E-mail: research@angeltrade.com                                       Website: www.angeltrade.com


DISCLAIMER

This document is solely for the personal information of the recipient, and must not be singularly used as the basis of any investment decision. Nothing in this
document should be construed as investment or financial advice. Each recipient of this document should make such investigations as they deem necessary to
arrive at an independent evaluation of an investment in the securities of the companies referred to in this document (including the merits and risks involved),
and should consult their own advisors to determine the merits and risks of such an investment.

Angel Securities Limited, its affiliates, directors, its proprietary trading and investment businesses may, from time to time, make investment decisions that are
inconsistent with or contradictory to the recommendations expressed herein. The views contained in this document are those of the analyst, and the company
may or may not subscribe to all the views expressed within.

Reports based on technical and derivative analysis center on studying charts of a stock's price movement, outstanding positions and trading volume, as
opposed to focusing on a company's fundamentals and, as such, may not match with a report on a company's fundamentals.

The information in this document has been printed on the basis of publicly available information, internal data and other reliable sources believed to be true,
and are for general guidance only. Angel Securities Limited has not independently verified all the information contained within this document. Accordingly,
we cannot testify, nor make any representation or warranty, express or implied, to the accuracy, contents or data contained within this document. While
Angel Securities Limited endeavours to update on a reasonable basis the information discussed in this material, there may be regulatory, compliance, or
other reasons that prevent us from doing so.

This document is being supplied to you solely for your information, and its contents, information or data may not be reproduced, redistributed or passed on,
directly or indirectly.

Angel Securities Limited and its affiliates may seek to provide or have engaged in providing corporate finance, investment banking or other advisory services
in a merger or specific transaction to the companies referred to in this report, as on the date of this report or in the past.

Neither Angel Securities Limited nor its directors, employees and affiliates shall be liable for any loss or damage that may arise from or in connection with the
use of this information.
Note: Please refer to the important `Stock Holding Disclosure' report on the Angel website (Research Section).


 Disclosure of Interest Statement                                                                            Jyoti Structures
 1.    Analyst ownership of the stock                                                                               No
 2.    Angel and its Group companies ownership of the stock                                                         No
 3.    Angel and its Group companies’ Directors ownership of the stock                                              No
 4.    Broking relationship with company covered                                                                    No
 Note: We have not considered any Exposure below Rs 1 lakh for Angel and its Group companies.


                                Address: Acme Plaza, ‘A’ Wing, 3rd Floor, M.V. Road, Opp. Sangam Cinema, Andheri (E), Mumbai - 400 059.
                                                                    Tel : (022) 3952 4568 / 4040 3800


    Angel Broking Ltd: BSE Sebi Regn No : INB 010996539 / CDSL Regn No: IN - DP - CDSL - 234 - 2004 / PMS Regn Code: PM/INP000001546 Angel Securities Ltd:BSE: INB010994639/INF010994639 NSE:
    INB230994635/INF230994635 Membership numbers: BSE 028/NSE:09946
    Angel Capital & Debt Market Ltd: INB 231279838 / NSE FNO: INF 231279838 / NSE Member code -12798 Angel Commodities Broking (P) Ltd: MCX Member ID: 12685 / FMC Regn No: MCX / TCM /
    CORP / 0037 NCDEX : Member ID 00220 / FMC Regn No: NCDEX / TCM / CORP / 0302


May 24, 2010                                                                                                                                                                                7

More Related Content

What's hot (20)

Infosys ru2 qfy2011-151010
Infosys  ru2 qfy2011-151010Infosys  ru2 qfy2011-151010
Infosys ru2 qfy2011-151010
 
3i Infotech
3i Infotech3i Infotech
3i Infotech
 
Graphite india ru4 qfy2010-140510
Graphite india ru4 qfy2010-140510Graphite india ru4 qfy2010-140510
Graphite india ru4 qfy2010-140510
 
Infosys - Result Update
Infosys  - Result UpdateInfosys  - Result Update
Infosys - Result Update
 
Fag y2010-220410
Fag y2010-220410Fag y2010-220410
Fag y2010-220410
 
Infosys 4QFY2010 Result Update
Infosys 4QFY2010 Result UpdateInfosys 4QFY2010 Result Update
Infosys 4QFY2010 Result Update
 
SAIL
SAILSAIL
SAIL
 
Tech Mahindra
Tech Mahindra Tech Mahindra
Tech Mahindra
 
Wipro
Wipro  Wipro
Wipro
 
Hindalco novelis ru4 qfy2010-280510
Hindalco novelis ru4 qfy2010-280510Hindalco novelis ru4 qfy2010-280510
Hindalco novelis ru4 qfy2010-280510
 
Exide Industries
Exide IndustriesExide Industries
Exide Industries
 
HUL
HULHUL
HUL
 
RIL Result Update
RIL Result UpdateRIL Result Update
RIL Result Update
 
Mphasis
MphasisMphasis
Mphasis
 
RIL - result Update
RIL - result UpdateRIL - result Update
RIL - result Update
 
BHEL -Result Update
BHEL -Result UpdateBHEL -Result Update
BHEL -Result Update
 
Hindalco Novelis
Hindalco Novelis Hindalco Novelis
Hindalco Novelis
 
UPL
UPLUPL
UPL
 
Bharti Airtel
Bharti AirtelBharti Airtel
Bharti Airtel
 
Exide
Exide Exide
Exide
 

Viewers also liked

Tech report 04.06.2010
Tech report 04.06.2010Tech report 04.06.2010
Tech report 04.06.2010Angel Broking
 
Market outlook 05 10 10
Market outlook 05 10 10Market outlook 05 10 10
Market outlook 05 10 10Angel Broking
 
Derivatives report 19 apr 2010
Derivatives report   19 apr 2010Derivatives report   19 apr 2010
Derivatives report 19 apr 2010Angel Broking
 
Derivatives report 21 oct-2010
Derivatives report 21 oct-2010Derivatives report 21 oct-2010
Derivatives report 21 oct-2010Angel Broking
 
Gail india event update - 200410
Gail india   event update - 200410Gail india   event update - 200410
Gail india event update - 200410Angel Broking
 
Derivatives report 20 apr-2010
Derivatives report 20 apr-2010Derivatives report 20 apr-2010
Derivatives report 20 apr-2010Angel Broking
 
Tech report 21.04.2010
Tech report 21.04.2010Tech report 21.04.2010
Tech report 21.04.2010Angel Broking
 
Derivatives report 26 may-2010
Derivatives report 26 may-2010Derivatives report 26 may-2010
Derivatives report 26 may-2010Angel Broking
 
Techical Report - July 12, 2010
Techical Report - July 12, 2010Techical Report - July 12, 2010
Techical Report - July 12, 2010Angel Broking
 
Angel Broking Market Strategy May 2010
Angel Broking Market Strategy May 2010Angel Broking Market Strategy May 2010
Angel Broking Market Strategy May 2010Angel Broking
 
Derivatives report 24 may-2010
Derivatives report 24 may-2010Derivatives report 24 may-2010
Derivatives report 24 may-2010Angel Broking
 
Indraprastha Gas Ltd.- Company Update-June 22, 2010
Indraprastha Gas Ltd.- Company Update-June 22, 2010Indraprastha Gas Ltd.- Company Update-June 22, 2010
Indraprastha Gas Ltd.- Company Update-June 22, 2010Angel Broking
 
Derivatives report -August 11, 2010
Derivatives report -August 11, 2010Derivatives report -August 11, 2010
Derivatives report -August 11, 2010Angel Broking
 
ICICI Bank Result Update
ICICI Bank Result UpdateICICI Bank Result Update
ICICI Bank Result UpdateAngel Broking
 
Indraprastha Gas Ltd.- Company Update-June 22, 2010
Indraprastha Gas Ltd.- Company Update-June 22, 2010Indraprastha Gas Ltd.- Company Update-June 22, 2010
Indraprastha Gas Ltd.- Company Update-June 22, 2010Angel Broking
 
Market outlook 01 10 10
Market outlook 01 10 10Market outlook 01 10 10
Market outlook 01 10 10Angel Broking
 

Viewers also liked (17)

Tech report 04.06.2010
Tech report 04.06.2010Tech report 04.06.2010
Tech report 04.06.2010
 
Asian Paints
Asian PaintsAsian Paints
Asian Paints
 
Market outlook 05 10 10
Market outlook 05 10 10Market outlook 05 10 10
Market outlook 05 10 10
 
Derivatives report 19 apr 2010
Derivatives report   19 apr 2010Derivatives report   19 apr 2010
Derivatives report 19 apr 2010
 
Derivatives report 21 oct-2010
Derivatives report 21 oct-2010Derivatives report 21 oct-2010
Derivatives report 21 oct-2010
 
Gail india event update - 200410
Gail india   event update - 200410Gail india   event update - 200410
Gail india event update - 200410
 
Derivatives report 20 apr-2010
Derivatives report 20 apr-2010Derivatives report 20 apr-2010
Derivatives report 20 apr-2010
 
Tech report 21.04.2010
Tech report 21.04.2010Tech report 21.04.2010
Tech report 21.04.2010
 
Derivatives report 26 may-2010
Derivatives report 26 may-2010Derivatives report 26 may-2010
Derivatives report 26 may-2010
 
Techical Report - July 12, 2010
Techical Report - July 12, 2010Techical Report - July 12, 2010
Techical Report - July 12, 2010
 
Angel Broking Market Strategy May 2010
Angel Broking Market Strategy May 2010Angel Broking Market Strategy May 2010
Angel Broking Market Strategy May 2010
 
Derivatives report 24 may-2010
Derivatives report 24 may-2010Derivatives report 24 may-2010
Derivatives report 24 may-2010
 
Indraprastha Gas Ltd.- Company Update-June 22, 2010
Indraprastha Gas Ltd.- Company Update-June 22, 2010Indraprastha Gas Ltd.- Company Update-June 22, 2010
Indraprastha Gas Ltd.- Company Update-June 22, 2010
 
Derivatives report -August 11, 2010
Derivatives report -August 11, 2010Derivatives report -August 11, 2010
Derivatives report -August 11, 2010
 
ICICI Bank Result Update
ICICI Bank Result UpdateICICI Bank Result Update
ICICI Bank Result Update
 
Indraprastha Gas Ltd.- Company Update-June 22, 2010
Indraprastha Gas Ltd.- Company Update-June 22, 2010Indraprastha Gas Ltd.- Company Update-June 22, 2010
Indraprastha Gas Ltd.- Company Update-June 22, 2010
 
Market outlook 01 10 10
Market outlook 01 10 10Market outlook 01 10 10
Market outlook 01 10 10
 

Similar to Jyoti Structures 4QFY2010 earnings update

Ashok leyland ru4 qfy2010-300410
Ashok leyland ru4 qfy2010-300410Ashok leyland ru4 qfy2010-300410
Ashok leyland ru4 qfy2010-300410Angel Broking
 
Infotech Result Update
Infotech Result UpdateInfotech Result Update
Infotech Result UpdateAngel Broking
 
R com ru4-qfy2010-180510
R com ru4-qfy2010-180510R com ru4-qfy2010-180510
R com ru4-qfy2010-180510Angel Broking
 
Niit ru4 qfy2010-130510
Niit ru4 qfy2010-130510Niit ru4 qfy2010-130510
Niit ru4 qfy2010-130510Angel Broking
 
TCS 4QFY2010 Results Update
TCS 4QFY2010 Results UpdateTCS 4QFY2010 Results Update
TCS 4QFY2010 Results UpdateAngel Broking
 
JISL Result Update 4 qfy2010-120510
JISL Result Update 4 qfy2010-120510JISL Result Update 4 qfy2010-120510
JISL Result Update 4 qfy2010-120510Angel Broking
 
Bharat forge ru4 qfy2010-210510
Bharat forge ru4 qfy2010-210510Bharat forge ru4 qfy2010-210510
Bharat forge ru4 qfy2010-210510Angel Broking
 
Bgr energy ru4 qfy2010-010610
Bgr energy ru4 qfy2010-010610Bgr energy ru4 qfy2010-010610
Bgr energy ru4 qfy2010-010610Angel Broking
 
Tvs motor ru4 qfy2010-21042010
Tvs motor ru4 qfy2010-21042010Tvs motor ru4 qfy2010-21042010
Tvs motor ru4 qfy2010-21042010Angel Broking
 
Jk tyre ru4 qfy2010-260510
Jk tyre ru4 qfy2010-260510Jk tyre ru4 qfy2010-260510
Jk tyre ru4 qfy2010-260510Angel Broking
 
Gipcl ru4 qfy2010-260510
Gipcl ru4 qfy2010-260510Gipcl ru4 qfy2010-260510
Gipcl ru4 qfy2010-260510Angel Broking
 
Anant raj ru4 qfy2010-280510
Anant raj ru4 qfy2010-280510Anant raj ru4 qfy2010-280510
Anant raj ru4 qfy2010-280510Angel Broking
 

Similar to Jyoti Structures 4QFY2010 earnings update (20)

Ashok leyland ru4 qfy2010-300410
Ashok leyland ru4 qfy2010-300410Ashok leyland ru4 qfy2010-300410
Ashok leyland ru4 qfy2010-300410
 
Infotech Result Update
Infotech Result UpdateInfotech Result Update
Infotech Result Update
 
R com ru4-qfy2010-180510
R com ru4-qfy2010-180510R com ru4-qfy2010-180510
R com ru4-qfy2010-180510
 
Subros
Subros Subros
Subros
 
Tcs Result Update
Tcs  Result UpdateTcs  Result Update
Tcs Result Update
 
Niit ru4 qfy2010-130510
Niit ru4 qfy2010-130510Niit ru4 qfy2010-130510
Niit ru4 qfy2010-130510
 
TCS 4QFY2010 Results Update
TCS 4QFY2010 Results UpdateTCS 4QFY2010 Results Update
TCS 4QFY2010 Results Update
 
JISL Result Update 4 qfy2010-120510
JISL Result Update 4 qfy2010-120510JISL Result Update 4 qfy2010-120510
JISL Result Update 4 qfy2010-120510
 
Bharat forge ru4 qfy2010-210510
Bharat forge ru4 qfy2010-210510Bharat forge ru4 qfy2010-210510
Bharat forge ru4 qfy2010-210510
 
Hindalco
Hindalco Hindalco
Hindalco
 
Simplex Infra
Simplex InfraSimplex Infra
Simplex Infra
 
JP Associates
JP AssociatesJP Associates
JP Associates
 
Bgr energy ru4 qfy2010-010610
Bgr energy ru4 qfy2010-010610Bgr energy ru4 qfy2010-010610
Bgr energy ru4 qfy2010-010610
 
Tvs motor ru4 qfy2010-21042010
Tvs motor ru4 qfy2010-21042010Tvs motor ru4 qfy2010-21042010
Tvs motor ru4 qfy2010-21042010
 
Wipro Result Update
Wipro Result UpdateWipro Result Update
Wipro Result Update
 
Wipro Result Update
Wipro Result UpdateWipro Result Update
Wipro Result Update
 
Jk tyre ru4 qfy2010-260510
Jk tyre ru4 qfy2010-260510Jk tyre ru4 qfy2010-260510
Jk tyre ru4 qfy2010-260510
 
Gipcl ru4 qfy2010-260510
Gipcl ru4 qfy2010-260510Gipcl ru4 qfy2010-260510
Gipcl ru4 qfy2010-260510
 
Anant raj ru4 qfy2010-280510
Anant raj ru4 qfy2010-280510Anant raj ru4 qfy2010-280510
Anant raj ru4 qfy2010-280510
 
Greenply
Greenply Greenply
Greenply
 

More from Angel Broking

Market outlook 110612
Market outlook 110612Market outlook 110612
Market outlook 110612Angel Broking
 
Axis%20 bank ru1qfy2012-220711
Axis%20 bank ru1qfy2012-220711Axis%20 bank ru1qfy2012-220711
Axis%20 bank ru1qfy2012-220711Angel Broking
 
Electrosteel castings
Electrosteel castingsElectrosteel castings
Electrosteel castingsAngel Broking
 
Derivative report 19th July 2011
Derivative report 19th July 2011Derivative report 19th July 2011
Derivative report 19th July 2011Angel Broking
 
Market outlook 19th July 2011
Market outlook 19th July 2011Market outlook 19th July 2011
Market outlook 19th July 2011Angel Broking
 
Weekly Report 18th July 2011
Weekly Report 18th July 2011Weekly Report 18th July 2011
Weekly Report 18th July 2011Angel Broking
 
Derivative Report 18th July 2011
Derivative Report 18th July 2011Derivative Report 18th July 2011
Derivative Report 18th July 2011Angel Broking
 
Technical Report 18th July 2011
Technical Report 18th July 2011Technical Report 18th July 2011
Technical Report 18th July 2011Angel Broking
 
Market Outlook 18th July 2011
Market Outlook 18th July 2011Market Outlook 18th July 2011
Market Outlook 18th July 2011Angel Broking
 
Bajaj auto Result Updated
Bajaj auto Result UpdatedBajaj auto Result Updated
Bajaj auto Result UpdatedAngel Broking
 
Tata consultancy services
Tata consultancy services Tata consultancy services
Tata consultancy services Angel Broking
 
Derivatives Report 15th July 2011
Derivatives Report 15th July 2011Derivatives Report 15th July 2011
Derivatives Report 15th July 2011Angel Broking
 
Technical Report 15th July 2011
Technical Report 15th July 2011Technical Report 15th July 2011
Technical Report 15th July 2011Angel Broking
 
Infosys Result Updated
Infosys Result UpdatedInfosys Result Updated
Infosys Result UpdatedAngel Broking
 
Derivative Report 13th July 2011
Derivative Report 13th July 2011Derivative Report 13th July 2011
Derivative Report 13th July 2011Angel Broking
 

More from Angel Broking (20)

Market outlook 110612
Market outlook 110612Market outlook 110612
Market outlook 110612
 
Axis%20 bank ru1qfy2012-220711
Axis%20 bank ru1qfy2012-220711Axis%20 bank ru1qfy2012-220711
Axis%20 bank ru1qfy2012-220711
 
Electrosteel castings
Electrosteel castingsElectrosteel castings
Electrosteel castings
 
Persistent systems
Persistent systemsPersistent systems
Persistent systems
 
Ht media
Ht mediaHt media
Ht media
 
Derivative report 19th July 2011
Derivative report 19th July 2011Derivative report 19th July 2011
Derivative report 19th July 2011
 
Market outlook 19th July 2011
Market outlook 19th July 2011Market outlook 19th July 2011
Market outlook 19th July 2011
 
Telecom sector
Telecom sectorTelecom sector
Telecom sector
 
Weekly Report 18th July 2011
Weekly Report 18th July 2011Weekly Report 18th July 2011
Weekly Report 18th July 2011
 
Derivative Report 18th July 2011
Derivative Report 18th July 2011Derivative Report 18th July 2011
Derivative Report 18th July 2011
 
Technical Report 18th July 2011
Technical Report 18th July 2011Technical Report 18th July 2011
Technical Report 18th July 2011
 
Market Outlook 18th July 2011
Market Outlook 18th July 2011Market Outlook 18th July 2011
Market Outlook 18th July 2011
 
South Indian Bank
 South Indian Bank South Indian Bank
South Indian Bank
 
Bajaj auto Result Updated
Bajaj auto Result UpdatedBajaj auto Result Updated
Bajaj auto Result Updated
 
Tata consultancy services
Tata consultancy services Tata consultancy services
Tata consultancy services
 
Fc4 e63c4d01
Fc4 e63c4d01Fc4 e63c4d01
Fc4 e63c4d01
 
Derivatives Report 15th July 2011
Derivatives Report 15th July 2011Derivatives Report 15th July 2011
Derivatives Report 15th July 2011
 
Technical Report 15th July 2011
Technical Report 15th July 2011Technical Report 15th July 2011
Technical Report 15th July 2011
 
Infosys Result Updated
Infosys Result UpdatedInfosys Result Updated
Infosys Result Updated
 
Derivative Report 13th July 2011
Derivative Report 13th July 2011Derivative Report 13th July 2011
Derivative Report 13th July 2011
 

Recently uploaded

High Class Call Girls Nagpur Grishma Call 7001035870 Meet With Nagpur Escorts
High Class Call Girls Nagpur Grishma Call 7001035870 Meet With Nagpur EscortsHigh Class Call Girls Nagpur Grishma Call 7001035870 Meet With Nagpur Escorts
High Class Call Girls Nagpur Grishma Call 7001035870 Meet With Nagpur Escortsranjana rawat
 
The Economic History of the U.S. Lecture 18.pdf
The Economic History of the U.S. Lecture 18.pdfThe Economic History of the U.S. Lecture 18.pdf
The Economic History of the U.S. Lecture 18.pdfGale Pooley
 
The Economic History of the U.S. Lecture 17.pdf
The Economic History of the U.S. Lecture 17.pdfThe Economic History of the U.S. Lecture 17.pdf
The Economic History of the U.S. Lecture 17.pdfGale Pooley
 
Quarter 4- Module 3 Principles of Marketing
Quarter 4- Module 3 Principles of MarketingQuarter 4- Module 3 Principles of Marketing
Quarter 4- Module 3 Principles of MarketingMaristelaRamos12
 
Log your LOA pain with Pension Lab's brilliant campaign
Log your LOA pain with Pension Lab's brilliant campaignLog your LOA pain with Pension Lab's brilliant campaign
Log your LOA pain with Pension Lab's brilliant campaignHenry Tapper
 
Andheri Call Girls In 9825968104 Mumbai Hot Models
Andheri Call Girls In 9825968104 Mumbai Hot ModelsAndheri Call Girls In 9825968104 Mumbai Hot Models
Andheri Call Girls In 9825968104 Mumbai Hot Modelshematsharma006
 
Call Girls In Yusuf Sarai Women Seeking Men 9654467111
Call Girls In Yusuf Sarai Women Seeking Men 9654467111Call Girls In Yusuf Sarai Women Seeking Men 9654467111
Call Girls In Yusuf Sarai Women Seeking Men 9654467111Sapana Sha
 
Call Girls Service Nagpur Maya Call 7001035870 Meet With Nagpur Escorts
Call Girls Service Nagpur Maya Call 7001035870 Meet With Nagpur EscortsCall Girls Service Nagpur Maya Call 7001035870 Meet With Nagpur Escorts
Call Girls Service Nagpur Maya Call 7001035870 Meet With Nagpur Escortsranjana rawat
 
Q3 2024 Earnings Conference Call and Webcast Slides
Q3 2024 Earnings Conference Call and Webcast SlidesQ3 2024 Earnings Conference Call and Webcast Slides
Q3 2024 Earnings Conference Call and Webcast SlidesMarketing847413
 
Lundin Gold April 2024 Corporate Presentation v4.pdf
Lundin Gold April 2024 Corporate Presentation v4.pdfLundin Gold April 2024 Corporate Presentation v4.pdf
Lundin Gold April 2024 Corporate Presentation v4.pdfAdnet Communications
 
Booking open Available Pune Call Girls Shivane 6297143586 Call Hot Indian Gi...
Booking open Available Pune Call Girls Shivane  6297143586 Call Hot Indian Gi...Booking open Available Pune Call Girls Shivane  6297143586 Call Hot Indian Gi...
Booking open Available Pune Call Girls Shivane 6297143586 Call Hot Indian Gi...Call Girls in Nagpur High Profile
 
Dividend Policy and Dividend Decision Theories.pptx
Dividend Policy and Dividend Decision Theories.pptxDividend Policy and Dividend Decision Theories.pptx
Dividend Policy and Dividend Decision Theories.pptxanshikagoel52
 
fca-bsps-decision-letter-redacted (1).pdf
fca-bsps-decision-letter-redacted (1).pdffca-bsps-decision-letter-redacted (1).pdf
fca-bsps-decision-letter-redacted (1).pdfHenry Tapper
 
High Class Call Girls Nashik Maya 7001305949 Independent Escort Service Nashik
High Class Call Girls Nashik Maya 7001305949 Independent Escort Service NashikHigh Class Call Girls Nashik Maya 7001305949 Independent Escort Service Nashik
High Class Call Girls Nashik Maya 7001305949 Independent Escort Service NashikCall Girls in Nagpur High Profile
 
VIP Call Girls Service Dilsukhnagar Hyderabad Call +91-8250192130
VIP Call Girls Service Dilsukhnagar Hyderabad Call +91-8250192130VIP Call Girls Service Dilsukhnagar Hyderabad Call +91-8250192130
VIP Call Girls Service Dilsukhnagar Hyderabad Call +91-8250192130Suhani Kapoor
 
OAT_RI_Ep19 WeighingTheRisks_Apr24_TheYellowMetal.pptx
OAT_RI_Ep19 WeighingTheRisks_Apr24_TheYellowMetal.pptxOAT_RI_Ep19 WeighingTheRisks_Apr24_TheYellowMetal.pptx
OAT_RI_Ep19 WeighingTheRisks_Apr24_TheYellowMetal.pptxhiddenlevers
 
Instant Issue Debit Cards - High School Spirit
Instant Issue Debit Cards - High School SpiritInstant Issue Debit Cards - High School Spirit
Instant Issue Debit Cards - High School Spiritegoetzinger
 
06_Joeri Van Speybroek_Dell_MeetupDora&Cybersecurity.pdf
06_Joeri Van Speybroek_Dell_MeetupDora&Cybersecurity.pdf06_Joeri Van Speybroek_Dell_MeetupDora&Cybersecurity.pdf
06_Joeri Van Speybroek_Dell_MeetupDora&Cybersecurity.pdfFinTech Belgium
 

Recently uploaded (20)

High Class Call Girls Nagpur Grishma Call 7001035870 Meet With Nagpur Escorts
High Class Call Girls Nagpur Grishma Call 7001035870 Meet With Nagpur EscortsHigh Class Call Girls Nagpur Grishma Call 7001035870 Meet With Nagpur Escorts
High Class Call Girls Nagpur Grishma Call 7001035870 Meet With Nagpur Escorts
 
The Economic History of the U.S. Lecture 18.pdf
The Economic History of the U.S. Lecture 18.pdfThe Economic History of the U.S. Lecture 18.pdf
The Economic History of the U.S. Lecture 18.pdf
 
The Economic History of the U.S. Lecture 17.pdf
The Economic History of the U.S. Lecture 17.pdfThe Economic History of the U.S. Lecture 17.pdf
The Economic History of the U.S. Lecture 17.pdf
 
Quarter 4- Module 3 Principles of Marketing
Quarter 4- Module 3 Principles of MarketingQuarter 4- Module 3 Principles of Marketing
Quarter 4- Module 3 Principles of Marketing
 
Log your LOA pain with Pension Lab's brilliant campaign
Log your LOA pain with Pension Lab's brilliant campaignLog your LOA pain with Pension Lab's brilliant campaign
Log your LOA pain with Pension Lab's brilliant campaign
 
Andheri Call Girls In 9825968104 Mumbai Hot Models
Andheri Call Girls In 9825968104 Mumbai Hot ModelsAndheri Call Girls In 9825968104 Mumbai Hot Models
Andheri Call Girls In 9825968104 Mumbai Hot Models
 
Call Girls In Yusuf Sarai Women Seeking Men 9654467111
Call Girls In Yusuf Sarai Women Seeking Men 9654467111Call Girls In Yusuf Sarai Women Seeking Men 9654467111
Call Girls In Yusuf Sarai Women Seeking Men 9654467111
 
Call Girls Service Nagpur Maya Call 7001035870 Meet With Nagpur Escorts
Call Girls Service Nagpur Maya Call 7001035870 Meet With Nagpur EscortsCall Girls Service Nagpur Maya Call 7001035870 Meet With Nagpur Escorts
Call Girls Service Nagpur Maya Call 7001035870 Meet With Nagpur Escorts
 
Q3 2024 Earnings Conference Call and Webcast Slides
Q3 2024 Earnings Conference Call and Webcast SlidesQ3 2024 Earnings Conference Call and Webcast Slides
Q3 2024 Earnings Conference Call and Webcast Slides
 
Lundin Gold April 2024 Corporate Presentation v4.pdf
Lundin Gold April 2024 Corporate Presentation v4.pdfLundin Gold April 2024 Corporate Presentation v4.pdf
Lundin Gold April 2024 Corporate Presentation v4.pdf
 
Booking open Available Pune Call Girls Shivane 6297143586 Call Hot Indian Gi...
Booking open Available Pune Call Girls Shivane  6297143586 Call Hot Indian Gi...Booking open Available Pune Call Girls Shivane  6297143586 Call Hot Indian Gi...
Booking open Available Pune Call Girls Shivane 6297143586 Call Hot Indian Gi...
 
Dividend Policy and Dividend Decision Theories.pptx
Dividend Policy and Dividend Decision Theories.pptxDividend Policy and Dividend Decision Theories.pptx
Dividend Policy and Dividend Decision Theories.pptx
 
fca-bsps-decision-letter-redacted (1).pdf
fca-bsps-decision-letter-redacted (1).pdffca-bsps-decision-letter-redacted (1).pdf
fca-bsps-decision-letter-redacted (1).pdf
 
Veritas Interim Report 1 January–31 March 2024
Veritas Interim Report 1 January–31 March 2024Veritas Interim Report 1 January–31 March 2024
Veritas Interim Report 1 January–31 March 2024
 
High Class Call Girls Nashik Maya 7001305949 Independent Escort Service Nashik
High Class Call Girls Nashik Maya 7001305949 Independent Escort Service NashikHigh Class Call Girls Nashik Maya 7001305949 Independent Escort Service Nashik
High Class Call Girls Nashik Maya 7001305949 Independent Escort Service Nashik
 
VIP Call Girls Service Dilsukhnagar Hyderabad Call +91-8250192130
VIP Call Girls Service Dilsukhnagar Hyderabad Call +91-8250192130VIP Call Girls Service Dilsukhnagar Hyderabad Call +91-8250192130
VIP Call Girls Service Dilsukhnagar Hyderabad Call +91-8250192130
 
Commercial Bank Economic Capsule - April 2024
Commercial Bank Economic Capsule - April 2024Commercial Bank Economic Capsule - April 2024
Commercial Bank Economic Capsule - April 2024
 
OAT_RI_Ep19 WeighingTheRisks_Apr24_TheYellowMetal.pptx
OAT_RI_Ep19 WeighingTheRisks_Apr24_TheYellowMetal.pptxOAT_RI_Ep19 WeighingTheRisks_Apr24_TheYellowMetal.pptx
OAT_RI_Ep19 WeighingTheRisks_Apr24_TheYellowMetal.pptx
 
Instant Issue Debit Cards - High School Spirit
Instant Issue Debit Cards - High School SpiritInstant Issue Debit Cards - High School Spirit
Instant Issue Debit Cards - High School Spirit
 
06_Joeri Van Speybroek_Dell_MeetupDora&Cybersecurity.pdf
06_Joeri Van Speybroek_Dell_MeetupDora&Cybersecurity.pdf06_Joeri Van Speybroek_Dell_MeetupDora&Cybersecurity.pdf
06_Joeri Van Speybroek_Dell_MeetupDora&Cybersecurity.pdf
 

Jyoti Structures 4QFY2010 earnings update

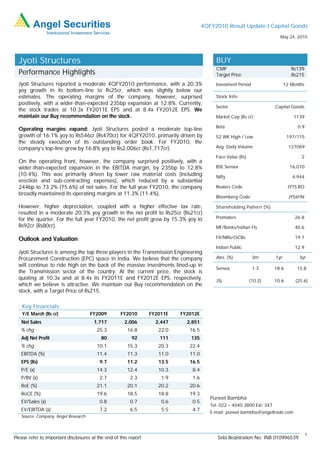
  • 1. 4QFY2010 Result Update I Capital Goods May 24, 2010 Jyoti Structures BUY CMP Rs139 Performance Highlights Target Price Rs215 Jyoti Structures reported a moderate 4QFY2010 performance, with a 20.3% Investment Period 12 Months yoy growth in its bottom-line to Rs25cr, which was slightly below our estimates. The operating margins of the company, however, surprised Stock Info positively, with a wider-than-expected 235bp expansion at 12.8%. Currently, Sector Capital Goods the stock trades at 10.3x FY2011E EPS and at 8.4x FY2012E EPS. We maintain our Buy recommendation on the stock. Market Cap (Rs cr) 1139 Beta 0.9 Operating margins expand: Jyoti Structures posted a moderate top-line growth of 16.1% yoy to Rs546cr (Rs470cr) for 4QFY2010, primarily driven by 52 WK High / Low 197/115 the steady execution of its outstanding order book. For FY2010, the company’s top-line grew by 16.8% yoy to Rs2,006cr (Rs1,717cr). Avg. Daily Volume 127069 Face Value (Rs) 2 On the operating front, however, the company surprised positively, with a wider-than-expected expansion in the EBITDA margin, by 235bp to 12.8% BSE Sensex 16,070 (10.4%). This was primarily driven by lower raw material costs (including Nifty 4,944 erection and sub-contracting expenses), which reduced by a substantial 244bp to 73.2% (75.6%) of net sales. For the full year FY2010, the company Reuters Code JYTS.BO broadly maintained its operating margins at 11.3% (11.4%). Bloomberg Code JYS@IN However, higher depreciation, coupled with a higher effective tax rate, Shareholding Pattern (%) resulted in a moderate 20.3% yoy growth in the net profit to Rs25cr (Rs21cr) for the quarter. For the full year FY2010, the net profit grew by 15.3% yoy to Promoters 26.8 Rs92cr (Rs80cr). MF/Banks/Indian FIs 40.6 Outlook and Valuation FII/NRIs/OCBs 19.7 Indian Public 12.9 Jyoti Structures is among the top three players in the Transmission Engineering Procurement Construction (EPC) space in India. We believe that the company Abs. (%) 3m 1yr 3yr will continue to ride high on the back of the massive investments lined-up in Sensex 1.3 18.6 15.8 the Transmission sector of the country. At the current price, the stock is quoting at 10.3x and at 8.4x its FY2011E and FY2012E EPS, respectively, JSL (10.2) 10.6 (25.6) which we believe is attractive. We maintain our Buy recommendation on the stock, with a Target Price of Rs215. Key Financials Y/E March (Rs cr) FY2009 FY2010 FY2011E FY2012E Net Sales 1,717 2,006 2,447 2,851 % chg 25.3 16.8 22.0 16.5 Adj Net Profit 80 92 111 135 % chg 10.1 15.3 20.3 22.4 EBITDA (%) 11.4 11.3 11.0 11.0 EPS (Rs) 9.7 11.2 13.5 16.5 P/E (x) 14.3 12.4 10.3 8.4 P/BV (x) 2.7 2.3 1.9 1.6 RoE (%) 21.1 20.1 20.2 20.6 RoCE (%) 19.6 18.5 18.8 19.3 Puneet Bambha EV/Sales (x) 0.8 0.7 0.6 0.5 Tel: 022 – 4040 3800 Ext: 347 EV/EBITDA (x) 7.2 6.5 5.5 4.7 E-mail: puneet.bambha@angeltrade.com Source: Company, Angel Research 1 Please refer to important disclosures at the end of this report Sebi Registration No: INB 010996539
  • 2. Jyoti Structures I 4QFY2010 Result Update Exhibit 1: 4QFY2010 Performance Y/E March (Rs cr) 4QFY10 4QFY09 % chg FY10 FY09 % chg Net Sales 545.6 469.9 16.1 2,006.0 1,717.1 16.8 Raw Material 311.2 271.5 14.6 1,234.2 1,101.9 12.0 (% of Net Sales) 57.0 57.8 61.5 64.2 Erection & Sub contracting 88.0 83.8 5.0 303.7 220.1 38.0 (% of Net Sales) 16.1 17.8 15.1 12.8 Employee Cost 16.4 11.5 42.2 59.9 43.5 37.7 (% of Net Sales) 3.0 2.5 3.0 2.5 Other Expenses 60.3 54.1 11.5 180.9 155.6 16.2 (% of Net Sales) 11.1 11.5 9.0 9.1 Total Expenditure 475.9 420.9 13.1 1,778.8 1,521.1 16.9 EBITDA 69.7 49.0 42.3 227.3 195.9 16.0 EBITDA (%) 12.8 10.4 11.3 11.4 Interest 24.9 19.0 30.9 78.6 68.3 15.2 Depreciation 6.2 2.9 115.5 16.9 8.6 95.6 Other Income 2.0 3.8 (45.6) 12.6 7.3 71.7 Profit before Tax 40.7 30.9 31.8 144.4 126.4 14.2 (% of Net Sales) 7.5 6.6 7.2 7.4 Total Tax 15.4 9.8 56.4 52.4 46.6 12.5 (% of PBT) 37.8 31.9 36.3 36.9 Reported PAT 25.3 21.0 20.3 91.9 79.7 15.3 (% of Net Sales) 4.6 4.5 4.6 4.6 Source: Company, Angel Research Order Book The order backlog came in at Rs4,150cr, up 15.1% yoy. Transmission, sub-station and rural electrification segments constitute 70%, 10% and 20% of the backlog, respectively. On a geographical basis, the international orders constituted only around 10% of the order book, while the rest was accounted for by domestic orders. The order inflows for the quarter grew by 16.7% yoy to Rs665cr (Rs570cr). Exhibit 2: Order Book Trend 4,500 4150 3959 4030 3869 4,000 3616 3606 3560 3510 3,500 3,000 2,500 (Rs cr) 2,000 1,500 1,000 843 551 570 681 665 484 408 500 322 0 1QFY09 2QFY09 3QFY09 4QFY09 1QFY10 2QFY10 3QFY10 4QFY10 Order Inflow Order Backlog Source: Company, Angel Research May 24, 2010 2
  • 3. Jyoti Structures I 4QFY2010 Result Update Outlook and Valuation Jyoti Structures is among the top three players in the Transmission Engineering Procurement Construction (EPC) space in India. We believe that the company will continue to ride high on the back of the massive investments lined up in the Transmission Sector of the country. Besides, the company's large domestic presence helps to insulate its margins from raw material price fluctuations and volatile currency movements. At the current price, the stock is quoting at 10.3x and at 8.4x its FY2011E and FY2012E EPS, respectively, well below its average P/E of 13-13.5x in the past five years. Going ahead, we expect the stock to outperform and maintain our Buy recommendation on the stock, with a 12-month Target Price of Rs215. Exhibit 3: 12-month Forward Rolling P/E Band 350 21x 300 250 17x Share Price (Rs) 200 13x 150 9x 100 5x 50 0 Apr-04 Apr-05 Apr-06 Apr-07 Apr-08 Apr-09 Apr-10 Oct-04 Oct-05 Oct-06 Oct-07 Oct-08 Oct-09 Source: C-line, Angel Research May 24, 2010 3
  • 4. Jyoti Structures I 4QFY2010 Result Update Profit & Loss Statement (Rs cr) Y/E March FY2007 FY2008 FY2009 FY2010E FY2011E FY2012E Net Sales 971 1,370 1,717 2,006 2,447 2,851 Other operating income - - - - - - Total operating income 971 1,370 1,717 2,006 2,447 2,851 % chg 39.1 41.2 25.3 16.8 22.0 16.5 Total Expenditure 845 1,199 1,521 1,779 2,177 2,537 Net Raw Materials 588 894 1,102 1,234 1,518 1,776 Other Mfg costs 231 270 376 485 589 681 Personnel 27 35 44 60 71 80 Other - - - - - - EBITDA 125 172 196 227 270 314 % chg 67.7 37.1 14.0 16.0 18.7 16.5 (% of Net Sales) 12.9 12.5 11.4 11.3 11.0 11.0 Depreciation& Amortisation 5.8 6.7 8.6 16.9 20.9 23.5 EBIT 120 165 187 210 249 291 % chg 70.9 38.1 13.4 12.3 18.3 16.9 (% of Net Sales) 12.3 12.1 10.9 10.5 10.2 10.2 Interest & other Charges 33 46 68 79 91 95 Other Income 1 2 7 13 13 14 (% of PBT) 0.9 1.3 5.8 8.7 7.9 6.8 Others - - - - - - Recurring PBT 88 120 126 144 171 210 % chg 89.4 37.4 5.1 14.2 18.8 22.4 Extraordinary Expense/(Inc.) 0.5 4.6 - - - - PBT (reported) 87 116 126 144 171 210 Tax 32.5 47.8 46.6 52.4 60.9 74.5 (% of PBT) 37.3 41.3 36.9 36.3 35.5 35.5 PAT (reported) 55 68 80 92 111 135 Add: Share of earnings of - - - - - - associate Less: Minority interest (MI) - - - - - - Prior period items - - - - - - PAT after MI (reported) 55 68 80 92 111 135 ADJ. PAT 55 72 80 92 111 135 % chg 98.8 31.6 10.1 15.3 20.3 22.4 (% of Net Sales) 5.7 5.3 4.6 4.6 4.5 4.7 Basic EPS (Rs) 6.8 8.9 9.8 11.2 13.5 16.5 Fully Diluted EPS (Rs) 6.7 8.8 9.7 11.2 13.5 16.5 % chg 98.8 31.6 10.1 15.3 20.3 22.4 May 24, 2010 4
  • 5. Jyoti Structures I 4QFY2010 Result Update Balance Sheet (Rs cr) Y/E March FY2007 FY2008 FY2009 FY2010E FY2011E FY2012E SOURCES OF FUNDS Equity Share Capital 16 16 16 16 16 16 Preference Capital - - - - - - Reserves& Surplus 260 325 400 483 582 703 Shareholders Funds 276 341 417 499 598 719 Minority Interest - - - - - - Total Loans 159 225 304 369 389 389 Deferred Tax Liability 8 8 8 8 8 8 Total Liabilities 443 574 729 876 995 1,116 APPLICATION OF FUNDS Gross Block 94 106 169 231 262 292 Less: Acc. Depreciation 37 44 52 69 90 114 Net Block 56 62 117 162 172 178 Capital Work-in-Progress 0 1 4 2 1 1 Goodwill - - - - - - Investments 19 16 23 23 23 23 Current Assets 646 824 1,101 1,156 1,478 1,569 Cash 9 14 30 41 52 49 Loans & Advances 106 115 178 201 245 285 Other 91 118 93 110 135 157 Current liabilities 280 331 517 469 680 657 Net Current Assets 366 493 583 688 798 912 Mis. Exp. not written off 2 2 1 1 1 1 Total Assets 443 574 729 876 995 1,116 Cash Flow Statement (Rs cr) Y/E March FY2007 FY2008 FY2009 FY2010E FY2011E FY2012E Profit before tax 87 116 126 144 171 210 Depreciation 6 7 9 17 21 24 (Inc)/Dec in Working Capital (141) (123) (74) (93) (99) (118) Less: Other income 1 2 7 13 13 14 Direct taxes paid 33 47 46 52 61 75 Cash Flow from Operations (82) (50) 7 3 19 27 (Inc.)/Dec.in Fixed Assets (7) (13) (66) (60) (30) (30) (Inc.)/Dec. in Investments (2) 3 (7) - - - Other income 1 2 7 13 13 14 Cash Flow from Investing (8) (9) (66) (47) (17) (16) Issue of Equity 105 4 4 0 - - Inc./(Dec.) in loans (1) 65 79 65 20 - Dividend Paid (Incl. Tax) 6 8 9 10 12 14 Others (2) 2 1 (0) - - Cash Flow from Financing 98 61 74 55 8 (14) Inc./(Dec.) in Cash 5 5 16 11 11 (3) Opening Cash balances 4 9 14 30 41 52 Closing Cash balances 9 14 30 41 52 49 May 24, 2010 5
  • 6. Jyoti Structures I 4QFY2010 Result Update Key Ratios Y/E March FY2007 FY2008 FY2009 FY2010E FY2011E FY2012E Valuation Ratio (x) P/E (on FDEPS) 20.7 15.7 14.3 12.4 10.3 8.4 P/CEPS 18.7 14.4 12.9 10.5 8.7 7.2 P/BV 4.2 3.4 2.7 2.3 1.9 1.6 Dividend yield (%) 0.4 0.6 0.6 0.7 0.9 1.1 EV/Sales 1.3 1.0 0.8 0.7 0.6 0.5 EV/EBITDA 10.3 7.9 7.2 6.5 5.5 4.7 EV/Total Assets 2.9 2.4 1.9 1.7 1.5 1.3 Per Share Data (Rs) EPS (Basic) 6.8 8.9 9.8 11.2 13.5 16.5 EPS (fully diluted) 6.7 8.8 9.7 11.2 13.5 16.5 Cash EPS 7.4 9.6 10.8 13.3 16.0 19.4 DPS 0.6 0.8 0.9 1.0 1.2 1.5 Book Value 33.3 41.4 50.7 60.7 72.8 87.6 Dupont Analysis EBIT margin (%) 12.3 12.1 10.9 10.5 10.2 10.2 Tax retention ratio 0.6 0.6 0.6 0.6 0.6 0.6 Asset turnover (x) 2.7 2.8 2.7 2.6 2.8 2.8 ROIC (Post-tax) (%) 20.9 19.5 18.8 17.5 18.1 18.7 Cost of Debt (Post Tax) (%) 12.9 14.2 16.3 14.9 15.5 15.8 Leverage (x) 0.5 0.6 0.7 0.7 0.6 0.5 Operating RoE (%) 25.3 22.8 20.4 19.2 19.5 20.0 Returns (%) RoCE (Pre-tax) 32.6 32.5 28.8 26.2 26.6 27.6 Angel RoIC (Pre-tax) 33.4 33.3 29.9 27.6 28.1 29.0 RoE 27.9 23.6 21.1 20.1 20.2 20.6 Turnover ratios (x) Asset Turnover (Gross Block) 10.8 13.8 12.5 10.0 9.9 10.3 Inventory / Sales (days) 37 21 24 26 23 22 Receivables (days) 115 115 123 120 115 114 Payables (days) 68 56 64 62 60 60 Working capital cycle (ex-cash) 134 128 118 118 111 111 (days) Solvency ratios (x) Net debt to equity 0.5 0.6 0.7 0.7 0.6 0.5 Net debt to EBITDA 1.2 1.2 1.4 1.4 1.2 1.1 Interest Coverage (EBIT / 3.6 3.6 2.7 2.7 2.7 3.1 Interest) May 24, 2010 6
  • 7. Jyoti Structures I 4QFY2010 Result Update Research Team Tel: 022-4040 3800 E-mail: research@angeltrade.com Website: www.angeltrade.com DISCLAIMER This document is solely for the personal information of the recipient, and must not be singularly used as the basis of any investment decision. Nothing in this document should be construed as investment or financial advice. Each recipient of this document should make such investigations as they deem necessary to arrive at an independent evaluation of an investment in the securities of the companies referred to in this document (including the merits and risks involved), and should consult their own advisors to determine the merits and risks of such an investment. Angel Securities Limited, its affiliates, directors, its proprietary trading and investment businesses may, from time to time, make investment decisions that are inconsistent with or contradictory to the recommendations expressed herein. The views contained in this document are those of the analyst, and the company may or may not subscribe to all the views expressed within. Reports based on technical and derivative analysis center on studying charts of a stock's price movement, outstanding positions and trading volume, as opposed to focusing on a company's fundamentals and, as such, may not match with a report on a company's fundamentals. The information in this document has been printed on the basis of publicly available information, internal data and other reliable sources believed to be true, and are for general guidance only. Angel Securities Limited has not independently verified all the information contained within this document. Accordingly, we cannot testify, nor make any representation or warranty, express or implied, to the accuracy, contents or data contained within this document. While Angel Securities Limited endeavours to update on a reasonable basis the information discussed in this material, there may be regulatory, compliance, or other reasons that prevent us from doing so. This document is being supplied to you solely for your information, and its contents, information or data may not be reproduced, redistributed or passed on, directly or indirectly. Angel Securities Limited and its affiliates may seek to provide or have engaged in providing corporate finance, investment banking or other advisory services in a merger or specific transaction to the companies referred to in this report, as on the date of this report or in the past. Neither Angel Securities Limited nor its directors, employees and affiliates shall be liable for any loss or damage that may arise from or in connection with the use of this information. Note: Please refer to the important `Stock Holding Disclosure' report on the Angel website (Research Section). Disclosure of Interest Statement Jyoti Structures 1. Analyst ownership of the stock No 2. Angel and its Group companies ownership of the stock No 3. Angel and its Group companies’ Directors ownership of the stock No 4. Broking relationship with company covered No Note: We have not considered any Exposure below Rs 1 lakh for Angel and its Group companies. Address: Acme Plaza, ‘A’ Wing, 3rd Floor, M.V. Road, Opp. Sangam Cinema, Andheri (E), Mumbai - 400 059. Tel : (022) 3952 4568 / 4040 3800 Angel Broking Ltd: BSE Sebi Regn No : INB 010996539 / CDSL Regn No: IN - DP - CDSL - 234 - 2004 / PMS Regn Code: PM/INP000001546 Angel Securities Ltd:BSE: INB010994639/INF010994639 NSE: INB230994635/INF230994635 Membership numbers: BSE 028/NSE:09946 Angel Capital & Debt Market Ltd: INB 231279838 / NSE FNO: INF 231279838 / NSE Member code -12798 Angel Commodities Broking (P) Ltd: MCX Member ID: 12685 / FMC Regn No: MCX / TCM / CORP / 0037 NCDEX : Member ID 00220 / FMC Regn No: NCDEX / TCM / CORP / 0302 May 24, 2010 7