VIP Call Girls Thane Sia 8617697112 Independent Escort Service Thane
Bajaj auto Result Updated
1. 1QFY2012 Result Update | Automobile
July 14, 2011
Bajaj Auto ACCUMULATE
CMP `1,431
Performance Highlights Target Price `1,512
Y/E March (` cr) 1QFY12 1QFY11 % chg (yoy) Angel est. % diff Investment Period 12 Months
Net sales 4,777 3,890 22.8 4,913 (2.8)
Stock Info
EBITDA 911 777 17.2 972 (6.3)
Sector Automobile
EBITDA margin (%) 19.1 20.0 (91)bp 19.8 (71)bp
Market Cap (Rs cr) 41,406
Reported PAT 711 590 20.5 734 (3.1)
Beta 0.7
Source: Company, Angel Research
52 Week High / Low 1,665/1,190
Bajaj Auto (BAL) reported marginally lower-than-expected results as the Avg. Daily Volume 67,322
company’s performance during 1QFY2012 was negatively impacted by a 1.8% Face Value (Rs) 10
qoq drop in average net realisation despite price hikes and margin contraction of
BSE Sensex 18,618
145bp due to raw-material cost pressures. We revise our FY2012 and FY2013
Nifty 5,600
earnings estimates downward by 4% and 8%, respectively, to factor in the
Reuters Code BAJA.BO
replacement of DEPB scheme by a duty drawback scheme post September 2011.
Bloomberg Code BJAUT@IN
We maintain our Accumulate recommendation on the stock.
Net sales driven by volume growth; profitability impacted by cost pressures: BAL
reported slightly lower-than-expected top-line growth of 22.8% yoy (13.7% Shareholding Pattern (%)
qoq) to `4,777cr, driven by a 17.7% yoy (15.3% qoq) jump in volumes. Promoters 50.0
The variance was due to lower average net realisation, which declined by MF / Banks / Indian Fls 16.8
1.8% qoq despite average price hikes of ~2% during the quarter. Two-wheeler FII / NRIs / OCBs 16.3
sales grew by 16.3% yoy, with Pulsar and Discover contributing ~65% of sales. Indian Public / Others 16.9
EBITDA margin came in 71bp below our estimate at 19.1%, registering a fall
of 91bp yoy (145bp qoq). This was a result of higher raw-material costs,
which increased by 150bp yoy (210bp qoq). This was the first time in the last Abs. (%) 3m 1yr 3yr
eight quarters when the company’s margin came in below the 20% mark. As a Sensex (5.5) 3.8 39.7
result, net profit came in lower than expected at `711cr, registering growth of
Bajaj Auto 2.4 17.1 471.0
20.5% yoy (5.2% qoq).
Outlook and valuation: We factor in the replacement of DEPB scheme by a duty
drawback scheme post September 2011, which will result in export incentives of
1% as compared to 9% under the DEPB scheme. Hence, we expect a ~175bp
contraction in operating margins and a ~8% decline in earnings. At `1,431, the
stock is trading at 14.2x FY2013E earnings. We maintain our Accumulate view on
the stock with a target price of `1,512, valuing it at 15x FY2013E earnings.
Key financials
Y/E March (` cr) FY2010 FY2011 FY2012E FY2013E
Net sales 11,921 16,609 19,717 22,544
% chg 35.3 39.3 18.7 14.3
Adj. net profit 1,784 2,750 2,800 2,918
% chg 132.0 54.1 1.8 4.2
EBITDA margin (%) 20.2 19.7 18.6 17.6
Adj. EPS (`) 61.7 95.0 96.8 100.8
P/E (x) 24.3 15.1 14.8 14.2
P/BV (x) 14.1 8.4 6.9 5.6
RoE (%) 74.4 70.2 51.3 43.5
RoCE (%) 58.8 66.2 61.6 54.9
Yaresh Kothari
EV/Sales (x) 3.2 2.1 1.7 1.4
022-3935 7800 Ext: 6844
EV/EBITDA (x) 16.1 11.1 9.6 8.5
yareshb.kothari@angelbroking.com
Source: Company, Angel Research
Please refer to important disclosures at the end of this report 1
3. Bajaj Auto | 1QFY2012 Result Update
Marginally lower-than-expected top-line performance: BAL reported slightly lower-
than-expected top-line growth of 22.8% yoy (13.7% qoq) to `4,777cr, driven by a
17.7% yoy (15.3% qoq) jump in volumes. The variance in growth was due to lower
average net realisation, which declined by 1.8% qoq despite average price hikes of
~2% during the quarter. On a yoy basis, however, average net realisations grew
by 4.3% to `41,973. Motorcycle sales grew by 16.3% yoy with Pulsar and Discover
contributing ~65% of sales, while three-wheelers registered strong 29.9% yoy
growth. BAL’s exports continued to see strong traction and posted ~40% yoy
revenue growth during to `1,688cr, owing to a 31.9% yoy increase in volumes.
Other operating income also posted robust 24.6% yoy growth to `190cr, aiding
the top-line performance.
The company’s domestic motorcycle sales grew by 10% (underperforming the
industry growth of 17.4%) in 1QFY2012, while domestic three-wheeler sales
increased by 11.3% yoy (against 4.9% industry growth). As a result of the
underperformance in the domestic motorcycle segment, the company’s market
share declined by 80bp qoq to 25.3% in 1QFY2012 from 26.1% in 4QFY2011.
On the exports front, demand remained robust as motorcycle and three-wheeler
volumes recorded robust 29.7% and 41.4% yoy growth, respectively, in
1QFY2012.
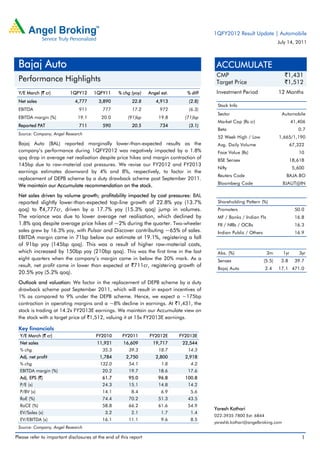
Exhibit 3: Sales growth driven by volume and realisation Exhibit 4: Domestic market share across categories
(`cr) Net sales (LHS) Net sales growth (RHS) (%) (%) Three-wheelers Motorcycles Total Two-wheelers
5,000 90 41.2 40.6 40.9 42.1
45 38.5 38.6 38.3
4,500 80 37.5 36.4
65.4 40
4,000 84.1 70
57.9 35 28.6
3,500 60 26.8 27.5 27.0 25.6 26.1
30 25.3
3,000 22.6
49.7 50 25 19.5
2,500
40 20
2,000 27.2
23.1 30 15 21.1 21.2 20.8 21.8
1,500 22.7 19.5 19.9 19.5
17.7
1,000 1.6 20 10 15.5
14.0 10
500 5
0 0 0
1QFY10
2QFY10
3QFY10
4QFY10
1QFY11
2QFY11
3QFY11
4QFY11
1QFY12
1QFY10
2QFY10
3QFY10
4QFY10
1QFY11
2QFY11
3QFY11
4QFY11
Source: Company, Angel Research; Note: Net sales excludes other Source: Company, SIAM, Angel Research 1QFY12
operating income
Operating performance hit by raw-material cost pressures: During 1QFY2012,
EBITDA margin came in 71bp below our estimate at 19.1%, registering a fall of
91bp yoy (145bp qoq). This was the first time in the last eight quarters when the
company’s margin came in below the 20% mark, primarily on account of a 150bp
yoy (210bp qoq) increase in raw-material cost, which accounted for 71.7% of net
sales during the quarter. However, lower staff cost and other expenditure coupled
with price hikes undertaken to pass on input costs helped arrest further margin
erosion. Overall, operating profit during the quarter witnessed 17.2% yoy (5.7%
qoq) growth to `911cr.
July 14, 2011 3
4. Bajaj Auto | 1QFY2012 Result Update
Exhibit 5: EBITDA margin contracts on cost pressures Exhibit 6: Net profit up 20.5% yoy
(%) EBITDA margin Raw material cost/sales (` cr) Net profit (LHS) Net profit margin (RHS) (%)
74.1 73.5 74.0 73.5 75.6 16.6 16.7
80 71.3 71.6 800 16.1 15.8 16.3 18
68.5 68.5 15.0 15.5
70 14.4 16
700 13.0
60 600 14
50 12
500
40 10
400
30 22.0 22.0 22.9 20.7 20.3 20.5 8
19.5 20.0 19.1 300
6
20 200 4
10
100 2
0
0 0
1QFY10
2QFY10
3QFY10
4QFY10
1QFY11
2QFY11
3QFY11
4QFY11
1QFY12
1QFY10
2QFY10
3QFY10
4QFY10
1QFY11
2QFY11
3QFY11
4QFY11
1QFY12
Source: Company, Angel Research; Note: Net sales excludes other Source: Company, Angel Research; Note: Net sales excludes other
operating income operating income
Net profit up 20.5% yoy on higher other income: BAL reported marginally
lower-than-expected net profit growth of 20.5% yoy (5.2% qoq) to `711cr vs. our
estimate of `734cr, largely due to lower-than-expected operating performance.
Further, the bottom-line performance was aided by lower-than-expected tax outgo.
July 14, 2011 4
5. Bajaj Auto | 1QFY2012 Result Update
Investment arguments
Focus on Discover and Pulsar to improve market share: BAL continues to
witness strong demand in the two-wheeler segment from its strong dual
offering of Discover and Pulsar. The successful launch of Discover 100cc and
125cc bike has helped BAL maintain its market share of ~25% in the domestic
motorcycle market. Further, the launch of the new Pulsar is expected to help
BAL retain its strong volume momentum. The company is positioning itself in-
line with its strategy of ‘value and price products', wherein it proposes to tap
the higher-value bike segments, which have a high-growth potential and fetch
better realisations. BAL has also launched new products in the high-margin
125cc+ segment.
Three-wheeler registering healthy growth: BAL has a strong presence in the
three-wheeler market, with an overall market share (including exports) of
~61% in June 2011. The company tops the passenger auto-rickshaw segment
(65.7% market share), which accounts for ~87% of the three-wheeler market.
The three-wheeler segment fetches higher margins than the company’s
two-wheeler business. Although competition in the domestic three-wheeler
space is intense, strong export volume growth has helped BAL post higher
volumes. As a result, we expect the company’s three-wheeler volumes to grow
by 12–13% over FY2011–13E.
High growth potential in export volumes: BAL registered strong exports CAGR
of ~35% during FY2006–11, aided by a ~40% CAGR in two-wheeler exports
and a ~25% CAGR in three-wheeler exports. Going ahead, we estimate BAL
to register a ~20% CAGR over FY2011–13E, driven by the strong demand
outlook from the exports market. BAL has hedged 90–93% of its FY2012
exports at a USD–INR rate of `47. Hence, any sharp appreciation of the INR in
FY2012 will not have a significant impact on the company’s margins.
Outlook and valuation
We factor in the replacement of DEPB scheme by a duty drawback scheme post
September 2011, which will result in export incentives of 1% as compared to 9%
under the DEPB scheme. Hence, we expect a ~175bp contraction in operating
margins and a ~8% decline in earnings. At `1,431, the stock is trading at 14.2x
FY2013E earnings. We maintain our Accumulate recommendation on the stock
with a target price of `1,512, valuing it at 15x FY2013E earnings.
Exhibit 7: Change in estimates
Y/E March Earlier estimates Revised estimates % chg
FY2012E FY2013E FY2012E FY2013E FY2012E FY2013E
Net sales (` cr) 19,654 22,380 19,717 22,544 0.3 0.7
EBITDA margin (%) 19.2 19.3 18.6 17.6 (58)bp (175)bp
EPS (`) 100.3 109.3 96.8 100.8 (3.5) (7.8)
Source: Angel Research; Note: Net sales includes other operating income
Key risks: Any increase in exports incentives from the current levels of 1% under the
duty drawback scheme post September 2011 poses an upside risk to our target
price. Further, pricing action by the company as indicated by the management to
mitigate the impact of withdrawal of the DEPB scheme on margins will lead to
revision in our earnings estimates and target price.
July 14, 2011 5
12. Bajaj Auto | 1QFY2012 Result Update
Research Team Tel: 022 - 3935 7800 E-mail: research@angelbroking.com Website: www. angelbroking.com
DISCLAIMER
This document is solely for the personal information of the recipient, and must not be singularly used as the basis of any investment
decision. Nothing in this document should be construed as investment or financial advice. Each recipient of this document should make
such investigations as they deem necessary to arrive at an independent evaluation of an investment in the securities of the companies
referred to in this document (including the merits and risks involved), and should consult their own advisors to determine the merits and
risks of such an investment.
Angel Broking Limited, its affiliates, directors, its proprietary trading and investment businesses may, from time to time, make
investment decisions that are inconsistent with or contradictory to the recommendations expressed herein. The views contained in this
document are those of the analyst, and the company may or may not subscribe to all the views expressed within.
Reports based on technical and derivative analysis center on studying charts of a stock's price movement, outstanding positions and
trading volume, as opposed to focusing on a company's fundamentals and, as such, may not match with a report on a company's
fundamentals.
The information in this document has been printed on the basis of publicly available information, internal data and other reliable
sources believed to be true, but we do not represent that it is accurate or complete and it should not be relied on as such, as this
document is for general guidance only. Angel Broking Limited or any of its affiliates/ group companies shall not be in any way
responsible for any loss or damage that may arise to any person from any inadvertent error in the information contained in this report.
Angel Broking Limited has not independently verified all the information contained within this document. Accordingly, we cannot testify,
nor make any representation or warranty, express or implied, to the accuracy, contents or data contained within this document. While
Angel Broking Limited endeavours to update on a reasonable basis the information discussed in this material, there may be regulatory,
compliance, or other reasons that prevent us from doing so.
This document is being supplied to you solely for your information, and its contents, information or data may not be reproduced,
redistributed or passed on, directly or indirectly.
Angel Broking Limited and its affiliates may seek to provide or have engaged in providing corporate finance, investment banking or
other advisory services in a merger or specific transaction to the companies referred to in this report, as on the date of this report or in
the past.
Neither Angel Broking Limited, nor its directors, employees or affiliates shall be liable for any loss or damage that may arise from or in
connection with the use of this information.
Note: Please refer to the important `Stock Holding Disclosure' report on the Angel website (Research Section). Also, please
refer to the latest update on respective stocks for the disclosure status in respect of those stocks. Angel Broking Limited and
its affiliates may have investment positions in the stocks recommended in this report.
Disclosure of Interest Statement Bajaj Auto
1. Analyst ownership of the stock No
2. Angel and its Group companies ownership of the stock No
3. Angel and its Group companies' Directors ownership of the stock No
4. Broking relationship with company covered No
Note: We have not considered any Exposure below ` 1 lakh for Angel, its Group companies and Directors.
Ratings (Returns) : Buy (> 15%) Accumulate (5% to 15%) Neutral (-5 to 5%)
Reduce (-5% to 15%) Sell (< -15%)
July 14, 2011 12