Download to read offline

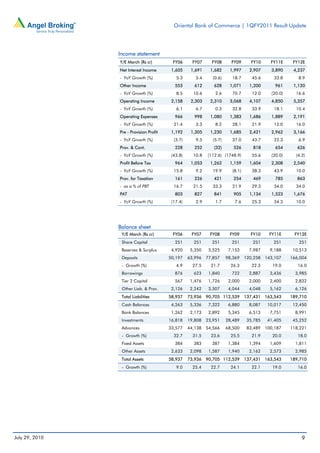
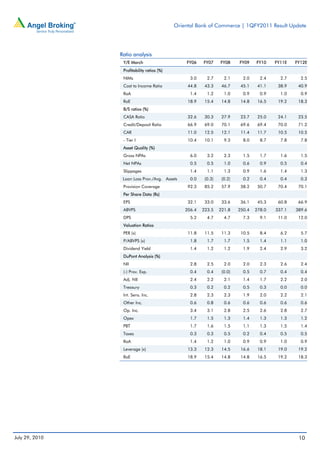
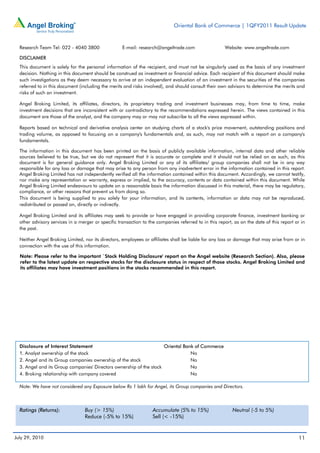

Oriental Bank of Commerce reported a 41.1% rise in net profit for the quarter compared to the same period last year. Net interest income grew 118.4% on strong loan growth of 20.3% and deposit growth of 19.8%. Asset quality was stable with gross and net NPA ratios of 1.7% and 0.7% respectively. The bank upgraded its target price for OBC stock to Rs. 409 based on improved near-term net interest margins and asset quality.


