Download to read offline
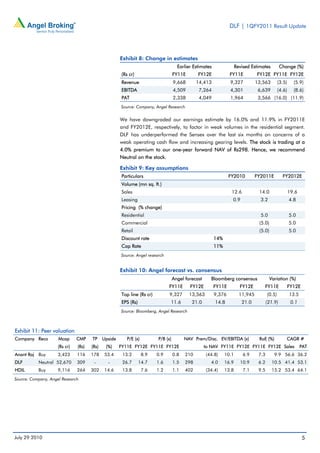
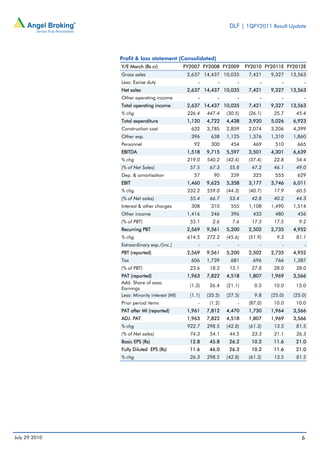
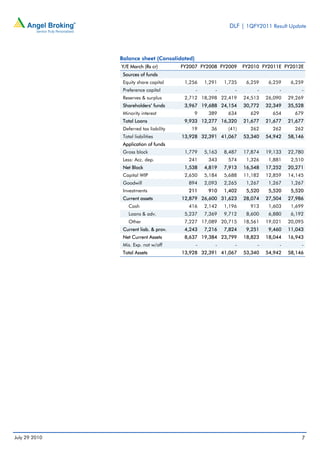
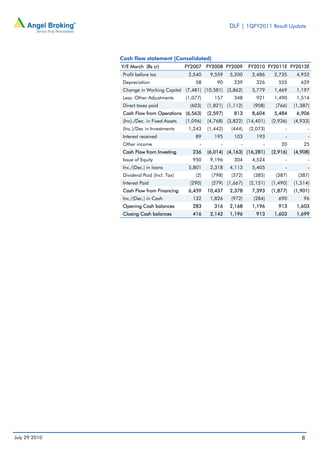
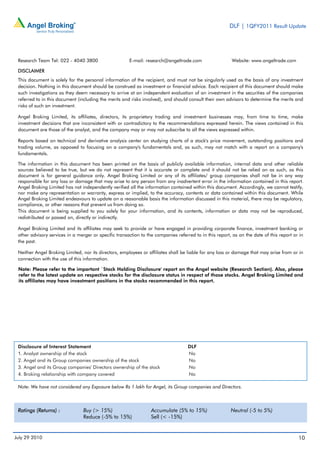

1) DLF reported revenue growth of 23% year-over-year for the quarter, but profit was below expectations due to higher interest and depreciation expenses. 2) Residential sales volumes declined significantly year-over-year due to fewer new launches and delays in approvals, while leasing volumes improved. 3) Higher debt from recent acquisitions increased interest costs and net debt levels, remaining a key concern, as the company aims to reduce leverage ratios.


