Download to read offline
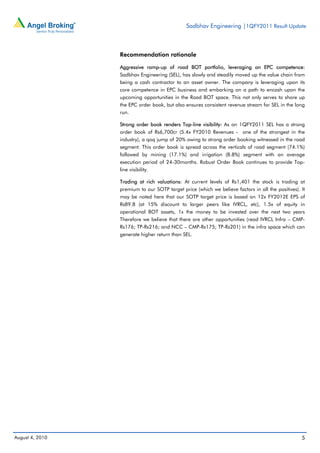

Sadbhav Engineering reported a 42% increase in net sales and 83.8% increase in net profit for the first quarter of fiscal year 2011 compared to the previous year. The company saw robust growth due to a rise in order book over the last few quarters and has guided for over 35% revenue growth over the next 12 months. However, the analyst downgraded the stock to Reduce due to rich valuations and concerns over potential execution challenges due to a record high order backlog.


