SlideShare a Scribd company logo
1 of 12
Download to read offline
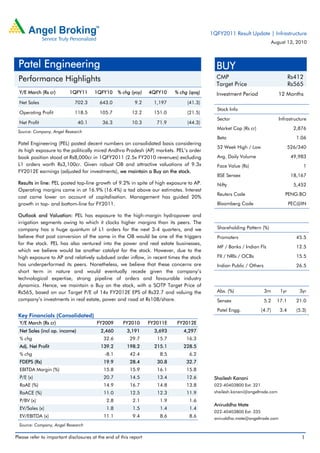
1QFY2011 Result Update | Infrastructure
                                                                                                                           August 13, 2010


     Patel Engineering                                                                      BUY
     Performance Highlights                                                                 CMP                                     Rs412
  
                                                                                            Target Price                            Rs565
     Y/E March (Rs cr)       1QFY11       1QFY10    % chg (yoy)   4QFY10    % chg (qoq)     Investment Period                 12 Months
     Net Sales                 702.3       643.0           9.2      1,197        (41.3)
                                                                                            Stock Info
     Operating Profit          118.5       105.7          12.2      151.0        (21.5)
                                                                                            Sector                            Infrastructure
     Net Profit                    40.1     36.3          10.3       71.9        (44.3)
                                                                                            Market Cap (Rs cr)                        2,876
 Source: Company, Angel Research 
                                                                                            Beta                                       1.06
 Patel Engineering (PEL) posted decent numbers on consolidated basis considering
                                                                                            52 Week High / Low                      526/340
 its high exposure to the politically mired Andhra Pradesh (AP) markets. PEL’s order
 book position stood at Rs8,000cr in 1QFY2011 (2.5x FY2010 revenues) excluding              Avg. Daily Volume                        49,983
 L1 orders worth Rs3,100cr. Given robust OB and attractive valuations of 9.3x               Face Value (Rs)                               1
 FY2012E earnings (adjusted for investments), we maintain a Buy on the stock.
                                                                                            BSE Sensex                               18,167
 Results in line: PEL posted top-line growth of 9.2% in spite of high exposure to AP.       Nifty                                     5,452
 Operating margins came in at 16.9% (16.4%) a tad above our estimates. Interest
                                                                                            Reuters Code                         PENG.BO
 cost came lower on account of capitalisation. Management has guided 20%
 growth in top- and bottom-line for FY2011.                                                 Bloomberg Code                          PEC@IN

 Outlook and Valuation: PEL has exposure to the high-margin hydropower and
 irrigation segments owing to which it clocks higher margins than its peers. The
 company has a huge quantum of L1 orders for the next 3-4 quarters, and we                  Shareholding Pattern (%)
 believe that post conversion of the same in the OB would be one of the triggers            Promoters                                  45.5
 for the stock. PEL has also ventured into the power and real estate businesses,
                                                                                            MF / Banks / Indian Fls                    12.5
 which we believe would be another catalyst for the stock. However, due to the
 high exposure to AP and relatively subdued order inflow, in recent times the stock         FII / NRIs / OCBs                          15.5
 has underperformed its peers. Nonetheless, we believe that these concerns are              Indian Public / Others                     26.5
 short term in nature and would eventually recede given the company’s
 technological expertise, strong pipeline of orders and favourable industry
 dynamics. Hence, we maintain a Buy on the stock, with a SOTP Target Price of
 Rs565, based on our Target P/E of 14x FY2012E EPS of Rs32.7 and valuing the                Abs. (%)                 3m       1yr       3yr
 company’s investments in real estate, power and road at Rs108/share.                       Sensex                   5.2     17.1      21.0
                                                                                            Patel Engg.            (4.7)      3.4      (5.3)
 Key Financials (Consolidated)
     Y/E March (Rs cr)                    FY2009      FY2010      FY2011E    FY2012E
     Net Sales (incl op. income)            2,460       3,191       3,693      4,297
     % chg                                   32.6        29.7        15.7        16.3
     Adj. Net Profit                        139.2       198.2       215.1      228.5
     % chg                                   -8.1        42.4         8.5         6.2
     FDEPS (Rs)                              19.9        28.4        30.8        32.7
     EBITDA Margin (%)                       15.8        15.9        16.1        15.8
     P/E (x)                                 20.7        14.5        13.4        12.6      Shailesh Kanani
     RoAE (%)                                14.9        16.7        14.8        13.8      022-40403800 Ext: 321
     RoACE (%)                               11.0        12.5        12.3        11.9      shailesh.kanani@angeltrade.com

     P/BV (x)                                 2.8         2.1         1.9         1.6
                                                                                           Aniruddha Mate
     EV/Sales (x)                             1.8         1.5         1.4         1.4
                                                                                           022-40403800 Ext: 335
     EV/EBITDA (x)                           11.1         9.4         8.6         8.6      aniruddha.mate@angeltrade.com
     Source: Company, Angel Research

Please refer to important disclosures at the end of this report                                                                          1
Patel Engineering|1QFY2011 Result Update


Exhibit 1: 1QFY2011 performance (consolidated)
Y/E March (Rs cr)                  1QFY11   1QFY10      4QFY10              % chg (yoy)                 % chg (qoq)               FY10                 FY09        % chg
Net Sales                           702.3    643.0       1197.1                      9.2                     (41.3)           3081.1                  2459.8        25.3
Total Expenditure                   583.8    537.3       1046.1                      8.6                     (44.2)           2591.7                  2070.2        25.2
Operating Profit                    118.5    105.7        151.0                    12.2                      (21.5)               489.4                389.7        25.6
OPM (%)                              16.9     16.4         12.6                              -                         -              15.9              15.8             -
Interest                             32.5     28.4         46.1                    14.3                      (29.5)               127.2                 47.5       167.7
Depreciation                         25.6     31.5         29.6                   (18.8)                     (13.3)               125.1                119.6         4.6
Non Operating Income                  2.6       7.8          7.1                             -               (63.9)                   60.2              14.5       316.1
Nonrecurring items                    0.0       0.0        30.0                              -                         -               0.0               0.0             -
Profit Before tax                    63.0     53.5        112.5                    17.8                      (44.0)               297.3                237.0        25.4
Tax                                  18.8     15.3         37.4                    22.5                      (49.8)                   91.7              87.8         4.5
Net Profit before MI                 44.2     38.1         75.1                    15.9                      (41.1)               205.6                149.3        37.8
PAT (%)                               6.3       5.9          6.3                             -                         -               6.7               6.1             -
Minority Interest (MI)                4.2       1.8          3.2                  130.6                       31.7                    12.3              12.9       (4.6)
Net Profit after MI                  40.1     36.3         71.9                    10.3                      (44.3)               193.3                136.4        41.8
Adj. PAT (%)                          5.7       5.7          6.0                             -                         -               6.3               5.5             -
Adj. FDEPS                            5.7       5.2        10.3                    10.3                      (44.3)                   27.7              19.5        41.8
Source: Company, Angel Research;


                                             Numbers at par: PEL posted top-line growth of 9.2% in spite of high exposure to
                                             AP. We believe that the company has fared well compared to its peers. The hydro
                                             (54%) and irrigation (22%) segments were the major revenue contributors.
                                             Management has guided for 20% revenue growth for FY2011, which we believe is
                                             aggressive given high exposure (~30%) of its order book to AP. Hence, we are
                                             factoring in CAGR of 16.0% over FY2010-12E lower than management guidance.
                                             The real estate business has still not started contributing to top-line.


                                             Exhibit 2: Top-line trend

                                                1,400                                                        37.6                                                   40
                                                1,200                             32.8                                                                              35
                                                                     30.6
                                                1,000                                                                                                               30
                                                          30.4                                                                           24.1
                                                                                                                           28.0                                     25
                                                  800
                                                                                                                                                                    20
                                                  600
                                                                                                                                                                    15
                                                  400                                            15.2
                                                                                                                                                                    10
                                                  200                                                                                                  9.2          5
                                                    0                                                                                                               0
                                                            2QFY09


                                                                        3QFY09


                                                                                    4QFY09


                                                                                                    1QFY10


                                                                                                              2QFY10


                                                                                                                             3QFY10


                                                                                                                                             4QFY10


                                                                                                                                                          1QFY11


                                                                            Sales (Rs cr, LHS)                   Growth (yoy %, RHS)

                                              Source: Company, Angel Research


August 13, 2010                                                                                                                                                          2
Patel Engineering|1QFY2011 Result Update


                                                                        On the operating front, EBITDA margins for the quarter came in at 16.9%
                                                                        (16.4%) a tad above our estimates. The company continues to enjoy high
                                                                        margins given its presence in niche segments and access to superior
                                                                        technology. Interest cost came lower on account of capitalisation of interest for
                                                                        the power projects. Going ahead as well, we believe that the company would
                                                                        be able maintain its operating margins and are penciling in similar margins
                                                                        for FY2011E and FY2012E. On the bottom-line front, we believe that the
                                                                        CAGR would me much lower given higher tax outflow and interest cost on
                                                                        account of investments in subsidiaries.

Exhibit 3: EBITDA trend                                                                      Exhibit 4: Bottom-line trend

  200               18.1                          18.7        18.8                      20       80                                                                                      9
                                                                               16.9              70                                                                                      8
  150                                            16.4                                   15       60                                                           7.6                        7
           16.6                       15.4                                                               7.6      7.2                            7.3                                     6
                                                                                                 50
  100                                                                12.6               10       40
                                                                                                                                       5.7                            6.0                5
                                                                                                                            5.0                                                 5.7      4
    50                                                                                  5        30                                                                                      3
                                                                                                 20                                                                                      2
     0                                                                                  0        10                                                                                      1
                                                                                                  0                                                                                      0
           2QFY09

                    3QFY09

                             4QFY09

                                        1QFY10

                                                   2QFY10

                                                            3QFY10

                                                                      4QFY10

                                                                               1QFY11


                                                                                                         2QFY09


                                                                                                                  3QFY09


                                                                                                                              4QFY09


                                                                                                                                       1QFY10


                                                                                                                                                2QFY10


                                                                                                                                                             3QFY10


                                                                                                                                                                       4QFY10


                                                                                                                                                                                1QFY11
               EBITDA (Rs cr, LHS)                          EBITDAM (%, RHS)                                               PAT (Rs cr, LHS)                PATM (%, RHS)


Source: Company, Angel Research                                                               Source: Company, Angel Research

                                                                        Order Book Analysis

                                                                        PEL’s order book as on 1QFY2011 stood at Rs8,000cr (2.5x FY2010 revenues)
                                                                        lower than FY2010 pending confirmation of orders worth Rs3,000cr, which are
                                                                        spread across the hydro (49%), irrigation (46%) and balance transportation
                                                                        segments. The company has maintained its guidance of achieving order book of
                                                                        Rs14,000cr (excluding the captive orders) for the fiscal.

                                                                        Exhibit 5: 1QFY2011 order backlog – Sector-wise (Rs cr)


                                                                                                                           400 

                                                                                                                                                         3,920 

                                                                                                3,680 


                                                                                              Power         Irrigation & water         Transport & Urban Infra


                                                                          Source: Company, Angel Research


August 13, 2010                                                                                                                                                                              3
Patel Engineering|1QFY2011 Result Update


                  Project Updates

                  PEL has invested equity to the tune of Rs250cr in its power ventures, which we have
                  valued at 1x. The land for the first phase (1,050MW plant in Nagapatnam district,
                  Tamil Nadu) has been acquired and coal linkages are also in place from the
                  Mahanadi coal fields. Management expects financial closure by December 2010
                  and construction work is likely to start in 2QFY2012. Further, regarding bringing in
                  a strategic partner, management clarified that it would happen only in FY2012
                  when the construction work starts gaining visibility and venture attracts right
                  valuation.

                  In real estate, the company has mentioned that the progress is satisfactory with
                  bookings of nearly 1,000 apartments for Smondoville-1 out of the total 1,100
                  apartments, which also implies that the project does not require cash and would
                  be self funded. Over the next couple of years, this project is expected to generate
                  revenues to the tune of Rs240cr.

                  Outlook and Valuation

                  Hydropower is one of the lowest cost modes of power generation and India's hydro
                  power potential is estimated at 148,701MW, which is primarily concentrated in the
                  north and north-eastern regions due to the availability of ample hydel resources.
                  Moreover, the Twelfth Five-Year Plan ((2012-17) provides significant opportunity
                  for the construction companies (read PEL) in the hydropower segment. Around
                  30,000MW hydropower capacity is expected to come up in the Twelfth Plan
                  compared to the existing 36,917MW capacity.

                  Against this backdrop, we believe that PEL will be able to maintain its 22% share
                  going ahead and garner orders of ~Rs15,250cr over the next few years.

                  Exhibit 6: PEL to gain from growing market size
                  Potential in Hydro Power segment                                               Rs cr
                  XII FYP target (MW)                                                          30,000
                  Actual Implementation (60%) (MW)                                             18,000
                  Total Industry potential @5.5cr/MW                                           99,000
                  EPC potential at 70%                                                         69,300
                  PEL's share (22%)                                                            15,246
                  Source: Company, Angel Research

                  PEL has exposure to the high-margin hydropower and irrigation segments owing to
                  which it clocks higher margins than its peers. The company has a huge quantum
                  of L1 orders for the next 3-4 quarters, and we believe that post conversion and
                  reflection of the same in the order book would be one of the key triggers for the
                  stock. PEL has also ventured into the power (leveraging on its construction abilities
                  and favourable industry dynamics) and real estate businesses (cashing on its
                  historical land bank), which we believe would be another catalyst for the stock.
                  However, due to the high exposure to AP and relatively subdued order inflow, in
                  recent times the stock has underperformed its peers. Nonetheless, we believe that
                  these concerns are short term in nature and would eventually recede given the
                  company’s technological expertise, strong pipeline of orders and favourable
                  industry dynamics. Hence, we maintain a Buy on the stock, with a SOTP Target


August 13, 2010                                                                                      4
Patel Engineering|1QFY2011 Result Update


                                                  Price of Rs565, based on our Target P/E of 14x FY2012E EPS of Rs32.7 and
                                                  valuing the company’s investments in real estate, power and road at Rs108/share.


Exhibit 7: SOTP Target Price
Business Segment                  Methodology                      Remarks                  Rs cr             Rs/share                 % to TP
Core Construction                         P/E       14x FY2012E Earnings                   3,199                457.9                     81.0
Real Estate                              NAV                  30% Discount                  392                  56.1                      9.9
BOT Assets                                BV                      1.0x P/BV                 109                  15.7                      2.8
Power Venture                             BV                      1.0x P/BV                 250                  35.8                      6.3
Total                                                                                      3,950                565.4                    100.0
CMP (Rs)                                                                                                        412.0
Upside (%)                                                                                                       37.2
Source: Company, Angel Research

Exhibit 8: Key assumptions
                                                FY2007        FY2008          FY2009                FY2010          FY2011E           FY2012E
Order Inflow                                     2,333          2,536          3,976                  5,881              5,500           7,000
Revenues                                         1,301          1,855          2,460                  3,191              3,693           4,297
Order Backlog (Y/E)                              5,008          5,684          7,200                 10,000          11,807            14,510
OB/Sales (x)                                       3.8             3.1               2.9                3.1                3.2             3.4
Source: Company, Angel Research


                                                  Exhibit 9: Angel EPS forecast v/s consensus
                                                                     Angel Forecast                 Bloomberg Consensus          Variation (%)
                                                   FY2011E               30.8                              31.5                       2.2
                                                   FY2012E               32.7                              37.9                      15.8
                                                   Source: Company, Angel Research


August 13, 2010                                                                                                                                  5
Patel Engineering|1QFY2011 Result Update


                  Investment Arguments

                  Present in niche high-margin segments

                  Traditionally, PEL has been concentrating on niche segments to maintain its
                  margins and effectively use its resources. Its core competence lies in the
                  construction of hydro power plants and upstream irrigation projects. It has been
                  involved in ~22% of the total hydro power plants in India. Hydro power projects
                  are complex, require high level of technological expertise and fetch significantly
                  high margins. Also, past experience and technical competence is critical in winning
                  contracts for hydro power and upstream irrigation projects. Therefore, it effectively
                  serves as an entry barrier restricting the number of bids to 4-5 in hydro power and
                  7-8 bidders in upstream irrigation segment. Further, the benefits of hydro projects
                  and upstream irrigation projects are that the pass on of incremental costs is high
                  compared to the other segments. In perspective, the pass on of incremental costs
                  in hydro projects is as high as 90% and in irrigation projects it is in the range of
                  70- 80%. Overall, this aids the company to maintain its margins especially in the
                  current rising commodity prices and interest rate regime. It also explains the high
                  margins enjoyed by PEL over the years.

                  Real estate and power venture the potential value creators in long run

                  PEL has rationalised its expansion plans in the real estate projects and adopted a
                  more cautious approach. Its Jogeshwari corporate park is already operational and
                  other launches (Bangalore and Noida) are seeing good response making it
                  self-funded. We see significant value locked in its land bank of 1,127 acres,
                  acquired at a cost of Rs250cr. The company has already monetised part of it in
                  Mumbai, Bangalore and Noida (not part of the above-mentioned land bank).
                  However, we have currently valued these real estate projects conservatively,
                  leaving a significant chunk that can be potentially value accretive. Further, PEL is
                  developing two power projects, one thermal in Tamil Nadu and another hydro in
                  Arunachal Pradesh. It has secured approvals to develop a 1,050MW thermal
                  power project in Nagapatnam district, Tamil Nadu, for which land has been
                  acquired and partial environment clearance have been obtained. Financial closure
                  for the project is likely by December 2010. PEL will likely offer 49% stake in the
                  project to a strategic investor, which we believe would set a benchmark for valuing
                  these projects and create value.

                  Compelling valuations

                  Over FY2007-10, although the company registered a healthy execution rate at
                  ~34%, the pace of order book was slack at a mere 20% and its order book
                  exposure to AP. We believe that these are the major reasons for the stock’s
                  underperformance on the bourses. However, we believe that with a better liquidity
                  position post the fund infusion (raised Rs340cr via QIP), strong bidding pipeline
                  (L1 for orders worth Rs3,000cr), signs of improvement in AP (receivables are down
                  from Rs200cr to Rs60cr) and robust outlook for the sector, its only a matter of time
                  before the stock garners investor fancy and would generate the outperformance.
                  Moreover, PEL is one of the cheapest stocks in our coverage universe trading at
                  single-digit P/E multiple - adjusted for its subsidiary valuations with strong
                  execution capabilities in the EPC space. We believe that current valuations are


August 13, 2010                                                                                      6
Patel Engineering|1QFY2011 Result Update


                                                               attractive and do not factor in PEL’s premium position in high margin businesses,
                                                               strong growth prospects and value unlocking potential.

Exhibit 10: Recommendation Summary
 Company         CMP        TP          Rating                   Top-line                                     EPS                            Adj. P/E              OB/
                  (Rs)     (Rs)                   FY10    FY11E         FY12E   CAGR (%)     FY10     FY11E        FY12E CAGR (%)    FY10     FY11E     FY12E      Sale
 CCCL             85       89             Acc.    1,976    2,461        2,891         21.0     5.0      5.9          7.5     22.5    17.0      14.4      11.3       2.3
 Gammon          208          -     Neutral       4,489    5,575        6,607         21.3     8.4     10.0         12.1     20.0    12.3      10.4       8.6           -
 HCC              72          -     Neutral       3,629    4,146        4,900         16.2     1.3      1.6          1.8     16.8    25.8      22.0      18.9       4.7
 IRB Infra       291          -     Neutral       1,705    2,778        3,580         44.9    11.6     12.3         14.5     11.8    25.1      23.6      20.1           -
 IVRCL           162      216             Buy     5,492    6,493        8,071         21.2     7.8      9.2         11.6     21.6    13.7      11.7       9.3       4.3
 JP Assoc.       121      174             Buy    10,316   13,281       17,843         31.5     4.7      5.2          7.7     28.5    25.9      23.2      15.7           -
 Punj            117      156             Buy    10,448    9,756       12,402          9.0   (11.1)     5.6         11.2        -       -      20.8      10.4       2.8
 NCC             161      201             Buy     4,778    5,913        6,758         18.9     7.8      8.9         10.1     13.7    13.0      11.3      10.0       3.6
 Sadbhav        1,477    1,313      Reduce        1,257    1,621        1,986         25.7    43.0     77.4         89.8     44.4    24.6      13.7      11.4       5.4
 SI.             470      570             Buy     4,555    5,535        6,428         18.8    25.7     31.9         40.7     25.9    18.3      14.7      11.5       2.5
 PEL             412      565             Buy     3,191    3,693        4,297         16.1    28.4     30.8         32.7     18.6    13.2        9.9      9.4       3.1
 MPL             156      174             Acc.    1,308    1,701        2,120         27.3     5.8      7.7          9.8     29.8    13.8      10.5       8.2       3.1
 L&T            1,809         -     Neutral      37,035   44,047       55,519         22.4    47.5     55.1         68.9     20.4    29.8      25.7      20.5       2.7

 Source: Company, Angel Research


Exhibit 11: Recommendation Summary - SOTP break up
  Company                         Core Const.             Real Estate            Road BOT              Invst. In Subsidiaries               Others              Total
                                   Rs       % to TP       Rs       % to TP       Rs      % to TP              Rs           % to TP      Rs        % to TP          Rs
  CCCL                            89             100       0                0     0             0             0                 0       0                0         89
  Gammon India                121                 54       0                0     0             0             0                 0     104               46       225
  HCC                             26              41      29            46        8           13              0                 0       0                0         63
  IRB Infra                   113                 41       3                1   154           56              5                 2       0                0       275
  IVRCL                       162                 75       0                0     0             0         54                   25       0                0       216
  JP Assoc.                       65              38      41            23        0             0             0                 0      68               39       174
  Punj Lloyd                  156                100       0                0     0             0             0                 0       0                0       156
  NCC                         141                 70      19                9   19            10              0                 0      21               11       201
  Sadbhav                     862                 66       0                0   451           34              0                 0       0                0      1313
  Simplex In.                 570                100       0                0     0             0             0                 0       0                0       570
  Patel Engg                  458                 81      56            10      16              3             0                 0      36                6       565
  Madhucon                        98              56       4                2     0             0         72                   41       0                0       174
  L&T                       1448                  79       0                0     0             0        394                   21       0                0      1842
 Source: Company, Angel Research


August 13, 2010                                                                                                                                                     7
Patel Engineering|1QFY2011 Result Update


                  Profit & Loss Statement (Consolidated)
                  Y/E March (Rs cr)               FY2007 FY2008 FY2009 FY2010 FY2011E FY2012E
                  Net Sales                        1,301   1,853   2,460    3,191   3,693   4,297
                  Other operating income              0       2         -       -       -       -
                  Total operating income           1,301   1,855   2,460    3,191   3,693   4,297
                  % chg                             26.9    42.6    32.6     29.7    15.7    16.3
                  Total Expenditure                1,145   1,557   2,070    2,682   3,097   3,618
                  Net Raw Materials                 289     455     427      398     790     900
                  Other Mfg costs                   808     935    1,471    2,011   2,124   2,510
                  Personnel                          44     112     128      136     175     200
                  Other                               4      55       44     138       8       8
                  EBITDA                            157     299     390      509     596     679
                  % chg                             25.4    90.8    30.5     30.5    17.2    13.8
                  (% of Net Sales)                  12.0    16.1    15.8     15.9    16.1    15.8
                  Depreciation& Amortisation         35      63     120      109     125     138
                  EBIT                              122     236     270      400     471     541
                  % chg                             30.3    94.0    14.5     47.9    17.8    14.8
                  (% of Net Sales)                   9.4    12.7    11.0     12.5    12.8    12.6
                  Interest & other Charges           10      61     137      192     225     275
                  Other Income(incl Ass/JV pft)      16      41       62      98      99     100
                  (% of PBT)                        12.4    18.9    31.9     32.0    28.7    27.3
                  Recurring PBT                     128     216     196      305     344     366
                  % chg                             58.4    69.1    (9.5)    55.8    12.8     6.2
                  Extraordinary Expense/(Inc.)       (0)       -    (41)        -       -       -
                  PBT (reported)                    128     216     237      305     344     366
                  Tax                                14      23       44      93     114     121
                  (% of PBT)                        11.3    10.7    18.4     30.5    33.0    33.0
                  PAT (reported)                    114     193     193      212     231     245
                  Less: Minority interest (MI)       2.7    10.9    12.9     13.9    15.4    16.4
                  Prior period items                   -       -        -       -       -       -
                  PAT after MI (reported)           111     182     181      198     215     228
                  ADJ. PAT                          112     151     139      198     215     228
                  % chg                             52.6    35.4    (8.1)    42.4     8.5     6.2
                  (% of Net Sales)                   8.6     8.2     5.7      6.2     5.8     5.3
                  Basic EPS (Rs) (Reported)         18.6    30.5    30.2     30.2    30.8    32.7
                  Fully Diluted EPS (Rs)            16.0    21.7    19.9     28.4    30.8    32.7
                  % chg                             52.6    35.4    (8.1)    42.4     8.5     6.2


August 13, 2010                                                                                8
Patel Engineering|1QFY2011 Result Update


                  Balance Sheet (Consolidated)
                  Y/E March (Rs cr)           FY2007 FY2008 FY2009 FY2010 FY2011E FY2012E
                  SOURCES OF FUNDS
                  Equity Share Capital           6.0       6.0     6.0     7.0     7.0     7.0
                  Preference Capital               -         -       -       -       -       -
                  Reserves& Surplus             701        840   1,011   1,356   1,542   1,751
                  Shareholders Funds            707        846   1,017   1,363   1,549   1,758
                  Minority Interest               7         41      22     62       62      62
                  Total Loans                   491      1,194   1,747   2,138   2,476   3,156
                  Deferred Tax Liability         12         15      15     11       11      11
                  Total Liabilities            1,218     2,096   2,800   3,574   4,098   4,987
                  APPLICATION OF FUNDS
                  Gross Block                   357        615    804     861      961   1,086
                  Less: Acc. Depreciation       114        180    303     306      431     569
                  Net Block                     242        435    500     555      530     517
                  Capital Work-in-Progress       11        235      70    204      254     304
                  Investments                   171         36      50     70      481     997
                  Current Assets               1,150     2,045   2,865   3,758   4,044   4,616
                  Inventories                   446        824   1,110   1,803   1,893   2,177
                  Sundry Debtors                303        462    583     696      765     880
                  Cash                          105        288    295     232      256     203
                  Loans & Advances              296        471    878    1,026   1,129   1,355
                  Other                            -         -       -       -       -       -
                  Current liabilities           360        658    692    1,020   1,217   1,454
                  Net Current Assets            790      1,387   2,174   2,738   2,827   3,162
                  Mis. Exp. not written off       3          2       6      7        7       7
                  Total Assets                 1,218     2,096   2,800   3,574   4,098   4,987


August 13, 2010                                                                              9
Patel Engineering|1QFY2011 Result Update


                  Cash Flow Statement (Consolidated)
                  Y/E March (Rs cr)                  FY2007 FY2008 FY2009 FY2010E FY2011E FY2012E
                  Profit before tax (excluding MI)    131.6    185.5    237.0     291.1     328.6     349.1
                  Depreciation                         34.9     62.7    119.6     109.0     125.4     137.9
                  Change in Working Capital           302.0    396.0    662.6     626.9      65.0     388.1
                  Less: Other income                   15.9     40.8     62.5      97.6      98.6      99.7
                  Direct taxes paid                    29.7     45.2     76.0     108.4     113.5     120.6
                  Cash Flow from Operations          (181.1) (233.8) (444.5)     (432.8)    176.8    (121.5)
                  (Inc.)/ Dec. in Fixed Assets        (78.8) (482.3)    (15.1)   (295.0)   (150.0)   (175.0)
                  (Inc.)/ Dec. in Investments           6.6     (1.8)   (51.0)     21.0    (411.4)   (516.1)
                  Other income                         15.9     40.8     62.5      97.6      98.6      99.7
                  Cash Flow from Investing            (56.3) (443.3)     (3.6)   (176.4)   (462.8)   (591.4)
                  Issue of Equity                     425.0         -        -    344.3          -         -
                  Inc./(Dec.) in loans                 29.2    703.0    535.7     391.2     338.3     679.6
                  Dividend Paid (Incl. Tax)             9.2      8.1      5.9      22.8      17.8      19.6
                  Others                             (147.0)   165.0    (75.0)   (165.8)    (10.9)         -
                  Cash Flow from Financing            298.0    860.0    454.7     546.9     309.7     660.1
                  Inc./(Dec.) in Cash                  60.7    182.9      6.7     (62.3)     23.7     (52.8)
                  Opening Cash balances                44.5    105.1    288.1     294.8     232.5     256.2
                  Closing Cash balances               105.1    288.1    294.8     232.5     256.2     203.3


August 13, 2010                                                                                       10
Patel Engineering|1QFY2011 Result Update


                  Key Ratios
                  Y/E March                 FY2007   FY2008 FY2009 FY2010E FY2011E FY2012E
                  Valuation Ratio (x)
                  P/E (on FDEPS)              25.7     19.0    20.7    14.5    13.4     12.6
                  P/CEPS                      19.6     13.4    11.1     9.4     8.5      7.9
                  P/BV                         4.1      3.4     2.8     2.1     1.9      1.6
                  Dividend yield (%)           0.3      0.4     0.4     0.5     0.5      0.6
                  EV/Sales                     2.5      2.0     1.8     1.5     1.4      1.4
                  EV/EBITDA                   20.9     12.7    11.1     9.4     8.6      8.6
                  EV / Total Assets            2.7      1.8     1.5     1.3     1.2      1.2
                  Order Book to Sales          3.9      3.1     2.9     3.1     3.2      3.4
                  Per Share Data (Rs)
                  EPS (Basic)                 18.6     30.5    30.2    30.2    30.8     32.7
                  EPS (fully diluted)         16.0     21.7    19.9    28.4    30.8     32.7
                  Cash EPS                    21.0     30.6    37.0    44.0    48.7     52.4
                  DPS                          1.3      1.5     1.7     2.0     2.2      2.4
                  Book Value                 101.3    121.1   145.6   195.0   221.7   251.6
                  Dupont Analysis
                  EBIT margin                  9.4     12.7    11.0    12.5    12.8     12.6
                  Tax retention ratio          0.9      0.9     0.8     0.7     0.7      0.7
                  Asset turnover (x)           1.2      1.3     1.1     1.1     1.0      1.0
                  ROIC (Post-tax)              9.7     14.4    10.2     9.5     8.8      8.4
                  Cost of Debt (Post Tax)      1.7      6.4     7.6     6.9     6.5      6.5
                  Leverage (x)                 0.5      0.8     1.3     1.4     1.4      1.6
                  Operating ROE               14.0     21.1    13.5    13.2    12.0     11.3
                  Returns (%)
                  ROACE (Pre-tax)             10.0     14.2    11.0    12.5    12.3     11.9
                  Angel ROIC (Pre-tax)        10.9     16.2    12.5    13.7    13.1     12.5
                  ROAE                        15.8     19.5    14.9    16.7    14.8     13.8
                  Turnover ratios (x)
                  Asset Turnover (Gross
                  Block)                       3.6      3.8     3.5     3.8     4.1      4.2
                  Inventory / Sales
                  (days)                      125      125     144     167      183     173
                  Receivables (days)           85       75      77      73       72      70
                  Payables (days)              90      100      99      95      106     109
                  WC cycle (ex-cash)
                  (days)                     192.3    175.5   220.9   250.8   250.8   234.9
                  Solvency ratios (x)
                  Net debt to equity           0.5      1.1     1.4     1.4     1.4      1.7
                  Net debt to EBITDA           2.5      3.0     3.7     3.7     3.7      4.4
                  Interest Coverage
                  (EBIT/Interest)             12.6      3.9     2.0     2.1     2.1      2.0


August 13, 2010                                                                           11
Patel Engineering|1QFY2011 Result Update


  Research Team Tel: 022 - 4040 3800                E-mail: research@angeltrade.com                   Website: www.angeltrade.com

  DISCLAIMER
  This document is solely for the personal information of the recipient, and must not be singularly used as the basis of any investment
  decision. Nothing in this document should be construed as investment or financial advice. Each recipient of this document should make
  such investigations as they deem necessary to arrive at an independent evaluation of an investment in the securities of the companies
  referred to in this document (including the merits and risks involved), and should consult their own advisors to determine the merits and
  risks of such an investment.

  Angel Broking Limited, its affiliates, directors, its proprietary trading and investment businesses may, from time to time, make
  investment decisions that are inconsistent with or contradictory to the recommendations expressed herein. The views contained in this
  document are those of the analyst, and the company may or may not subscribe to all the views expressed within.

  Reports based on technical and derivative analysis center on studying charts of a stock's price movement, outstanding positions and
  trading volume, as opposed to focusing on a company's fundamentals and, as such, may not match with a report on a company's
  fundamentals.

  The information in this document has been printed on the basis of publicly available information, internal data and other reliable
  sources believed to be true, but we do not represent that it is accurate or complete and it should not be relied on as such, as this
  document is for general guidance only. Angel Broking Limited or any of its affiliates/ group companies shall not be in any way
  responsible for any loss or damage that may arise to any person from any inadvertent error in the information contained in this report.
  Angel Broking Limited has not independently verified all the information contained within this document. Accordingly, we cannot testify,
  nor make any representation or warranty, express or implied, to the accuracy, contents or data contained within this document. While
  Angel Broking Limited endeavours to update on a reasonable basis the information discussed in this material, there may be regulatory,
  compliance, or other reasons that prevent us from doing so.
  This document is being supplied to you solely for your information, and its contents, information or data may not be reproduced,
  redistributed or passed on, directly or indirectly.

  Angel Broking Limited and its affiliates may seek to provide or have engaged in providing corporate finance, investment banking or
  other advisory services in a merger or specific transaction to the companies referred to in this report, as on the date of this report or in
  the past.

  Neither Angel Broking Limited, nor its directors, employees or affiliates shall be liable for any loss or damage that may arise from or in
  connection with the use of this information.

  Note: Please refer to the important `Stock Holding Disclosure' report on the Angel website (Research Section). Also, please
  refer to the latest update on respective stocks for the disclosure status in respect of those stocks. Angel Broking Limited and
  its affiliates may have investment positions in the stocks recommended in this report.


 Disclosure of Interest Statement                                              Patel Engg.
 1. Analyst ownership of the stock                                                  No
 2. Angel and its Group companies ownership of the stock                            No
 3. Angel and its Group companies' Directors ownership of the stock                 No
 4. Broking relationship with company covered                                       No

 Note: We have not considered any Exposure below Rs 1 lakh for Angel, its Group companies and Directors.


 Ratings (Returns):              Buy (> 15%)                      Accumulate (5% to 15%)                 Neutral (-5 to 5%)
                                 Reduce (-5% to 15%)              Sell (< -15%)


August 13, 2010                                                                                                                           12

More Related Content

What's hot (19)

Infotech ru2 qfy2011-141010
Infotech  ru2 qfy2011-141010Infotech  ru2 qfy2011-141010
Infotech ru2 qfy2011-141010
 
Electrosteel castings
Electrosteel castingsElectrosteel castings
Electrosteel castings
 
Mcnally Bharat
Mcnally BharatMcnally Bharat
Mcnally Bharat
 
Exide Industries
Exide IndustriesExide Industries
Exide Industries
 
Ashoke Leyland
Ashoke LeylandAshoke Leyland
Ashoke Leyland
 
IRB
IRBIRB
IRB
 
BHEL -Result Update
BHEL -Result UpdateBHEL -Result Update
BHEL -Result Update
 
SAIL
SAILSAIL
SAIL
 
MPL
MPLMPL
MPL
 
GDL
GDLGDL
GDL
 
Deccan Chronicle
Deccan Chronicle Deccan Chronicle
Deccan Chronicle
 
MPL Result Update 4qfy2010-030510-final
MPL Result Update 4qfy2010-030510-finalMPL Result Update 4qfy2010-030510-final
MPL Result Update 4qfy2010-030510-final
 
Indoco Remedies
Indoco RemediesIndoco Remedies
Indoco Remedies
 
Essel Propack
Essel PropackEssel Propack
Essel Propack
 
Exide
Exide Exide
Exide
 
Shiv Vani Oil
Shiv Vani Oil Shiv Vani Oil
Shiv Vani Oil
 
Greenply
Greenply Greenply
Greenply
 
Alembic
Alembic Alembic
Alembic
 
Cccl ru4 qfy2010-100510
Cccl  ru4 qfy2010-100510Cccl  ru4 qfy2010-100510
Cccl ru4 qfy2010-100510
 

Viewers also liked

Derivatives Report - July 14,2010
Derivatives Report - July 14,2010Derivatives Report - July 14,2010
Derivatives Report - July 14,2010Angel Broking
 
Market outlook 01 11 10
Market outlook 01 11 10Market outlook 01 11 10
Market outlook 01 11 10Angel Broking
 
Derivatives Report -August 10,2010
Derivatives Report -August 10,2010Derivatives Report -August 10,2010
Derivatives Report -August 10,2010Angel Broking
 
Sesa goa ru4 qfy2010-200410
Sesa goa ru4 qfy2010-200410Sesa goa ru4 qfy2010-200410
Sesa goa ru4 qfy2010-200410Angel Broking
 
HUL ru4 qfy2010-250510
HUL ru4 qfy2010-250510HUL ru4 qfy2010-250510
HUL ru4 qfy2010-250510Angel Broking
 
Power Sector Update - 15 Apr 2010
Power Sector Update - 15 Apr 2010Power Sector Update - 15 Apr 2010
Power Sector Update - 15 Apr 2010Angel Broking
 
Technical report - July 27, 2010
Technical report - July 27, 2010Technical report - July 27, 2010
Technical report - July 27, 2010Angel Broking
 
Market outlook 04 06-10
Market outlook 04 06-10Market outlook 04 06-10
Market outlook 04 06-10Angel Broking
 
Rollover report aug sep 2010
Rollover report aug sep 2010Rollover report aug sep 2010
Rollover report aug sep 2010Angel Broking
 
Market Outlook 25 03 10
Market Outlook 25 03 10Market Outlook 25 03 10
Market Outlook 25 03 10Angel Broking
 
Madras cements ru4 qfy2010-250510
Madras cements ru4 qfy2010-250510Madras cements ru4 qfy2010-250510
Madras cements ru4 qfy2010-250510Angel Broking
 
Derivatives report 27 may-2010
Derivatives report 27 may-2010Derivatives report 27 may-2010
Derivatives report 27 may-2010Angel Broking
 
Gujarat Pipava Port IPO
Gujarat Pipava Port IPOGujarat Pipava Port IPO
Gujarat Pipava Port IPOAngel Broking
 

Viewers also liked (16)

Sarda Energy
Sarda EnergySarda Energy
Sarda Energy
 
Derivatives Report - July 14,2010
Derivatives Report - July 14,2010Derivatives Report - July 14,2010
Derivatives Report - July 14,2010
 
Market outlook 01 11 10
Market outlook 01 11 10Market outlook 01 11 10
Market outlook 01 11 10
 
Weekly Review
Weekly ReviewWeekly Review
Weekly Review
 
Derivatives Report -August 10,2010
Derivatives Report -August 10,2010Derivatives Report -August 10,2010
Derivatives Report -August 10,2010
 
Sesa goa ru4 qfy2010-200410
Sesa goa ru4 qfy2010-200410Sesa goa ru4 qfy2010-200410
Sesa goa ru4 qfy2010-200410
 
HUL ru4 qfy2010-250510
HUL ru4 qfy2010-250510HUL ru4 qfy2010-250510
HUL ru4 qfy2010-250510
 
Power Sector Update - 15 Apr 2010
Power Sector Update - 15 Apr 2010Power Sector Update - 15 Apr 2010
Power Sector Update - 15 Apr 2010
 
Technical report - July 27, 2010
Technical report - July 27, 2010Technical report - July 27, 2010
Technical report - July 27, 2010
 
Cipla
Cipla Cipla
Cipla
 
Market outlook 04 06-10
Market outlook 04 06-10Market outlook 04 06-10
Market outlook 04 06-10
 
Rollover report aug sep 2010
Rollover report aug sep 2010Rollover report aug sep 2010
Rollover report aug sep 2010
 
Market Outlook 25 03 10
Market Outlook 25 03 10Market Outlook 25 03 10
Market Outlook 25 03 10
 
Madras cements ru4 qfy2010-250510
Madras cements ru4 qfy2010-250510Madras cements ru4 qfy2010-250510
Madras cements ru4 qfy2010-250510
 
Derivatives report 27 may-2010
Derivatives report 27 may-2010Derivatives report 27 may-2010
Derivatives report 27 may-2010
 
Gujarat Pipava Port IPO
Gujarat Pipava Port IPOGujarat Pipava Port IPO
Gujarat Pipava Port IPO
 

Similar to Patel Engineering (20)

Ashoke LeyLand
Ashoke LeyLandAshoke LeyLand
Ashoke LeyLand
 
Tata Steel
Tata SteelTata Steel
Tata Steel
 
Elecon
EleconElecon
Elecon
 
RIL - result Update
RIL - result UpdateRIL - result Update
RIL - result Update
 
HCC
HCCHCC
HCC
 
Rallis
RallisRallis
Rallis
 
Hindalco
Hindalco Hindalco
Hindalco
 
Infotech Result Update
Infotech Result UpdateInfotech Result Update
Infotech Result Update
 
Anant raj ru4 qfy2010-280510
Anant raj ru4 qfy2010-280510Anant raj ru4 qfy2010-280510
Anant raj ru4 qfy2010-280510
 
Ceat
Ceat Ceat
Ceat
 
BGR Energy
BGR EnergyBGR Energy
BGR Energy
 
Bharat Forge
Bharat ForgeBharat Forge
Bharat Forge
 
Sadbhav engg ru4 qfy2010-240510
Sadbhav engg ru4 qfy2010-240510Sadbhav engg ru4 qfy2010-240510
Sadbhav engg ru4 qfy2010-240510
 
Sadbhav engg ru4 qfy2010-240510
Sadbhav engg ru4 qfy2010-240510Sadbhav engg ru4 qfy2010-240510
Sadbhav engg ru4 qfy2010-240510
 
ABG Shipyard
ABG Shipyard ABG Shipyard
ABG Shipyard
 
Gipcl
Gipcl Gipcl
Gipcl
 
Bajaj Electricals
Bajaj ElectricalsBajaj Electricals
Bajaj Electricals
 
Blue Star
Blue StarBlue Star
Blue Star
 
Tata Motors
Tata Motors Tata Motors
Tata Motors
 
Subros
Subros Subros
Subros
 

More from Angel Broking

Market outlook 110612
Market outlook 110612Market outlook 110612
Market outlook 110612Angel Broking
 
Axis%20 bank ru1qfy2012-220711
Axis%20 bank ru1qfy2012-220711Axis%20 bank ru1qfy2012-220711
Axis%20 bank ru1qfy2012-220711Angel Broking
 
Derivative report 19th July 2011
Derivative report 19th July 2011Derivative report 19th July 2011
Derivative report 19th July 2011Angel Broking
 
Market outlook 19th July 2011
Market outlook 19th July 2011Market outlook 19th July 2011
Market outlook 19th July 2011Angel Broking
 
Weekly Report 18th July 2011
Weekly Report 18th July 2011Weekly Report 18th July 2011
Weekly Report 18th July 2011Angel Broking
 
Derivative Report 18th July 2011
Derivative Report 18th July 2011Derivative Report 18th July 2011
Derivative Report 18th July 2011Angel Broking
 
Technical Report 18th July 2011
Technical Report 18th July 2011Technical Report 18th July 2011
Technical Report 18th July 2011Angel Broking
 
Market Outlook 18th July 2011
Market Outlook 18th July 2011Market Outlook 18th July 2011
Market Outlook 18th July 2011Angel Broking
 
Bajaj auto Result Updated
Bajaj auto Result UpdatedBajaj auto Result Updated
Bajaj auto Result UpdatedAngel Broking
 
Tata consultancy services
Tata consultancy services Tata consultancy services
Tata consultancy services Angel Broking
 
Derivatives Report 15th July 2011
Derivatives Report 15th July 2011Derivatives Report 15th July 2011
Derivatives Report 15th July 2011Angel Broking
 
Technical Report 15th July 2011
Technical Report 15th July 2011Technical Report 15th July 2011
Technical Report 15th July 2011Angel Broking
 
Infosys Result Updated
Infosys Result UpdatedInfosys Result Updated
Infosys Result UpdatedAngel Broking
 
Derivative Report 13th July 2011
Derivative Report 13th July 2011Derivative Report 13th July 2011
Derivative Report 13th July 2011Angel Broking
 
Technical Report 13th July 2011
Technical Report 13th July 2011Technical Report 13th July 2011
Technical Report 13th July 2011Angel Broking
 

More from Angel Broking (20)

Market outlook 110612
Market outlook 110612Market outlook 110612
Market outlook 110612
 
Axis%20 bank ru1qfy2012-220711
Axis%20 bank ru1qfy2012-220711Axis%20 bank ru1qfy2012-220711
Axis%20 bank ru1qfy2012-220711
 
Persistent systems
Persistent systemsPersistent systems
Persistent systems
 
Ht media
Ht mediaHt media
Ht media
 
Derivative report 19th July 2011
Derivative report 19th July 2011Derivative report 19th July 2011
Derivative report 19th July 2011
 
Market outlook 19th July 2011
Market outlook 19th July 2011Market outlook 19th July 2011
Market outlook 19th July 2011
 
Telecom sector
Telecom sectorTelecom sector
Telecom sector
 
Weekly Report 18th July 2011
Weekly Report 18th July 2011Weekly Report 18th July 2011
Weekly Report 18th July 2011
 
Derivative Report 18th July 2011
Derivative Report 18th July 2011Derivative Report 18th July 2011
Derivative Report 18th July 2011
 
Technical Report 18th July 2011
Technical Report 18th July 2011Technical Report 18th July 2011
Technical Report 18th July 2011
 
Market Outlook 18th July 2011
Market Outlook 18th July 2011Market Outlook 18th July 2011
Market Outlook 18th July 2011
 
South Indian Bank
 South Indian Bank South Indian Bank
South Indian Bank
 
Bajaj auto Result Updated
Bajaj auto Result UpdatedBajaj auto Result Updated
Bajaj auto Result Updated
 
Tata consultancy services
Tata consultancy services Tata consultancy services
Tata consultancy services
 
Fc4 e63c4d01
Fc4 e63c4d01Fc4 e63c4d01
Fc4 e63c4d01
 
Derivatives Report 15th July 2011
Derivatives Report 15th July 2011Derivatives Report 15th July 2011
Derivatives Report 15th July 2011
 
Technical Report 15th July 2011
Technical Report 15th July 2011Technical Report 15th July 2011
Technical Report 15th July 2011
 
Infosys Result Updated
Infosys Result UpdatedInfosys Result Updated
Infosys Result Updated
 
Derivative Report 13th July 2011
Derivative Report 13th July 2011Derivative Report 13th July 2011
Derivative Report 13th July 2011
 
Technical Report 13th July 2011
Technical Report 13th July 2011Technical Report 13th July 2011
Technical Report 13th July 2011
 

Recently uploaded

Instant Issue Debit Cards - School Designs
Instant Issue Debit Cards - School DesignsInstant Issue Debit Cards - School Designs
Instant Issue Debit Cards - School Designsegoetzinger
 
Booking open Available Pune Call Girls Shivane 6297143586 Call Hot Indian Gi...
Booking open Available Pune Call Girls Shivane  6297143586 Call Hot Indian Gi...Booking open Available Pune Call Girls Shivane  6297143586 Call Hot Indian Gi...
Booking open Available Pune Call Girls Shivane 6297143586 Call Hot Indian Gi...Call Girls in Nagpur High Profile
 
The Economic History of the U.S. Lecture 20.pdf
The Economic History of the U.S. Lecture 20.pdfThe Economic History of the U.S. Lecture 20.pdf
The Economic History of the U.S. Lecture 20.pdfGale Pooley
 
The Economic History of the U.S. Lecture 26.pdf
The Economic History of the U.S. Lecture 26.pdfThe Economic History of the U.S. Lecture 26.pdf
The Economic History of the U.S. Lecture 26.pdfGale Pooley
 
Log your LOA pain with Pension Lab's brilliant campaign
Log your LOA pain with Pension Lab's brilliant campaignLog your LOA pain with Pension Lab's brilliant campaign
Log your LOA pain with Pension Lab's brilliant campaignHenry Tapper
 
The Economic History of the U.S. Lecture 22.pdf
The Economic History of the U.S. Lecture 22.pdfThe Economic History of the U.S. Lecture 22.pdf
The Economic History of the U.S. Lecture 22.pdfGale Pooley
 
06_Joeri Van Speybroek_Dell_MeetupDora&Cybersecurity.pdf
06_Joeri Van Speybroek_Dell_MeetupDora&Cybersecurity.pdf06_Joeri Van Speybroek_Dell_MeetupDora&Cybersecurity.pdf
06_Joeri Van Speybroek_Dell_MeetupDora&Cybersecurity.pdfFinTech Belgium
 
Independent Call Girl Number in Kurla Mumbai📲 Pooja Nehwal 9892124323 💞 Full ...
Independent Call Girl Number in Kurla Mumbai📲 Pooja Nehwal 9892124323 💞 Full ...Independent Call Girl Number in Kurla Mumbai📲 Pooja Nehwal 9892124323 💞 Full ...
Independent Call Girl Number in Kurla Mumbai📲 Pooja Nehwal 9892124323 💞 Full ...Pooja Nehwal
 
CALL ON ➥8923113531 🔝Call Girls Gomti Nagar Lucknow best sexual service
CALL ON ➥8923113531 🔝Call Girls Gomti Nagar Lucknow best sexual serviceCALL ON ➥8923113531 🔝Call Girls Gomti Nagar Lucknow best sexual service
CALL ON ➥8923113531 🔝Call Girls Gomti Nagar Lucknow best sexual serviceanilsa9823
 
The Economic History of the U.S. Lecture 25.pdf
The Economic History of the U.S. Lecture 25.pdfThe Economic History of the U.S. Lecture 25.pdf
The Economic History of the U.S. Lecture 25.pdfGale Pooley
 
Booking open Available Pune Call Girls Talegaon Dabhade 6297143586 Call Hot ...
Booking open Available Pune Call Girls Talegaon Dabhade  6297143586 Call Hot ...Booking open Available Pune Call Girls Talegaon Dabhade  6297143586 Call Hot ...
Booking open Available Pune Call Girls Talegaon Dabhade 6297143586 Call Hot ...Call Girls in Nagpur High Profile
 
Call Girls Service Nagpur Maya Call 7001035870 Meet With Nagpur Escorts
Call Girls Service Nagpur Maya Call 7001035870 Meet With Nagpur EscortsCall Girls Service Nagpur Maya Call 7001035870 Meet With Nagpur Escorts
Call Girls Service Nagpur Maya Call 7001035870 Meet With Nagpur Escortsranjana rawat
 
Booking open Available Pune Call Girls Wadgaon Sheri 6297143586 Call Hot Ind...
Booking open Available Pune Call Girls Wadgaon Sheri  6297143586 Call Hot Ind...Booking open Available Pune Call Girls Wadgaon Sheri  6297143586 Call Hot Ind...
Booking open Available Pune Call Girls Wadgaon Sheri 6297143586 Call Hot Ind...Call Girls in Nagpur High Profile
 
The Economic History of the U.S. Lecture 17.pdf
The Economic History of the U.S. Lecture 17.pdfThe Economic History of the U.S. Lecture 17.pdf
The Economic History of the U.S. Lecture 17.pdfGale Pooley
 
Best VIP Call Girls Noida Sector 18 Call Me: 8448380779
Best VIP Call Girls Noida Sector 18 Call Me: 8448380779Best VIP Call Girls Noida Sector 18 Call Me: 8448380779
Best VIP Call Girls Noida Sector 18 Call Me: 8448380779Delhi Call girls
 
Dharavi Russian callg Girls, { 09892124323 } || Call Girl In Mumbai ...
Dharavi Russian callg Girls, { 09892124323 } || Call Girl In Mumbai ...Dharavi Russian callg Girls, { 09892124323 } || Call Girl In Mumbai ...
Dharavi Russian callg Girls, { 09892124323 } || Call Girl In Mumbai ...Pooja Nehwal
 
WhatsApp 📞 Call : 9892124323 ✅Call Girls In Chembur ( Mumbai ) secure service
WhatsApp 📞 Call : 9892124323  ✅Call Girls In Chembur ( Mumbai ) secure serviceWhatsApp 📞 Call : 9892124323  ✅Call Girls In Chembur ( Mumbai ) secure service
WhatsApp 📞 Call : 9892124323 ✅Call Girls In Chembur ( Mumbai ) secure servicePooja Nehwal
 
The Economic History of the U.S. Lecture 30.pdf
The Economic History of the U.S. Lecture 30.pdfThe Economic History of the U.S. Lecture 30.pdf
The Economic History of the U.S. Lecture 30.pdfGale Pooley
 
Solution Manual for Principles of Corporate Finance 14th Edition by Richard B...
Solution Manual for Principles of Corporate Finance 14th Edition by Richard B...Solution Manual for Principles of Corporate Finance 14th Edition by Richard B...
Solution Manual for Principles of Corporate Finance 14th Edition by Richard B...ssifa0344
 
05_Annelore Lenoir_Docbyte_MeetupDora&Cybersecurity.pptx
05_Annelore Lenoir_Docbyte_MeetupDora&Cybersecurity.pptx05_Annelore Lenoir_Docbyte_MeetupDora&Cybersecurity.pptx
05_Annelore Lenoir_Docbyte_MeetupDora&Cybersecurity.pptxFinTech Belgium
 

Recently uploaded (20)

Instant Issue Debit Cards - School Designs
Instant Issue Debit Cards - School DesignsInstant Issue Debit Cards - School Designs
Instant Issue Debit Cards - School Designs
 
Booking open Available Pune Call Girls Shivane 6297143586 Call Hot Indian Gi...
Booking open Available Pune Call Girls Shivane  6297143586 Call Hot Indian Gi...Booking open Available Pune Call Girls Shivane  6297143586 Call Hot Indian Gi...
Booking open Available Pune Call Girls Shivane 6297143586 Call Hot Indian Gi...
 
The Economic History of the U.S. Lecture 20.pdf
The Economic History of the U.S. Lecture 20.pdfThe Economic History of the U.S. Lecture 20.pdf
The Economic History of the U.S. Lecture 20.pdf
 
The Economic History of the U.S. Lecture 26.pdf
The Economic History of the U.S. Lecture 26.pdfThe Economic History of the U.S. Lecture 26.pdf
The Economic History of the U.S. Lecture 26.pdf
 
Log your LOA pain with Pension Lab's brilliant campaign
Log your LOA pain with Pension Lab's brilliant campaignLog your LOA pain with Pension Lab's brilliant campaign
Log your LOA pain with Pension Lab's brilliant campaign
 
The Economic History of the U.S. Lecture 22.pdf
The Economic History of the U.S. Lecture 22.pdfThe Economic History of the U.S. Lecture 22.pdf
The Economic History of the U.S. Lecture 22.pdf
 
06_Joeri Van Speybroek_Dell_MeetupDora&Cybersecurity.pdf
06_Joeri Van Speybroek_Dell_MeetupDora&Cybersecurity.pdf06_Joeri Van Speybroek_Dell_MeetupDora&Cybersecurity.pdf
06_Joeri Van Speybroek_Dell_MeetupDora&Cybersecurity.pdf
 
Independent Call Girl Number in Kurla Mumbai📲 Pooja Nehwal 9892124323 💞 Full ...
Independent Call Girl Number in Kurla Mumbai📲 Pooja Nehwal 9892124323 💞 Full ...Independent Call Girl Number in Kurla Mumbai📲 Pooja Nehwal 9892124323 💞 Full ...
Independent Call Girl Number in Kurla Mumbai📲 Pooja Nehwal 9892124323 💞 Full ...
 
CALL ON ➥8923113531 🔝Call Girls Gomti Nagar Lucknow best sexual service
CALL ON ➥8923113531 🔝Call Girls Gomti Nagar Lucknow best sexual serviceCALL ON ➥8923113531 🔝Call Girls Gomti Nagar Lucknow best sexual service
CALL ON ➥8923113531 🔝Call Girls Gomti Nagar Lucknow best sexual service
 
The Economic History of the U.S. Lecture 25.pdf
The Economic History of the U.S. Lecture 25.pdfThe Economic History of the U.S. Lecture 25.pdf
The Economic History of the U.S. Lecture 25.pdf
 
Booking open Available Pune Call Girls Talegaon Dabhade 6297143586 Call Hot ...
Booking open Available Pune Call Girls Talegaon Dabhade  6297143586 Call Hot ...Booking open Available Pune Call Girls Talegaon Dabhade  6297143586 Call Hot ...
Booking open Available Pune Call Girls Talegaon Dabhade 6297143586 Call Hot ...
 
Call Girls Service Nagpur Maya Call 7001035870 Meet With Nagpur Escorts
Call Girls Service Nagpur Maya Call 7001035870 Meet With Nagpur EscortsCall Girls Service Nagpur Maya Call 7001035870 Meet With Nagpur Escorts
Call Girls Service Nagpur Maya Call 7001035870 Meet With Nagpur Escorts
 
Booking open Available Pune Call Girls Wadgaon Sheri 6297143586 Call Hot Ind...
Booking open Available Pune Call Girls Wadgaon Sheri  6297143586 Call Hot Ind...Booking open Available Pune Call Girls Wadgaon Sheri  6297143586 Call Hot Ind...
Booking open Available Pune Call Girls Wadgaon Sheri 6297143586 Call Hot Ind...
 
The Economic History of the U.S. Lecture 17.pdf
The Economic History of the U.S. Lecture 17.pdfThe Economic History of the U.S. Lecture 17.pdf
The Economic History of the U.S. Lecture 17.pdf
 
Best VIP Call Girls Noida Sector 18 Call Me: 8448380779
Best VIP Call Girls Noida Sector 18 Call Me: 8448380779Best VIP Call Girls Noida Sector 18 Call Me: 8448380779
Best VIP Call Girls Noida Sector 18 Call Me: 8448380779
 
Dharavi Russian callg Girls, { 09892124323 } || Call Girl In Mumbai ...
Dharavi Russian callg Girls, { 09892124323 } || Call Girl In Mumbai ...Dharavi Russian callg Girls, { 09892124323 } || Call Girl In Mumbai ...
Dharavi Russian callg Girls, { 09892124323 } || Call Girl In Mumbai ...
 
WhatsApp 📞 Call : 9892124323 ✅Call Girls In Chembur ( Mumbai ) secure service
WhatsApp 📞 Call : 9892124323  ✅Call Girls In Chembur ( Mumbai ) secure serviceWhatsApp 📞 Call : 9892124323  ✅Call Girls In Chembur ( Mumbai ) secure service
WhatsApp 📞 Call : 9892124323 ✅Call Girls In Chembur ( Mumbai ) secure service
 
The Economic History of the U.S. Lecture 30.pdf
The Economic History of the U.S. Lecture 30.pdfThe Economic History of the U.S. Lecture 30.pdf
The Economic History of the U.S. Lecture 30.pdf
 
Solution Manual for Principles of Corporate Finance 14th Edition by Richard B...
Solution Manual for Principles of Corporate Finance 14th Edition by Richard B...Solution Manual for Principles of Corporate Finance 14th Edition by Richard B...
Solution Manual for Principles of Corporate Finance 14th Edition by Richard B...
 
05_Annelore Lenoir_Docbyte_MeetupDora&Cybersecurity.pptx
05_Annelore Lenoir_Docbyte_MeetupDora&Cybersecurity.pptx05_Annelore Lenoir_Docbyte_MeetupDora&Cybersecurity.pptx
05_Annelore Lenoir_Docbyte_MeetupDora&Cybersecurity.pptx
 

Patel Engineering

  • 1. 1QFY2011 Result Update | Infrastructure August 13, 2010 Patel Engineering BUY Performance Highlights CMP Rs412   Target Price Rs565 Y/E March (Rs cr) 1QFY11 1QFY10 % chg (yoy) 4QFY10 % chg (qoq) Investment Period 12 Months Net Sales 702.3 643.0 9.2 1,197 (41.3) Stock Info Operating Profit 118.5 105.7 12.2 151.0 (21.5) Sector Infrastructure Net Profit 40.1 36.3 10.3 71.9 (44.3) Market Cap (Rs cr) 2,876 Source: Company, Angel Research  Beta 1.06 Patel Engineering (PEL) posted decent numbers on consolidated basis considering 52 Week High / Low 526/340 its high exposure to the politically mired Andhra Pradesh (AP) markets. PEL’s order book position stood at Rs8,000cr in 1QFY2011 (2.5x FY2010 revenues) excluding Avg. Daily Volume 49,983 L1 orders worth Rs3,100cr. Given robust OB and attractive valuations of 9.3x Face Value (Rs) 1 FY2012E earnings (adjusted for investments), we maintain a Buy on the stock. BSE Sensex 18,167 Results in line: PEL posted top-line growth of 9.2% in spite of high exposure to AP. Nifty 5,452 Operating margins came in at 16.9% (16.4%) a tad above our estimates. Interest Reuters Code PENG.BO cost came lower on account of capitalisation. Management has guided 20% growth in top- and bottom-line for FY2011. Bloomberg Code PEC@IN Outlook and Valuation: PEL has exposure to the high-margin hydropower and irrigation segments owing to which it clocks higher margins than its peers. The company has a huge quantum of L1 orders for the next 3-4 quarters, and we Shareholding Pattern (%) believe that post conversion of the same in the OB would be one of the triggers Promoters 45.5 for the stock. PEL has also ventured into the power and real estate businesses, MF / Banks / Indian Fls 12.5 which we believe would be another catalyst for the stock. However, due to the high exposure to AP and relatively subdued order inflow, in recent times the stock FII / NRIs / OCBs 15.5 has underperformed its peers. Nonetheless, we believe that these concerns are Indian Public / Others 26.5 short term in nature and would eventually recede given the company’s technological expertise, strong pipeline of orders and favourable industry dynamics. Hence, we maintain a Buy on the stock, with a SOTP Target Price of Rs565, based on our Target P/E of 14x FY2012E EPS of Rs32.7 and valuing the Abs. (%) 3m 1yr 3yr company’s investments in real estate, power and road at Rs108/share. Sensex 5.2 17.1 21.0 Patel Engg. (4.7) 3.4 (5.3) Key Financials (Consolidated) Y/E March (Rs cr) FY2009 FY2010 FY2011E FY2012E Net Sales (incl op. income) 2,460 3,191 3,693 4,297 % chg 32.6 29.7 15.7 16.3 Adj. Net Profit 139.2 198.2 215.1 228.5 % chg -8.1 42.4 8.5 6.2 FDEPS (Rs) 19.9 28.4 30.8 32.7 EBITDA Margin (%) 15.8 15.9 16.1 15.8 P/E (x) 20.7 14.5 13.4 12.6 Shailesh Kanani RoAE (%) 14.9 16.7 14.8 13.8 022-40403800 Ext: 321 RoACE (%) 11.0 12.5 12.3 11.9 shailesh.kanani@angeltrade.com P/BV (x) 2.8 2.1 1.9 1.6 Aniruddha Mate EV/Sales (x) 1.8 1.5 1.4 1.4 022-40403800 Ext: 335 EV/EBITDA (x) 11.1 9.4 8.6 8.6 aniruddha.mate@angeltrade.com Source: Company, Angel Research Please refer to important disclosures at the end of this report 1
  • 2. Patel Engineering|1QFY2011 Result Update Exhibit 1: 1QFY2011 performance (consolidated) Y/E March (Rs cr) 1QFY11 1QFY10 4QFY10 % chg (yoy) % chg (qoq) FY10 FY09 % chg Net Sales 702.3 643.0 1197.1 9.2 (41.3) 3081.1 2459.8 25.3 Total Expenditure 583.8 537.3 1046.1 8.6 (44.2) 2591.7 2070.2 25.2 Operating Profit 118.5 105.7 151.0 12.2 (21.5) 489.4 389.7 25.6 OPM (%) 16.9 16.4 12.6 - - 15.9 15.8 - Interest 32.5 28.4 46.1 14.3 (29.5) 127.2 47.5 167.7 Depreciation 25.6 31.5 29.6 (18.8) (13.3) 125.1 119.6 4.6 Non Operating Income 2.6 7.8 7.1 - (63.9) 60.2 14.5 316.1 Nonrecurring items 0.0 0.0 30.0 - - 0.0 0.0 - Profit Before tax 63.0 53.5 112.5 17.8 (44.0) 297.3 237.0 25.4 Tax 18.8 15.3 37.4 22.5 (49.8) 91.7 87.8 4.5 Net Profit before MI 44.2 38.1 75.1 15.9 (41.1) 205.6 149.3 37.8 PAT (%) 6.3 5.9 6.3 - - 6.7 6.1 - Minority Interest (MI) 4.2 1.8 3.2 130.6 31.7 12.3 12.9 (4.6) Net Profit after MI 40.1 36.3 71.9 10.3 (44.3) 193.3 136.4 41.8 Adj. PAT (%) 5.7 5.7 6.0 - - 6.3 5.5 - Adj. FDEPS 5.7 5.2 10.3 10.3 (44.3) 27.7 19.5 41.8 Source: Company, Angel Research; Numbers at par: PEL posted top-line growth of 9.2% in spite of high exposure to AP. We believe that the company has fared well compared to its peers. The hydro (54%) and irrigation (22%) segments were the major revenue contributors. Management has guided for 20% revenue growth for FY2011, which we believe is aggressive given high exposure (~30%) of its order book to AP. Hence, we are factoring in CAGR of 16.0% over FY2010-12E lower than management guidance. The real estate business has still not started contributing to top-line. Exhibit 2: Top-line trend 1,400 37.6 40 1,200 32.8 35 30.6 1,000 30 30.4 24.1 28.0 25 800 20 600 15 400 15.2 10 200 9.2 5 0 0 2QFY09 3QFY09 4QFY09 1QFY10 2QFY10 3QFY10 4QFY10 1QFY11 Sales (Rs cr, LHS) Growth (yoy %, RHS) Source: Company, Angel Research August 13, 2010 2
  • 3. Patel Engineering|1QFY2011 Result Update On the operating front, EBITDA margins for the quarter came in at 16.9% (16.4%) a tad above our estimates. The company continues to enjoy high margins given its presence in niche segments and access to superior technology. Interest cost came lower on account of capitalisation of interest for the power projects. Going ahead as well, we believe that the company would be able maintain its operating margins and are penciling in similar margins for FY2011E and FY2012E. On the bottom-line front, we believe that the CAGR would me much lower given higher tax outflow and interest cost on account of investments in subsidiaries. Exhibit 3: EBITDA trend Exhibit 4: Bottom-line trend 200 18.1 18.7 18.8 20 80 9 16.9 70 8 150 16.4 15 60 7.6 7 16.6 15.4 7.6 7.2 7.3 6 50 100 12.6 10 40 5.7 6.0 5 5.0 5.7 4 50 5 30 3 20 2 0 0 10 1 0 0 2QFY09 3QFY09 4QFY09 1QFY10 2QFY10 3QFY10 4QFY10 1QFY11 2QFY09 3QFY09 4QFY09 1QFY10 2QFY10 3QFY10 4QFY10 1QFY11 EBITDA (Rs cr, LHS) EBITDAM (%, RHS) PAT (Rs cr, LHS) PATM (%, RHS) Source: Company, Angel Research Source: Company, Angel Research Order Book Analysis PEL’s order book as on 1QFY2011 stood at Rs8,000cr (2.5x FY2010 revenues) lower than FY2010 pending confirmation of orders worth Rs3,000cr, which are spread across the hydro (49%), irrigation (46%) and balance transportation segments. The company has maintained its guidance of achieving order book of Rs14,000cr (excluding the captive orders) for the fiscal. Exhibit 5: 1QFY2011 order backlog – Sector-wise (Rs cr) 400  3,920  3,680  Power Irrigation & water Transport & Urban Infra Source: Company, Angel Research August 13, 2010 3
  • 4. Patel Engineering|1QFY2011 Result Update Project Updates PEL has invested equity to the tune of Rs250cr in its power ventures, which we have valued at 1x. The land for the first phase (1,050MW plant in Nagapatnam district, Tamil Nadu) has been acquired and coal linkages are also in place from the Mahanadi coal fields. Management expects financial closure by December 2010 and construction work is likely to start in 2QFY2012. Further, regarding bringing in a strategic partner, management clarified that it would happen only in FY2012 when the construction work starts gaining visibility and venture attracts right valuation. In real estate, the company has mentioned that the progress is satisfactory with bookings of nearly 1,000 apartments for Smondoville-1 out of the total 1,100 apartments, which also implies that the project does not require cash and would be self funded. Over the next couple of years, this project is expected to generate revenues to the tune of Rs240cr. Outlook and Valuation Hydropower is one of the lowest cost modes of power generation and India's hydro power potential is estimated at 148,701MW, which is primarily concentrated in the north and north-eastern regions due to the availability of ample hydel resources. Moreover, the Twelfth Five-Year Plan ((2012-17) provides significant opportunity for the construction companies (read PEL) in the hydropower segment. Around 30,000MW hydropower capacity is expected to come up in the Twelfth Plan compared to the existing 36,917MW capacity. Against this backdrop, we believe that PEL will be able to maintain its 22% share going ahead and garner orders of ~Rs15,250cr over the next few years. Exhibit 6: PEL to gain from growing market size Potential in Hydro Power segment Rs cr XII FYP target (MW) 30,000 Actual Implementation (60%) (MW) 18,000 Total Industry potential @5.5cr/MW 99,000 EPC potential at 70% 69,300 PEL's share (22%) 15,246 Source: Company, Angel Research PEL has exposure to the high-margin hydropower and irrigation segments owing to which it clocks higher margins than its peers. The company has a huge quantum of L1 orders for the next 3-4 quarters, and we believe that post conversion and reflection of the same in the order book would be one of the key triggers for the stock. PEL has also ventured into the power (leveraging on its construction abilities and favourable industry dynamics) and real estate businesses (cashing on its historical land bank), which we believe would be another catalyst for the stock. However, due to the high exposure to AP and relatively subdued order inflow, in recent times the stock has underperformed its peers. Nonetheless, we believe that these concerns are short term in nature and would eventually recede given the company’s technological expertise, strong pipeline of orders and favourable industry dynamics. Hence, we maintain a Buy on the stock, with a SOTP Target August 13, 2010 4
  • 5. Patel Engineering|1QFY2011 Result Update Price of Rs565, based on our Target P/E of 14x FY2012E EPS of Rs32.7 and valuing the company’s investments in real estate, power and road at Rs108/share. Exhibit 7: SOTP Target Price Business Segment Methodology Remarks Rs cr Rs/share % to TP Core Construction P/E 14x FY2012E Earnings 3,199 457.9 81.0 Real Estate NAV 30% Discount 392 56.1 9.9 BOT Assets BV 1.0x P/BV 109 15.7 2.8 Power Venture BV 1.0x P/BV 250 35.8 6.3 Total 3,950 565.4 100.0 CMP (Rs) 412.0 Upside (%) 37.2 Source: Company, Angel Research Exhibit 8: Key assumptions FY2007 FY2008 FY2009 FY2010 FY2011E FY2012E Order Inflow 2,333 2,536 3,976 5,881 5,500 7,000 Revenues 1,301 1,855 2,460 3,191 3,693 4,297 Order Backlog (Y/E) 5,008 5,684 7,200 10,000 11,807 14,510 OB/Sales (x) 3.8 3.1 2.9 3.1 3.2 3.4 Source: Company, Angel Research Exhibit 9: Angel EPS forecast v/s consensus Angel Forecast Bloomberg Consensus Variation (%) FY2011E 30.8 31.5 2.2 FY2012E 32.7 37.9 15.8 Source: Company, Angel Research August 13, 2010 5
  • 6. Patel Engineering|1QFY2011 Result Update Investment Arguments Present in niche high-margin segments Traditionally, PEL has been concentrating on niche segments to maintain its margins and effectively use its resources. Its core competence lies in the construction of hydro power plants and upstream irrigation projects. It has been involved in ~22% of the total hydro power plants in India. Hydro power projects are complex, require high level of technological expertise and fetch significantly high margins. Also, past experience and technical competence is critical in winning contracts for hydro power and upstream irrigation projects. Therefore, it effectively serves as an entry barrier restricting the number of bids to 4-5 in hydro power and 7-8 bidders in upstream irrigation segment. Further, the benefits of hydro projects and upstream irrigation projects are that the pass on of incremental costs is high compared to the other segments. In perspective, the pass on of incremental costs in hydro projects is as high as 90% and in irrigation projects it is in the range of 70- 80%. Overall, this aids the company to maintain its margins especially in the current rising commodity prices and interest rate regime. It also explains the high margins enjoyed by PEL over the years. Real estate and power venture the potential value creators in long run PEL has rationalised its expansion plans in the real estate projects and adopted a more cautious approach. Its Jogeshwari corporate park is already operational and other launches (Bangalore and Noida) are seeing good response making it self-funded. We see significant value locked in its land bank of 1,127 acres, acquired at a cost of Rs250cr. The company has already monetised part of it in Mumbai, Bangalore and Noida (not part of the above-mentioned land bank). However, we have currently valued these real estate projects conservatively, leaving a significant chunk that can be potentially value accretive. Further, PEL is developing two power projects, one thermal in Tamil Nadu and another hydro in Arunachal Pradesh. It has secured approvals to develop a 1,050MW thermal power project in Nagapatnam district, Tamil Nadu, for which land has been acquired and partial environment clearance have been obtained. Financial closure for the project is likely by December 2010. PEL will likely offer 49% stake in the project to a strategic investor, which we believe would set a benchmark for valuing these projects and create value. Compelling valuations Over FY2007-10, although the company registered a healthy execution rate at ~34%, the pace of order book was slack at a mere 20% and its order book exposure to AP. We believe that these are the major reasons for the stock’s underperformance on the bourses. However, we believe that with a better liquidity position post the fund infusion (raised Rs340cr via QIP), strong bidding pipeline (L1 for orders worth Rs3,000cr), signs of improvement in AP (receivables are down from Rs200cr to Rs60cr) and robust outlook for the sector, its only a matter of time before the stock garners investor fancy and would generate the outperformance. Moreover, PEL is one of the cheapest stocks in our coverage universe trading at single-digit P/E multiple - adjusted for its subsidiary valuations with strong execution capabilities in the EPC space. We believe that current valuations are August 13, 2010 6
  • 7. Patel Engineering|1QFY2011 Result Update attractive and do not factor in PEL’s premium position in high margin businesses, strong growth prospects and value unlocking potential. Exhibit 10: Recommendation Summary Company CMP TP Rating Top-line EPS Adj. P/E OB/ (Rs) (Rs) FY10 FY11E FY12E CAGR (%) FY10 FY11E FY12E CAGR (%) FY10 FY11E FY12E Sale CCCL 85 89 Acc. 1,976 2,461 2,891 21.0 5.0 5.9 7.5 22.5 17.0 14.4 11.3 2.3 Gammon 208 - Neutral 4,489 5,575 6,607 21.3 8.4 10.0 12.1 20.0 12.3 10.4 8.6 - HCC 72 - Neutral 3,629 4,146 4,900 16.2 1.3 1.6 1.8 16.8 25.8 22.0 18.9 4.7 IRB Infra 291 - Neutral 1,705 2,778 3,580 44.9 11.6 12.3 14.5 11.8 25.1 23.6 20.1 - IVRCL 162 216 Buy 5,492 6,493 8,071 21.2 7.8 9.2 11.6 21.6 13.7 11.7 9.3 4.3 JP Assoc. 121 174 Buy 10,316 13,281 17,843 31.5 4.7 5.2 7.7 28.5 25.9 23.2 15.7 - Punj 117 156 Buy 10,448 9,756 12,402 9.0 (11.1) 5.6 11.2 - - 20.8 10.4 2.8 NCC 161 201 Buy 4,778 5,913 6,758 18.9 7.8 8.9 10.1 13.7 13.0 11.3 10.0 3.6 Sadbhav 1,477 1,313 Reduce 1,257 1,621 1,986 25.7 43.0 77.4 89.8 44.4 24.6 13.7 11.4 5.4 SI. 470 570 Buy 4,555 5,535 6,428 18.8 25.7 31.9 40.7 25.9 18.3 14.7 11.5 2.5 PEL 412 565 Buy 3,191 3,693 4,297 16.1 28.4 30.8 32.7 18.6 13.2 9.9 9.4 3.1 MPL 156 174 Acc. 1,308 1,701 2,120 27.3 5.8 7.7 9.8 29.8 13.8 10.5 8.2 3.1 L&T 1,809 - Neutral 37,035 44,047 55,519 22.4 47.5 55.1 68.9 20.4 29.8 25.7 20.5 2.7 Source: Company, Angel Research Exhibit 11: Recommendation Summary - SOTP break up Company Core Const. Real Estate Road BOT Invst. In Subsidiaries Others Total Rs % to TP Rs % to TP Rs % to TP Rs % to TP Rs % to TP Rs CCCL 89 100 0 0 0 0 0 0 0 0 89 Gammon India 121 54 0 0 0 0 0 0 104 46 225 HCC 26 41 29 46 8 13 0 0 0 0 63 IRB Infra 113 41 3 1 154 56 5 2 0 0 275 IVRCL 162 75 0 0 0 0 54 25 0 0 216 JP Assoc. 65 38 41 23 0 0 0 0 68 39 174 Punj Lloyd 156 100 0 0 0 0 0 0 0 0 156 NCC 141 70 19 9 19 10 0 0 21 11 201 Sadbhav 862 66 0 0 451 34 0 0 0 0 1313 Simplex In. 570 100 0 0 0 0 0 0 0 0 570 Patel Engg 458 81 56 10 16 3 0 0 36 6 565 Madhucon 98 56 4 2 0 0 72 41 0 0 174 L&T 1448 79 0 0 0 0 394 21 0 0 1842 Source: Company, Angel Research August 13, 2010 7
  • 8. Patel Engineering|1QFY2011 Result Update Profit & Loss Statement (Consolidated) Y/E March (Rs cr) FY2007 FY2008 FY2009 FY2010 FY2011E FY2012E Net Sales 1,301 1,853 2,460 3,191 3,693 4,297 Other operating income 0 2 - - - - Total operating income 1,301 1,855 2,460 3,191 3,693 4,297 % chg 26.9 42.6 32.6 29.7 15.7 16.3 Total Expenditure 1,145 1,557 2,070 2,682 3,097 3,618 Net Raw Materials 289 455 427 398 790 900 Other Mfg costs 808 935 1,471 2,011 2,124 2,510 Personnel 44 112 128 136 175 200 Other 4 55 44 138 8 8 EBITDA 157 299 390 509 596 679 % chg 25.4 90.8 30.5 30.5 17.2 13.8 (% of Net Sales) 12.0 16.1 15.8 15.9 16.1 15.8 Depreciation& Amortisation 35 63 120 109 125 138 EBIT 122 236 270 400 471 541 % chg 30.3 94.0 14.5 47.9 17.8 14.8 (% of Net Sales) 9.4 12.7 11.0 12.5 12.8 12.6 Interest & other Charges 10 61 137 192 225 275 Other Income(incl Ass/JV pft) 16 41 62 98 99 100 (% of PBT) 12.4 18.9 31.9 32.0 28.7 27.3 Recurring PBT 128 216 196 305 344 366 % chg 58.4 69.1 (9.5) 55.8 12.8 6.2 Extraordinary Expense/(Inc.) (0) - (41) - - - PBT (reported) 128 216 237 305 344 366 Tax 14 23 44 93 114 121 (% of PBT) 11.3 10.7 18.4 30.5 33.0 33.0 PAT (reported) 114 193 193 212 231 245 Less: Minority interest (MI) 2.7 10.9 12.9 13.9 15.4 16.4 Prior period items - - - - - - PAT after MI (reported) 111 182 181 198 215 228 ADJ. PAT 112 151 139 198 215 228 % chg 52.6 35.4 (8.1) 42.4 8.5 6.2 (% of Net Sales) 8.6 8.2 5.7 6.2 5.8 5.3 Basic EPS (Rs) (Reported) 18.6 30.5 30.2 30.2 30.8 32.7 Fully Diluted EPS (Rs) 16.0 21.7 19.9 28.4 30.8 32.7 % chg 52.6 35.4 (8.1) 42.4 8.5 6.2 August 13, 2010 8
  • 9. Patel Engineering|1QFY2011 Result Update Balance Sheet (Consolidated) Y/E March (Rs cr) FY2007 FY2008 FY2009 FY2010 FY2011E FY2012E SOURCES OF FUNDS Equity Share Capital 6.0 6.0 6.0 7.0 7.0 7.0 Preference Capital - - - - - - Reserves& Surplus 701 840 1,011 1,356 1,542 1,751 Shareholders Funds 707 846 1,017 1,363 1,549 1,758 Minority Interest 7 41 22 62 62 62 Total Loans 491 1,194 1,747 2,138 2,476 3,156 Deferred Tax Liability 12 15 15 11 11 11 Total Liabilities 1,218 2,096 2,800 3,574 4,098 4,987 APPLICATION OF FUNDS Gross Block 357 615 804 861 961 1,086 Less: Acc. Depreciation 114 180 303 306 431 569 Net Block 242 435 500 555 530 517 Capital Work-in-Progress 11 235 70 204 254 304 Investments 171 36 50 70 481 997 Current Assets 1,150 2,045 2,865 3,758 4,044 4,616 Inventories 446 824 1,110 1,803 1,893 2,177 Sundry Debtors 303 462 583 696 765 880 Cash 105 288 295 232 256 203 Loans & Advances 296 471 878 1,026 1,129 1,355 Other - - - - - - Current liabilities 360 658 692 1,020 1,217 1,454 Net Current Assets 790 1,387 2,174 2,738 2,827 3,162 Mis. Exp. not written off 3 2 6 7 7 7 Total Assets 1,218 2,096 2,800 3,574 4,098 4,987 August 13, 2010 9
  • 10. Patel Engineering|1QFY2011 Result Update Cash Flow Statement (Consolidated) Y/E March (Rs cr) FY2007 FY2008 FY2009 FY2010E FY2011E FY2012E Profit before tax (excluding MI) 131.6 185.5 237.0 291.1 328.6 349.1 Depreciation 34.9 62.7 119.6 109.0 125.4 137.9 Change in Working Capital 302.0 396.0 662.6 626.9 65.0 388.1 Less: Other income 15.9 40.8 62.5 97.6 98.6 99.7 Direct taxes paid 29.7 45.2 76.0 108.4 113.5 120.6 Cash Flow from Operations (181.1) (233.8) (444.5) (432.8) 176.8 (121.5) (Inc.)/ Dec. in Fixed Assets (78.8) (482.3) (15.1) (295.0) (150.0) (175.0) (Inc.)/ Dec. in Investments 6.6 (1.8) (51.0) 21.0 (411.4) (516.1) Other income 15.9 40.8 62.5 97.6 98.6 99.7 Cash Flow from Investing (56.3) (443.3) (3.6) (176.4) (462.8) (591.4) Issue of Equity 425.0 - - 344.3 - - Inc./(Dec.) in loans 29.2 703.0 535.7 391.2 338.3 679.6 Dividend Paid (Incl. Tax) 9.2 8.1 5.9 22.8 17.8 19.6 Others (147.0) 165.0 (75.0) (165.8) (10.9) - Cash Flow from Financing 298.0 860.0 454.7 546.9 309.7 660.1 Inc./(Dec.) in Cash 60.7 182.9 6.7 (62.3) 23.7 (52.8) Opening Cash balances 44.5 105.1 288.1 294.8 232.5 256.2 Closing Cash balances 105.1 288.1 294.8 232.5 256.2 203.3 August 13, 2010 10
  • 11. Patel Engineering|1QFY2011 Result Update Key Ratios Y/E March FY2007 FY2008 FY2009 FY2010E FY2011E FY2012E Valuation Ratio (x) P/E (on FDEPS) 25.7 19.0 20.7 14.5 13.4 12.6 P/CEPS 19.6 13.4 11.1 9.4 8.5 7.9 P/BV 4.1 3.4 2.8 2.1 1.9 1.6 Dividend yield (%) 0.3 0.4 0.4 0.5 0.5 0.6 EV/Sales 2.5 2.0 1.8 1.5 1.4 1.4 EV/EBITDA 20.9 12.7 11.1 9.4 8.6 8.6 EV / Total Assets 2.7 1.8 1.5 1.3 1.2 1.2 Order Book to Sales 3.9 3.1 2.9 3.1 3.2 3.4 Per Share Data (Rs) EPS (Basic) 18.6 30.5 30.2 30.2 30.8 32.7 EPS (fully diluted) 16.0 21.7 19.9 28.4 30.8 32.7 Cash EPS 21.0 30.6 37.0 44.0 48.7 52.4 DPS 1.3 1.5 1.7 2.0 2.2 2.4 Book Value 101.3 121.1 145.6 195.0 221.7 251.6 Dupont Analysis EBIT margin 9.4 12.7 11.0 12.5 12.8 12.6 Tax retention ratio 0.9 0.9 0.8 0.7 0.7 0.7 Asset turnover (x) 1.2 1.3 1.1 1.1 1.0 1.0 ROIC (Post-tax) 9.7 14.4 10.2 9.5 8.8 8.4 Cost of Debt (Post Tax) 1.7 6.4 7.6 6.9 6.5 6.5 Leverage (x) 0.5 0.8 1.3 1.4 1.4 1.6 Operating ROE 14.0 21.1 13.5 13.2 12.0 11.3 Returns (%) ROACE (Pre-tax) 10.0 14.2 11.0 12.5 12.3 11.9 Angel ROIC (Pre-tax) 10.9 16.2 12.5 13.7 13.1 12.5 ROAE 15.8 19.5 14.9 16.7 14.8 13.8 Turnover ratios (x) Asset Turnover (Gross Block) 3.6 3.8 3.5 3.8 4.1 4.2 Inventory / Sales (days) 125 125 144 167 183 173 Receivables (days) 85 75 77 73 72 70 Payables (days) 90 100 99 95 106 109 WC cycle (ex-cash) (days) 192.3 175.5 220.9 250.8 250.8 234.9 Solvency ratios (x) Net debt to equity 0.5 1.1 1.4 1.4 1.4 1.7 Net debt to EBITDA 2.5 3.0 3.7 3.7 3.7 4.4 Interest Coverage (EBIT/Interest) 12.6 3.9 2.0 2.1 2.1 2.0 August 13, 2010 11
  • 12. Patel Engineering|1QFY2011 Result Update Research Team Tel: 022 - 4040 3800 E-mail: research@angeltrade.com Website: www.angeltrade.com DISCLAIMER This document is solely for the personal information of the recipient, and must not be singularly used as the basis of any investment decision. Nothing in this document should be construed as investment or financial advice. Each recipient of this document should make such investigations as they deem necessary to arrive at an independent evaluation of an investment in the securities of the companies referred to in this document (including the merits and risks involved), and should consult their own advisors to determine the merits and risks of such an investment. Angel Broking Limited, its affiliates, directors, its proprietary trading and investment businesses may, from time to time, make investment decisions that are inconsistent with or contradictory to the recommendations expressed herein. The views contained in this document are those of the analyst, and the company may or may not subscribe to all the views expressed within. Reports based on technical and derivative analysis center on studying charts of a stock's price movement, outstanding positions and trading volume, as opposed to focusing on a company's fundamentals and, as such, may not match with a report on a company's fundamentals. The information in this document has been printed on the basis of publicly available information, internal data and other reliable sources believed to be true, but we do not represent that it is accurate or complete and it should not be relied on as such, as this document is for general guidance only. Angel Broking Limited or any of its affiliates/ group companies shall not be in any way responsible for any loss or damage that may arise to any person from any inadvertent error in the information contained in this report. Angel Broking Limited has not independently verified all the information contained within this document. Accordingly, we cannot testify, nor make any representation or warranty, express or implied, to the accuracy, contents or data contained within this document. While Angel Broking Limited endeavours to update on a reasonable basis the information discussed in this material, there may be regulatory, compliance, or other reasons that prevent us from doing so. This document is being supplied to you solely for your information, and its contents, information or data may not be reproduced, redistributed or passed on, directly or indirectly. Angel Broking Limited and its affiliates may seek to provide or have engaged in providing corporate finance, investment banking or other advisory services in a merger or specific transaction to the companies referred to in this report, as on the date of this report or in the past. Neither Angel Broking Limited, nor its directors, employees or affiliates shall be liable for any loss or damage that may arise from or in connection with the use of this information. Note: Please refer to the important `Stock Holding Disclosure' report on the Angel website (Research Section). Also, please refer to the latest update on respective stocks for the disclosure status in respect of those stocks. Angel Broking Limited and its affiliates may have investment positions in the stocks recommended in this report. Disclosure of Interest Statement Patel Engg. 1. Analyst ownership of the stock No 2. Angel and its Group companies ownership of the stock No 3. Angel and its Group companies' Directors ownership of the stock No 4. Broking relationship with company covered No Note: We have not considered any Exposure below Rs 1 lakh for Angel, its Group companies and Directors. Ratings (Returns): Buy (> 15%) Accumulate (5% to 15%) Neutral (-5 to 5%) Reduce (-5% to 15%) Sell (< -15%) August 13, 2010 12