Download to read offline
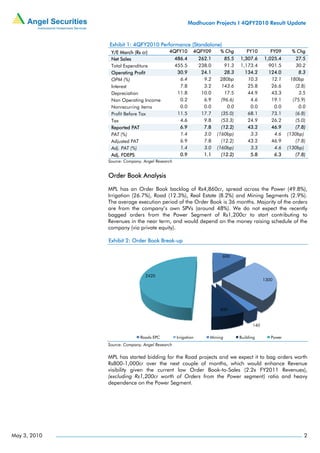
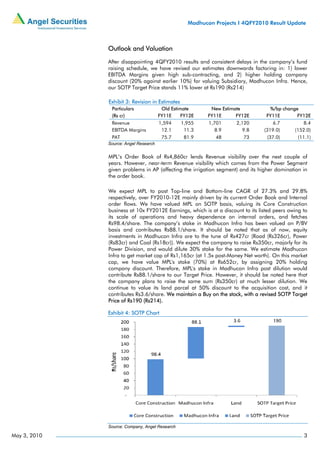
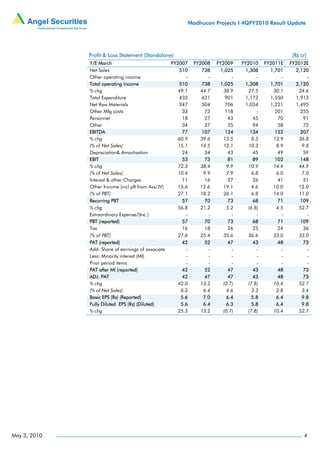
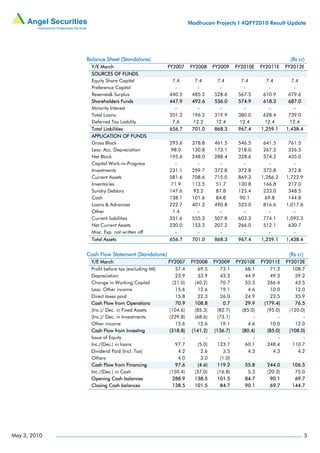
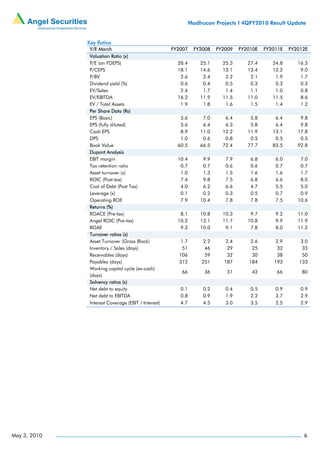
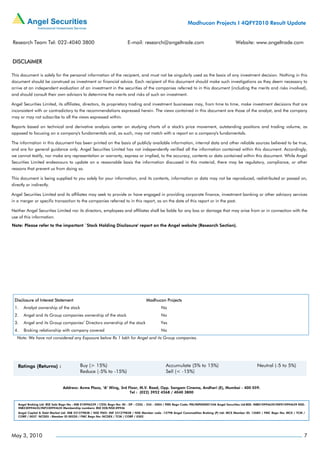

Madhucon Projects reported disappointing results for the fourth quarter of fiscal year 2010 that were below expectations. While revenue grew robustly due to higher subcontracting in the power segment, operating margins hit a historical low of 6.4% due to the heavy subcontracting. The analyst maintains a "Buy" rating but lowers the target price to Rs. 190 per share based on revised estimates factoring in lower margins and a higher holding company discount applied to the valuation of Madhucon Infra subsidiary. Near-term revenue visibility comes from existing power segment orders but margins are expected to remain under pressure from ongoing subcontracting.


