Download to read offline
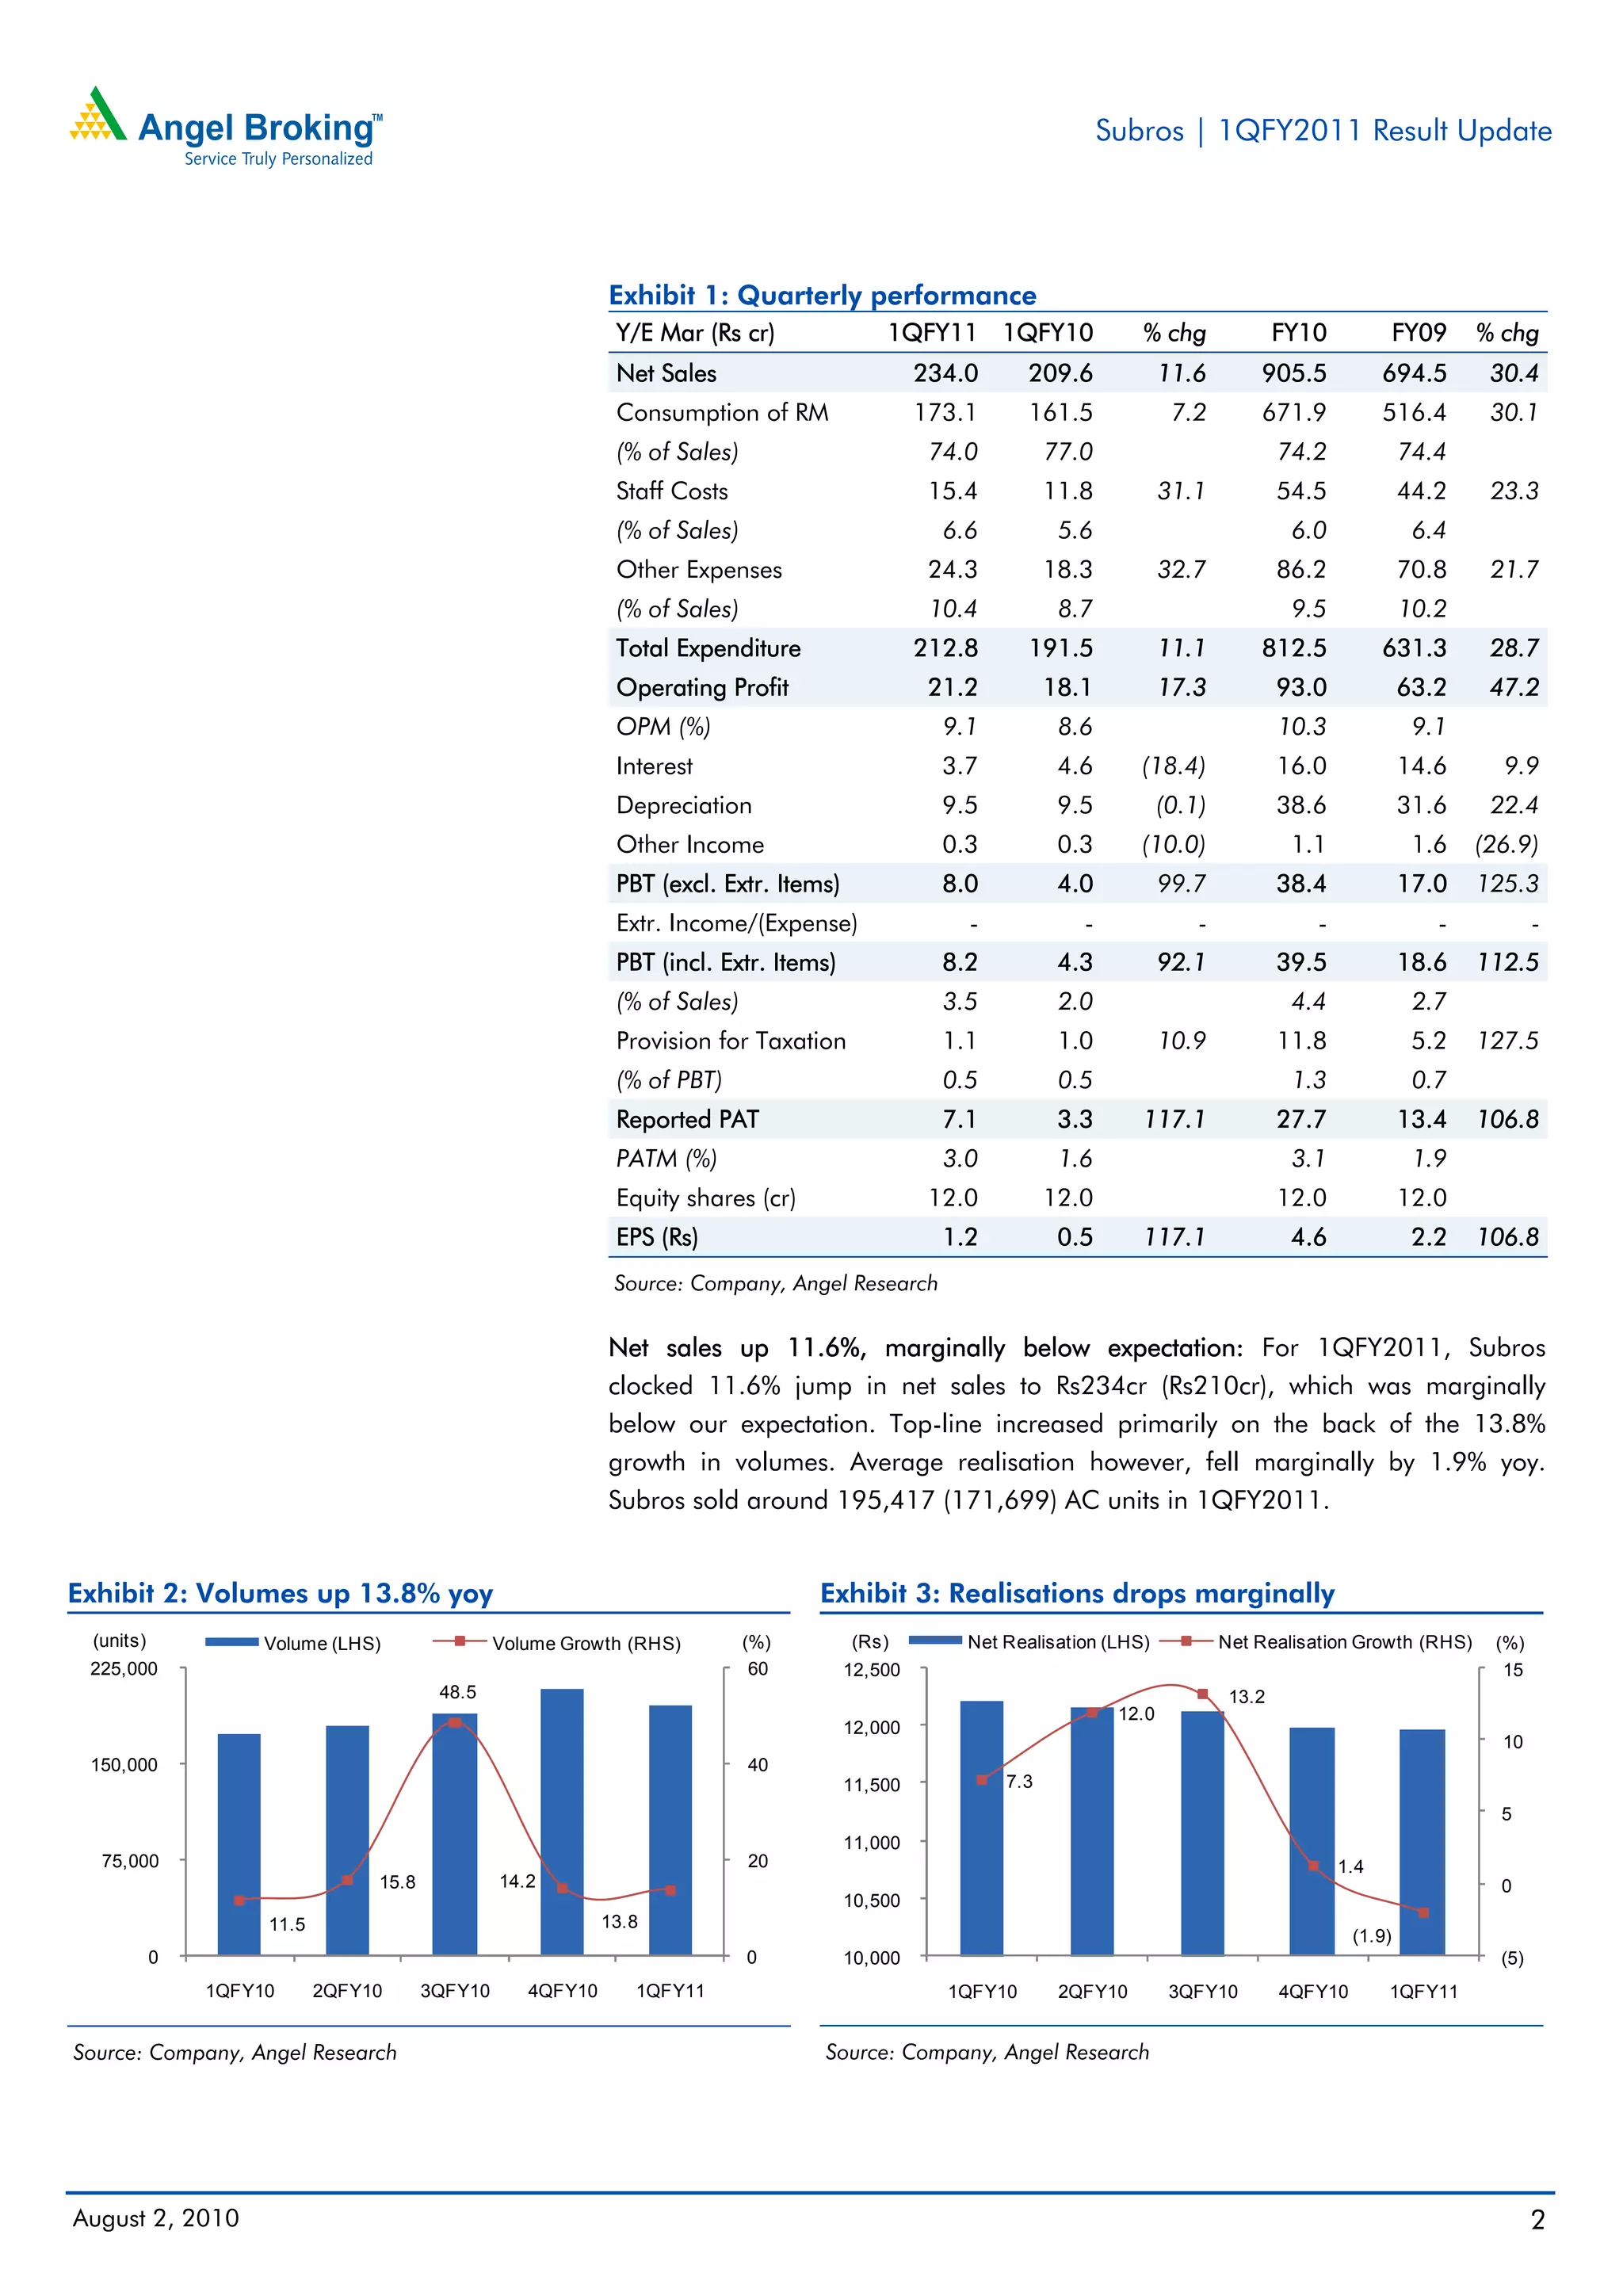
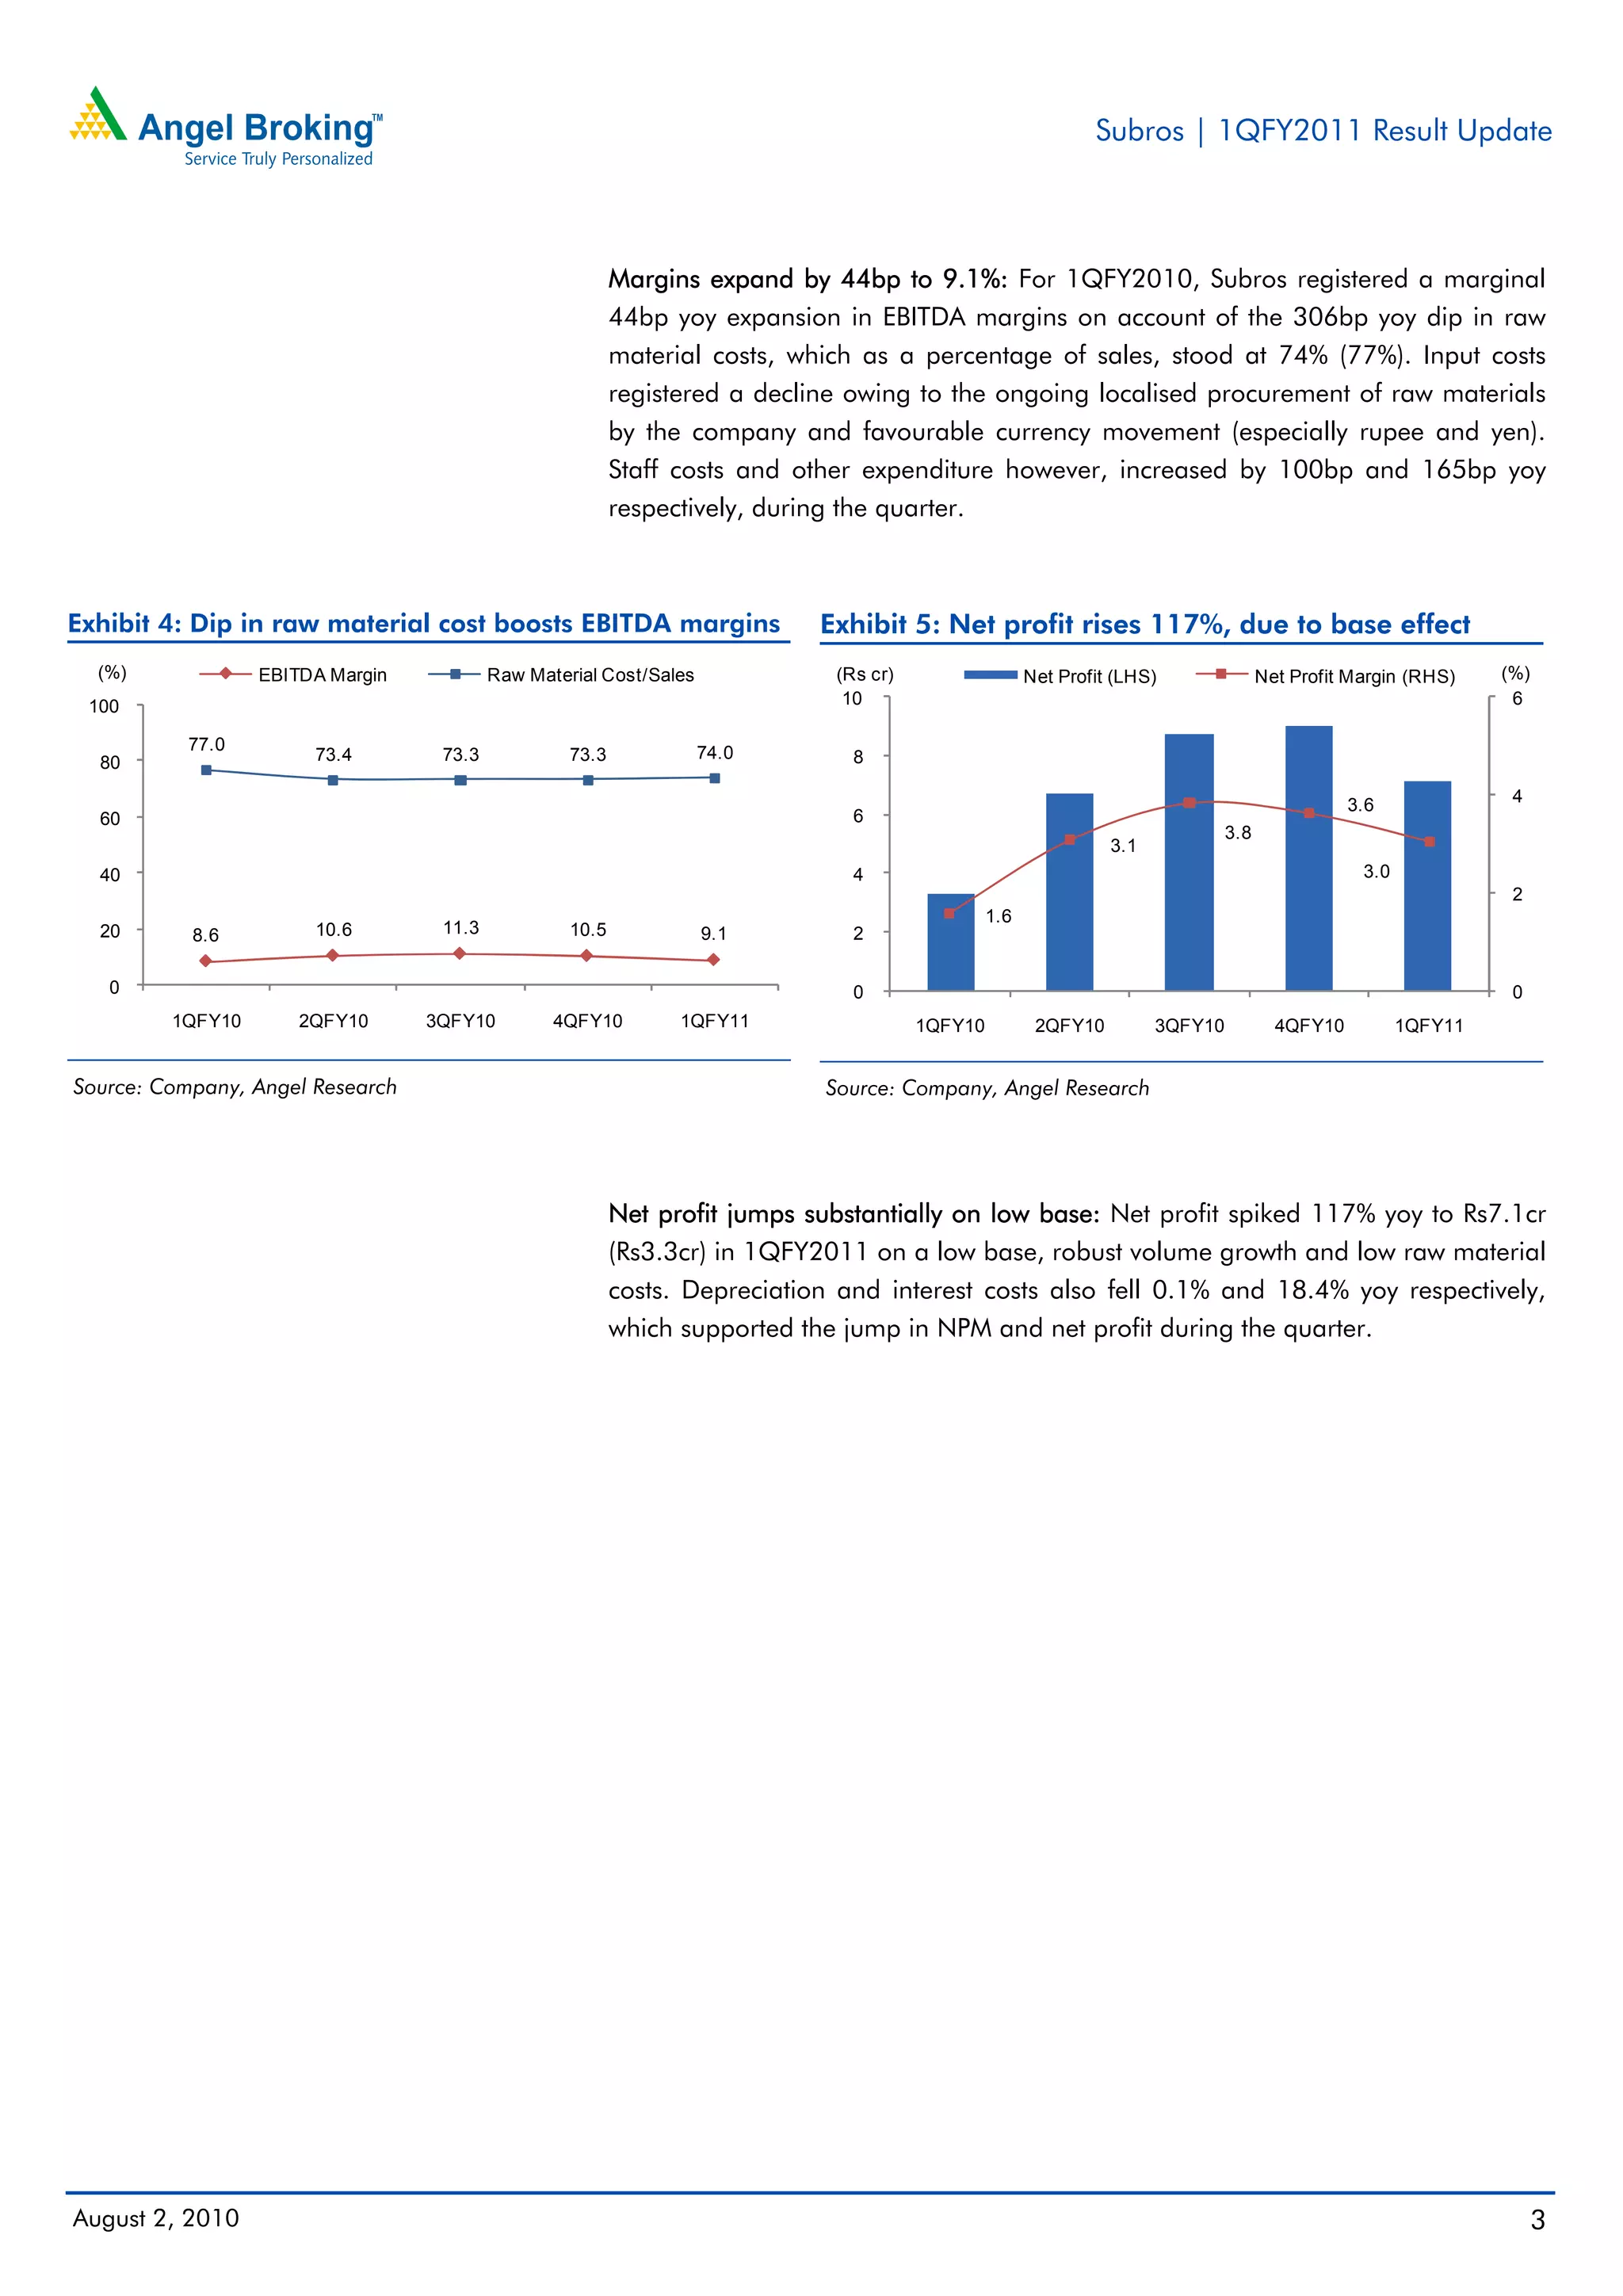

Subros reported an 11.6% increase in net sales for the first quarter of FY2011 compared to the same period last year, aided by a 13.8% growth in volumes. Operating profit rose 17.3% while net profit jumped 117.1% due to lower raw material costs and expansion in operating margins. The company maintained its outlook for 15% annual volume growth over the next two years but expects pricing pressure to limit revenue growth to around 10% annually. The analyst maintains a 'Buy' rating with a target price of Rs60 per share based on projected earnings growth and reasonable valuation.


