Download to read offline

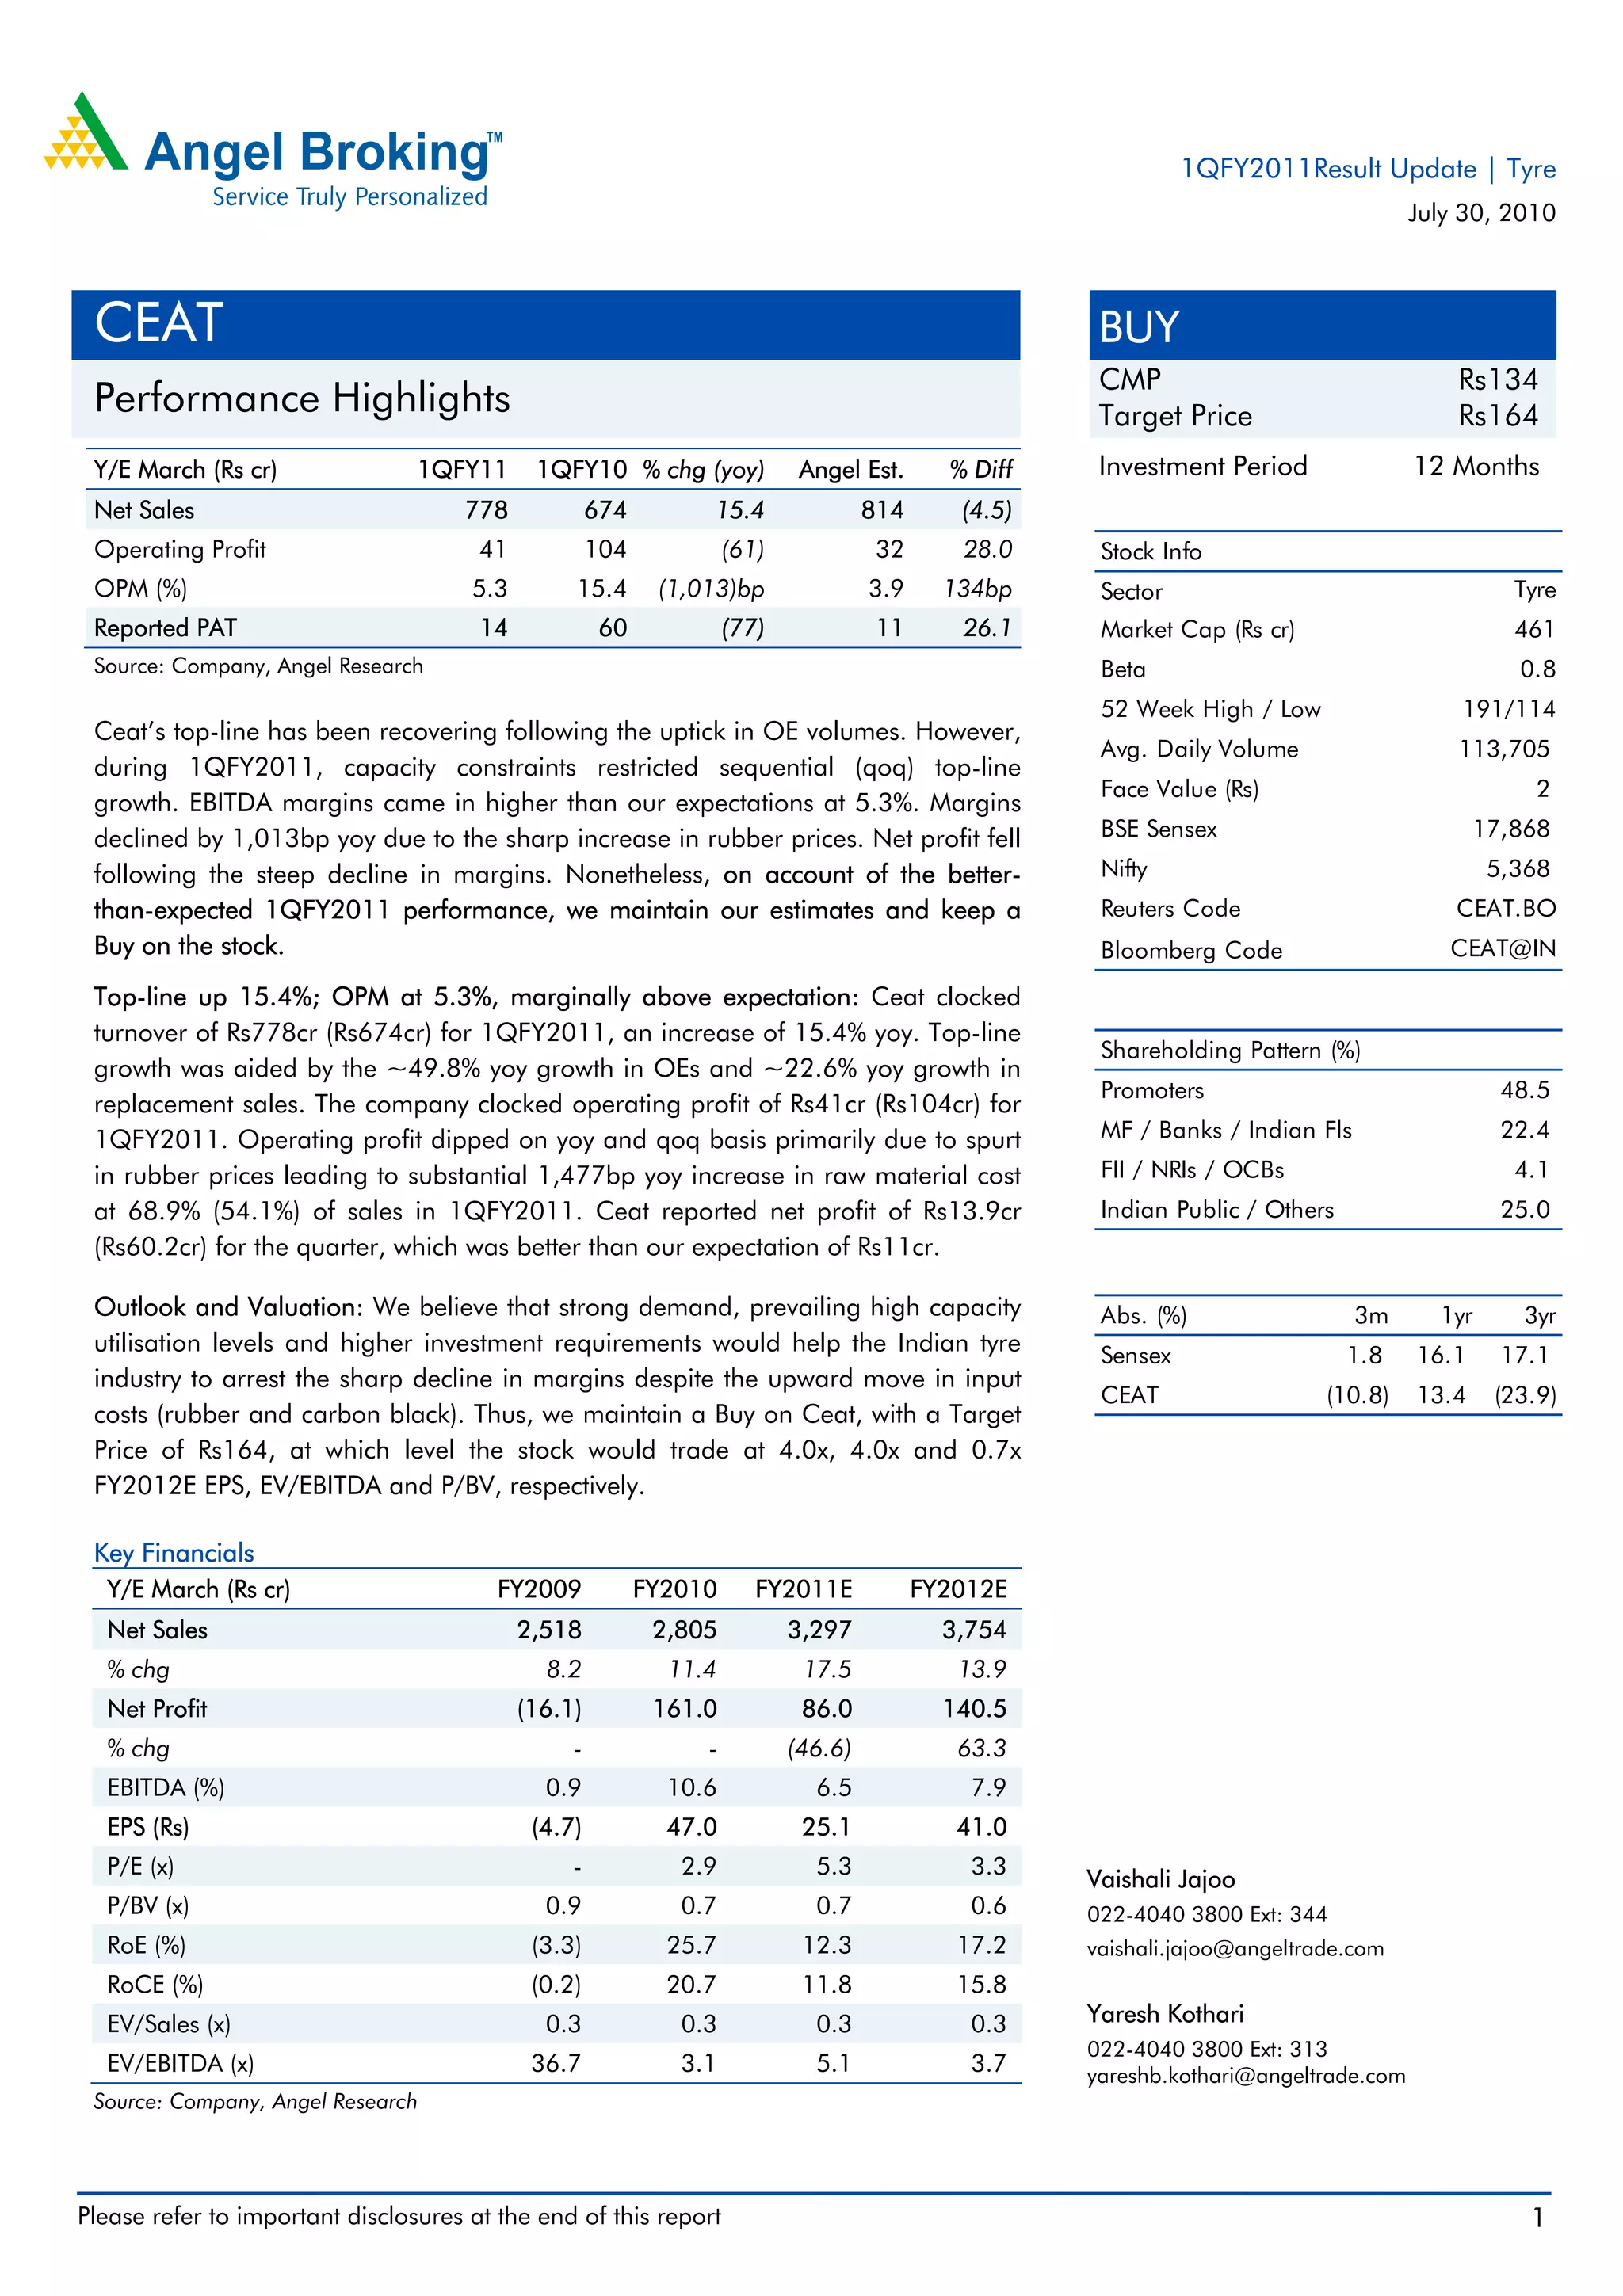
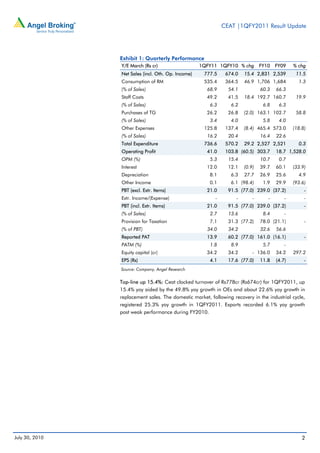
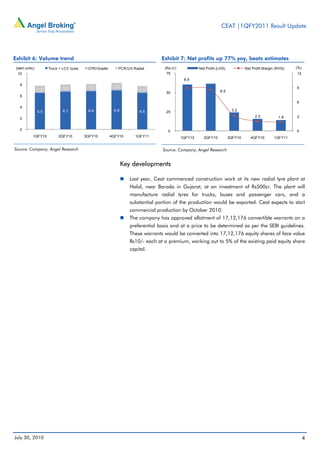
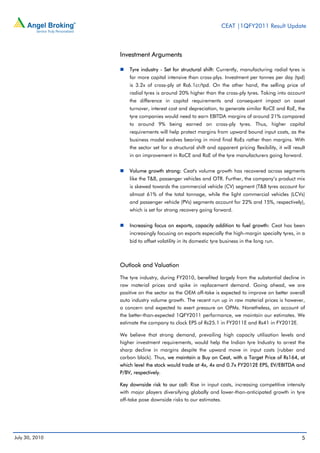
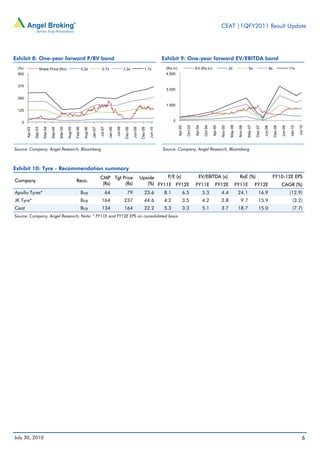
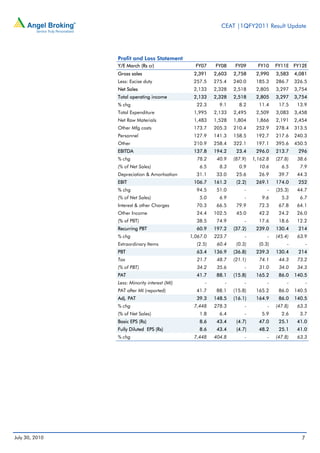

Ceat reported its results for the first quarter of fiscal year 2011. While the company's net sales grew 15.4% year-over-year to Rs. 778 crore, its operating profit declined 61% to Rs. 41 crore due to a sharp rise in raw material prices. The operating margin was 5.3% compared to 15.4% in the prior year quarter. Net profit fell 77% to Rs. 13.9 crore. However, results were marginally better than expected. The analyst maintains a 'Buy' rating on Ceat based on strong demand fundamentals in the tyre industry and expectations that margins will recover as the business model shifts towards more capital-intensive radial tyres.