ABB India
•
0 likes•157 views

ABB India reported disappointing 2QCY2010 results with revenues of Rs1,447cr, down 3.9% YoY. Net profit fell 54% YoY to Rs38cr due to higher costs and forex losses. Segment results were weak with the power systems segment reporting a loss compared to a profit last year. Order inflows declined 41% YoY to Rs1,235cr due to delays in large orders and pricing pressures.

Recommended
More Related Content
What's hot
What's hot (20)
Viewers also liked
Viewers also liked (20)
Similar to ABB India
Similar to ABB India (20)
More from Angel Broking
More from Angel Broking (20)
Recently uploaded
Recently uploaded (20)
ABB India
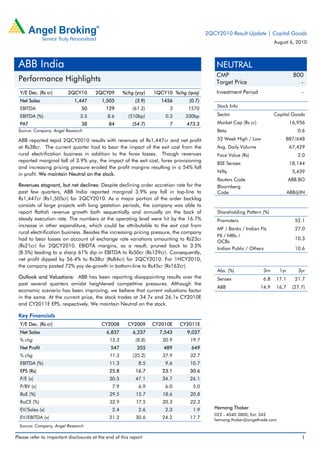
- 1. 2QCY2010 Result Update | Capital Goods August 6, 2010 ABB India NEUTRAL CMP 800 Performance Highlights Target Price - Y/E Dec. (Rs cr) 2QCY10 2QCY09 %chg (yoy) 1QCY10 %chg (qoq) Investment Period - Net Sales 1,447 1,505 (3.9) 1456 (0.7) Stock Info EBITDA 50 129 (61.2) 3 1570 EBITDA (%) 3.5 8.6 (510bp) 0.2 330bp Sector Capital Goods PAT 38 84 (54.7) 7 473.3 Market Cap (Rs cr) 16,956 Source: Company, Angel Research Beta 0.6 ABB reported tepid 2QCY2010 results with revenues of Rs1,447cr and net profit 52 Week High / Low 887/648 at Rs38cr. The current quarter had to bear the impact of the exit cost from the Avg. Daily Volume 67,429 rural electrification business in addition to the forex losses. Though revenues Face Value (Rs) 2.0 reported marginal fall of 3.9% yoy, the impact of the exit cost, forex provisioning BSE Sensex 18,144 and increasing pricing pressure eroded the profit margins resulting in a 54% fall Nifty 5,439 in profit. We maintain Neutral on the stock. Reuters Code ABB.BO Revenues stagnant, but net declines: Despite declining order accretion rate for the Bloomberg past few quarters, ABB India reported marginal 3.9% yoy fall in top-line to Code ABB@IN Rs1,447cr (Rs1,505cr) for 2QCY2010. As a major portion of the order backlog consists of large projects with long gestation periods, the company was able to report flattish revenue growth both sequentially and annually on the back of Shareholding Pattern (%) steady execution rate. The numbers at the operating level were hit by the 16.7% Promoters 52.1 increase in other expenditure, which could be attributable to the exit cost from MF / Banks / Indian Fls 27.0 rural electrification business. Besides the increasing pricing pressure, the company FII / NRIs / had to bear losses on account of exchange rate variations amounting to Rs23cr 10.3 OCBs (Rs21cr) for 2QCY2010. EBIDTA margins, as a result, pruned back to 3.5% Indian Public / Others 10.6 (8.5%) leading to a sharp 61% dip in EBITDA to Rs50cr (Rs129cr). Consequently, net profit dipped by 56.4% to Rs38cr (Rs84cr) for 2QCY2010. For 1HCY2010, the company posted 72% yoy de-growth in bottom-line to Rs45cr (Rs162cr). Abs. (%) 3m 1yr 3yr Outlook and Valuations: ABB has been reporting disappointing results over the Sensex 6.8 17.1 21.7 past several quarters amidst heightened competitive pressures. Although the ABB 14.9 16.7 (27.7) economic scenario has been improving, we believe that current valuations factor in the same. At the current price, the stock trades at 34.7x and 26.1x CY2010E and CY2011E EPS, respectively. We maintain Neutral on the stock. Key Financials Y/E Dec. (Rs cr) CY2008 CY2009 CY2010E CY2011E Net Sales 6,837 6,237 7,543 9,027 % chg 15.3 (8.8) 20.9 19.7 Net Profit 547 355 489 649 % chg 11.3 (35.2) 37.9 32.7 EBITDA (%) 11.3 8.5 9.6 10.7 EPS (Rs) 25.8 16.7 23.1 30.6 P/E (x) 30.5 47.1 34.7 26.1 P/BV (x) 7.9 6.9 6.0 5.0 RoE (%) 29.5 15.7 18.6 20.8 RoCE (%) 32.9 17.5 20.3 22.3 EV/Sales (x) 2.4 2.6 2.3 1.9 Hemang Thaker 022 - 4040 3800; Ext: 342 EV/EBITDA (x) 21.2 30.6 24.2 17.7 hemang.thaker@angeltrade.com Source: Company, Angel Research Please refer to important disclosures at the end of this report 1
- 2. ABB |2QCY2010 Result Update Exhibit 1: 2QCY2010 Performance Y/E Dec. (Rs cr) 2QCY2010 2QCY2009 yoy (%) 1QCY2010 qoq (%) CY2009 CY2008 yoy (%) Net Sales 1,447 1,505 (3.9) 1,456 (0.7) 6,237 6,837 (8.8) Raw Material 1,039 1,066 (2.4) 1,079 (3.7) 4,518 4,950 (8.7) (% of Net Sales) 71.8 70.8 74.1 72.4 72.4 Employee Cost 123 109 (13.3) 117 5.0 389 402 (3.2) (% of Net Sales) 8.5 7.2 8.0 6.2 5.9 Other Expenses 212 182 16.7 174 21.5 802 713 12.5 (% of Net Sales) 14.6 12.1 12.0 12.9 10.4 Exchange Rate loss 23 21 9.7 82 (72.4) - - (% of Net Sales) 1.6 1.4 5.7 Total Expenditure 1,396 1,376 1.5 1,453 (3.9) 5,709 6,065 (5.9) EBITDA 50 129 (61.2) 3 1570.0 529 772 (31.5) EBITDA (%) 3.5 8.6 0.2 8.5 11.3 Interest 4 8 (46.6) 3.8 12.9 25.4 33 (21.8) Depreciation 12 12 (2.4) 12 0.8 49 37 32.2 Other Income 22 21 21.2 73 130.0 (44.3) Profit before Tax 56 129 (57.0) 8.4 562.0 527 833 (36.7) (% of Net Sales) 3.8 8.6% 0.6 8.5 12.2 Total Tax 17 45 (61.6) 1.7 911.8 173 286 (39.6) (% of PBT) 30.9 34.6 20.2 32.8 34.3 Reported PAT 38 84 (54.6) 7 473.3 355 547 (35.2) (% of Net Sales) 2.7 5.6 0.5 5.7 8.0 Source: Company, Angel Research Disappointing results: ABB India reported marginal 3.9% yoy fall in top-line to Rs1,447cr (Rs1,505cr) for 2QCY2010. Raw material cost, as a percentage of sales, rose by 100bp to 71.8% (70.8), while employee costs increased by 130bp to 8.5% (7.2%) of sales for 2QCY2010. The numbers at the operating level were further hit by 16.7% yoy increase in other expenditure, which could be attributable to the exit cost from the rural electrification business. Besides the increasing pricing pressure, the company had to bear losses on account of exchange rate variations amounting to Rs23cr (Rs21cr). EBIDTA margins, as a result, pruned back to 3.5% (8.6%) leading to a sharp 61.2% dip in EBITDA to Rs50cr (Rs129cr). Interest cost fell by 46.6% yoy to Rs4cr on the back of reduction in debt. Net profit dipped by 54% to Rs38cr (Rs84cr) for 2QCY2010. Uninspiring results in core operations: The power systems, power products and process automation segments registered revenue yoy de-growth of 10%, 11.5% and 28% respectively, during 2QCY2010. Although weakness was seen in most of ABB’s primary business segments, the power systems reported 259% dip in EBIT to Rs21cr loss, as compared to Rs13cr profit during the corresponding period of last year. Similarly, the power product segment reported a 47.1% yoy fall in EBIT to Rs28cr (Rs68cr), with margins contracting by 710bp to 6.4% (13.5%) for 2QCY2010. The process automation segment reported 33% fall in EBIT to Rs21cr (Rs31cr), with margins contracting by 70bp to 9.2% (9.9%). August 6, 2010 2
- 3. ABB |2QCY2010 Result Update Exhibit 2: Segment-wise performance Y/E Dec. (Rs cr) 2QCY10 2QCY09 yoy % CY09 CY08 yoy % Revenues Power Systems 417 464 (10.1) 800 911 (12.2) Power Products 444 502 (11.5) 876 928 (5.6) Process Automation 226 313 (27.8) 512 564 (9.1) Discrete Automation 365 318 14.7 761 627 21.4 Low Voltage Products 103 82 25.6 201 160 25.7 EBIT Power Systems (21) 13 (259.0) (69) 41 (268.0) Power Products 28 68 (47.1) 64 122 (47.3) Process Automation 21 31 (33.0) 51 62 (17.1) Discrete Automation 46 27 70.4 57 46 24.4 Low Voltage Products (0.28) (3.2) (91.3) (1.0) (6) (81.8) EBIT Margin (%) Power Systems (5.1) 2.9 Power Products 6.4 13.5 Process Automation 9.2 9.9 Discrete Automation 12.6 8.5 Low Voltage Products (0.2) (3.7) Source: Company, Angel Research Segment-wise performance: The huge slump in bottom-line is attributable to the underperformance by the power systems business for the past several quarters on account of project delays in the T&D market. The power systems segment revenues witnessed a drop of 10.1% yoy to Rs417cr (Rs464cr). However, it registered a loss of Rs21cr for 2QCY2010 compared to a profit of Rs13cr for prior year corresponding period. Similarly, the power products segment reported 11.5% yoy fall in revenue to Rs444cr (Rs502cr), with a 47.1% yoy fall in segment EBIT to Rs28cr (Rs68cr) for 2QCY2010. This resulted into steep margin contraction by 710bp to 6.4% (13.5%) for 2QCY2010. The power segments was hit hard due to the delay in deliveries coupled with pricing pressures. The low voltage products segment posted a decent growth of 25.6% yoy to Rs103cr (Rs82cr) for 2QCY2010. However, the segment reported a loss of Rs28lakh for the quarter, which improved significantly from a loss of Rs3.2cr in the prior year period. August 6, 2010 3
- 4. ABB |2QCY2010 Result Update Order book: Order inflows during the quarter dipped by 41% yoy to Rs1,235cr (Rs2,116cr). Order accretion was impacted by the delays in conclusion of few large orders and prevailing pricing pressures. Base orders from the process automation and discrete automation segments have picked up on the back of the revival of industrial activities. The order backlog has increased by 12% to Rs8,531cr (Rs7,622cr) on account of the slower-than-expected execution rate. Exhibit 3: Quarterly order inflow 2,500 2,303 2,376 2,208 2,116 2,000 1,889 1,893 1,688 1,500 1,261 1,253 (Rs cr) 1,000 500 - 2CY08 3CY08 4CY08 1CY09 2CY09 3CY09 4CY09 1CY10 2CY10 Source: Company, Angel Research Exhibit 4: Quarterly order backlog 10,000 9,000 8,478 8,753 8,531 8,023 8,000 7,622 6,776 6,793 7,031 7,000 6168 6,000 (Rs cr) 5,000 4,000 3,000 2,000 1,000 - 2CY08 3CY08 4CY08 1CY09 2CY09 3CY09 4CY09 1CY10 2CY10 Source: Company, Angel Research Exhibit 5: Execution speed (Sales-to-order book) 35 31.9 30 26.1 25 22.4 22.6 23.5 21.4 19.1 20 17.2 16.5 (%) 15 10 5 0 2CY08 3CY08 4CY08 1CY09 2CY09 3CY09 4CY09 1CY10 2CY10 Source: Company, Angel Research August 6, 2010 4
- 5. ABB |2QCY2010 Result Update Investment Rationale Generation delays to impact T&D growth: Power-related segments (power systems and power products) continue to be the company’s key revenue driver accounting for around 29% and 31% of its total revenues. Pertinently, the power sector capex is relatively resilient with majority of the projects being envisaged by the central and state sector utilities. However, major worry for the T&D sector is capacity addition delays, which in turn would adversely impact growth prospects of the T&D equipment suppliers. The T&D sector has high correlation with the power capacity addition. Notably, around 60% of the planned transmission expenditure for the Eleventh Plan is directly associated with the concurrent addition in generation capacity. Tapering top-line growth: During CY2003-07, ABB posted phenomenal top-line CAGR of 41.8% primarily driven by the 45.6% surge in order inflows. However since CY2008, the growth rate has declined, and in view of the current diverse set of challenges that the company faces, we expect the previous high growth trajectory to get muted in the ensuing years. Over CY2009 –11E, we estimate ABB's order inflow growth to taper down to a CAGR of 12.8% resulting in corresponding moderation in revenue CAGR to 20.3%. Outlook and Valuation: The company has been reporting poor set of numbers over the past several quarters. Besides, heightened competitive pressures in the market on account of price undercutting by the players will also continue to pressurise margins in the near term. Although the broader economic scenario has improved to an extent, we believe that current valuations factor in the same. At the current price, the stock trades at 34.7x CY2010E EPS and at 26.1x CY2011E EPS, respectively. We maintain our Neutral recommendation on the stock. August 6, 2010 5
- 6. ABB |2QCY2010 Result Update Exhibit 6: Actual v/s Angel estimates Particulars (Rs cr) Actual Estimates Var (%) Revenues 1,447 1,810 (20.1) Operating Profit 50 137 (63.5) PAT 38 93 (59.1) EPS (Rs) 1.8 4.4 (59.1) Source: Company, Angel Research Exhibit 7: Angel EPS Forecast v/s Consensus Year Angel forecast (Rs) Bloomberg consensus (Rs) Var (%) CY2010E 23.1 19.1 20.9 CY2011E 30.6 26.8 14.2 Source: Bloomberg, Angel Research Exhibit 8: Key assumptions Particulars CY2010E CY2011E Order Inflow (Rs cr) 9,607 11,048 Order Inflow Growth (%) 10.6 15 Order Backlog (Rs cr) 10,543 12,565 Order Backlog Growth (%) 24.4 19.2 Order Book to Sales (%) 41.7 41.8 Source: Company, Angel Research Exhibit 9: One-year forward P/E band 1,800 1,600 1,400 1,200 1,000 800 600 400 200 0 Jun-07 Jun-10 Apr-05 Mar-08 Sep-06 Sep-09 Dec-05 Dec-08 Share Price (Rs) 12x 20x 28x 36x Source: Company, Angel Research August 6, 2010 6
- 7. ABB |2QCY2010 Result Update Exhibit 10: Peer Valuation CMP Tgt Price Upside FY2012E FY2012E FY2010-12E FY2012E FY2012E Company Reco EPS CAGR (Rs) (Rs) (%) P/BV (x) P/E(x) RoCE (%) RoE (%) (%) ABB* Neutral 800 - - 5.0 26.1 35.3 22.3 20.8 Areva T&D* Sell 290 - - 6.0 29.3 11.3 17.6 22.2 BHEL Neutral 2,507 - - 5.0 19.3 21.5 30.4 28.6 BGR Energy Neutral 798 4.9 16.6 31 17.7 33.6 Crompton Greaves Accumulate 281 307 7.7 4.5 18.2 7.2 27.1 27.3 Jyoti Structures Buy 153 215 40.5 1.7 9.3 21.4 19.3 20.6 KEC International Buy 473 648 37.0 2.2 9.5 22.3 18.9 26.2 Thermax Neutral 760 - - 5.4 20.3 30.9 31 29.5 Source: Company, Angel Research; Note: *December year ending August 6, 2010 7
- 8. ABB |2QCY2010 Result Update Profit & Loss Statement Y/E Dec. (Rs cr) CY2007 CY2008 CY2009 CY2010E CY2011E Net Sales 5,930 6,837 6,237 7,543 9,027 Other operating income - - - - - Total operating income 5,930 6,837 6,237 7,543 9,027 % chg 39 15 (9) 21 20 Total Expenditure 5,201 6,067 5,710 6,818 8,064 Net Raw Materials 4,292 4,950 4,518 5,450 6,477 Other Mfg costs 603 714 803 920 1,071 Personnel 306 403 389 449 516 Other - - - - - EBITDA 730 770 527 724 962 % chg 53 6 (31) 37 33 (% of Net Sales) 12 11 8 10 11 Depreciation& 32 37 49 55 62 Amortisation EBIT 697 733 479 669 901 % chg 55 5 (35) 40 35 (% of Net Sales) 12 11 8 9 10 Interest & other Charges 12 35 26 25 25 Other Income 71 130 73 85 93 (% of PBT) 9 16 14 12 10 Others - 4 2 - - Recurring PBT 756 833 527 730 968 % chg 45 10 (37) 38 33 Extraordinary - - - - - Expense/(Inc.) PBT (reported) 756 833 527 730 968 Tax 265 286 173 241 320 (% of PBT) 35 34 33 33 33 PAT (reported) 492 547 355 489 649 Add: Share of earnings of - - - - - associate Less: Minority interest (MI) - - - - - Prior period items - - - - - PAT after MI (reported) 492 547 355 489 649 ADJ. PAT 492 547 355 489 649 % chg 44 11 (35) 38 33 (% of Net Sales) 8 8 6 6 7 Basic EPS (Rs) 23 26 17 23 31 Fully Diluted EPS (Rs) 23 26 17 23 31 % chg 44 11 (35) 38 33 August 6, 2010 8
- 9. ABB |2QCY2010 Result Update Balance Sheet Y/E Dec. (Rs cr) CY2007 CY2008 CY2009 CY2010E CY2011E SOURCES OF FUNDS Equity Share Capital 42 42 42 42 42 Preference Capital - - - - - Reserves& Surplus 1,569 2,062 2,367 2,797 3,371 Shareholders Funds 1,612 2,105 2,410 2,839 3,414 Minority Interest - - - - - Total Loans 1 0 - - - Deferred Tax Liability 13 4 (0) (0) (0) Total Liabilities 1,625 2,108 2,410 2,839 3,414 APPLICATION OF FUNDS Gross Block 562 752 865 973 1,078 Less: Acc. Depreciation 225 221 206 261 323 Net Block 337 532 659 712 755 Capital Work-in-Progress 106 138 116 108 104 Goodwill - - - - - Investments 70 61 17 17 17 Current Assets 4,111 4,700 4,749 6,305 7,120 Cash 643 348 524 730 1,207 Loans & Advances 280 352 318 384 460 Other 275 381 320 387 464 Current liabilities 2,999 3,322 3,132 4,303 4,582 Net Current Assets 1,111 1,378 1,617 2,002 2,538 Mis. Exp. not written off - - - - - Total Assets 1,625 2,108 2,410 2,839 3,414 August 6, 2010 9
- 10. ABB |2QCY2010 Result Update Cash Flow Statement Y/E Dec. (Rs cr) CY2007 CY2008 CY2009 CY2010E CY2011E Profit before tax 756 833 527 730 968 Depreciation 32 37 49 55 62 (Inc)/Dec in Working Capital (210) (562) (63) (178) (60) Less: Other income 71 130 73 85 93 Direct taxes paid 266 295 177 241 320 Cash Flow from Operations 242 (117) 264 280 558 (Inc.)/Dec.in Fixed Assets (144) (221) (92) (100) (100) (Inc.)/Dec. in Investments 7 9 44 - - Other income 71 130 73 85 93 Cash Flow from Investing (66) (82) 25 (15) (7) Issue of Equity - - - - - Inc./(Dec.) in loans (1) (1) (0) - - Dividend Paid (Incl. Tax) 55 55 50 60 74 Others (24) (41) (63) - - Cash Flow from Financing (56) (55) (50) (60) (74) Inc./(Dec.) in Cash 96 (295) 176 206 476 Opening Cash balances 546 643 348 524 730 Closing Cash balances 643 348 524 730 1,207 August 6, 2010 10
- 11. ABB |2QCY2010 Result Update Key Ratios Y/E Dec. CY2007 CY2008 CY2009 CY2010E CY2011E Valuation Ratio (x) P/E (on FDEPS) 34.5 31.0 47.8 34.7 26.1 P/CEPS 32.3 29.0 42.1 31.2 23.9 P/BV 10.5 8.1 7.0 6.0 5.0 Dividend yield (%) 0.3 0.3 0.3 0.3 0.4 EV/Sales 2.7 2.4 2.6 2.3 1.9 EV/EBITDA 21.9 21.2 30.6 24.2 17.7 EV/Total Assets 9.8 7.7 6.7 6.2 5.0 Per Share Data (Rs) EPS (Basic) 23.2 25.8 16.7 23.1 30.6 EPS (fully diluted) 23.2 25.8 16.7 23.1 30.6 Cash EPS 24.7 27.6 19.0 25.7 33.5 DPS 2.2 2.2 2.0 2.4 3.0 Book Value 76.1 99.3 113.7 134.0 161.1 Dupont Analysis EBIT margin (%) 11.8 10.7 7.7 8.9 10.0 Tax retention ratio 0.6 0.7 0.7 0.7 0.7 Asset turnover (x) 8.0 5.2 3.5 3.8 4.2 ROIC (Post-tax) (%) 60.9 36.9 18.1 22.6 28.2 Cost of Debt (Post Tax) (%) - - - - - Leverage (x) - - - - - Operating RoE (%) 60.9 36.9 18.1 22.6 28.2 Returns (%) RoCE (Pre-tax) 49.4 39.3 21.2 25.5 28.8 Angel RoIC (Pre-tax) 102.8 61.9 28.9 35.8 44.3 RoE 35.2 29.5 15.7 18.6 20.8 Turnover ratios (x) Asset Turnover (Gross Block) 11.2 10.4 7.7 8.2 8.8 Inventory / Sales (days) 26 30 40 38 36 Receivables (days) 123 144 171 165 162 Payables (days) 78 83 92 89 85 Working capital cycle (ex-cash) 29 55 64 62 54 (days) Solvency ratios (x) Net debt to equity (0.4) (0.2) (0.2) (0.3) (0.4) Net debt to EBITDA (1.0) (0.5) (1.0) (1.0) (1.3) Interest Coverage (EBIT / 59.5 21.2 18.7 26.8 36.0 Interest) August 6, 2010 11
- 12. ABB |2QCY2010 Result Update Research Team Tel: 022 - 4040 3800 E-mail: research@angeltrade.com Website: www.angeltrade.com DISCLAIMER This document is solely for the personal information of the recipient, and must not be singularly used as the basis of any investment decision. Nothing in this document should be construed as investment or financial advice. Each recipient of this document should make such investigations as they deem necessary to arrive at an independent evaluation of an investment in the securities of the companies referred to in this document (including the merits and risks involved), and should consult their own advisors to determine the merits and risks of such an investment. Angel Broking Limited, its affiliates, directors, its proprietary trading and investment businesses may, from time to time, make investment decisions that are inconsistent with or contradictory to the recommendations expressed herein. The views contained in this document are those of the analyst, and the company may or may not subscribe to all the views expressed within. Reports based on technical and derivative analysis center on studying charts of a stock's price movement, outstanding positions and trading volume, as opposed to focusing on a company's fundamentals and, as such, may not match with a report on a company's fundamentals. The information in this document has been printed on the basis of publicly available information, internal data and other reliable sources believed to be true, but we do not represent that it is accurate or complete and it should not be relied on as such, as this document is for general guidance only. Angel Broking Limited or any of its affiliates/ group companies shall not be in any way responsible for any loss or damage that may arise to any person from any inadvertent error in the information contained in this report. Angel Broking Limited has not independently verified all the information contained within this document. Accordingly, we cannot testify, nor make any representation or warranty, express or implied, to the accuracy, contents or data contained within this document. While Angel Broking Limited endeavours to update on a reasonable basis the information discussed in this material, there may be regulatory, compliance, or other reasons that prevent us from doing so. This document is being supplied to you solely for your information, and its contents, information or data may not be reproduced, redistributed or passed on, directly or indirectly. Angel Broking Limited and its affiliates may seek to provide or have engaged in providing corporate finance, investment banking or other advisory services in a merger or specific transaction to the companies referred to in this report, as on the date of this report or in the past. Neither Angel Broking Limited, nor its directors, employees or affiliates shall be liable for any loss or damage that may arise from or in connection with the use of this information. Note: Please refer to the important `Stock Holding Disclosure' report on the Angel website (Research Section). Also, please refer to the latest update on respective stocks for the disclosure status in respect of those stocks. Angel Broking Limited and its affiliates may have investment positions in the stocks recommended in this report. Disclosure of Interest Statement ABB India 1. Analyst ownership of the stock No 2. Angel and its Group companies ownership of the stock No 3. Angel and its Group companies' Directors ownership of the stock No 4. Broking relationship with company covered No Note: We have not considered any Exposure below Rs 1 lakh for Angel, its Group companies and Directors. Ratings (Returns) : Buy (> 15%) Accumulate (5% to 15%) Neutral (-5 to 5%) Reduce (-5% to 15%) Sell (< -15%) August 6, 2010 12