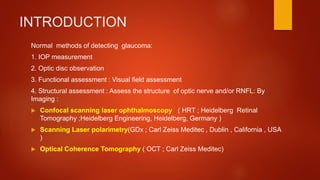
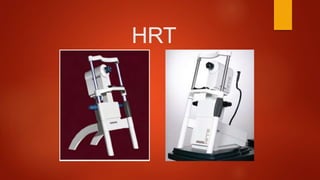
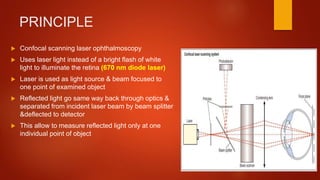
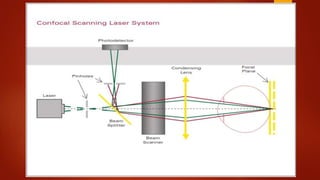
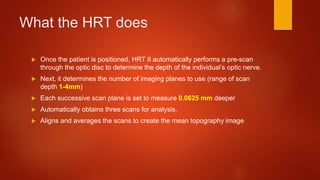
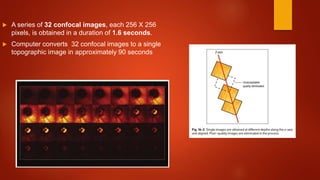
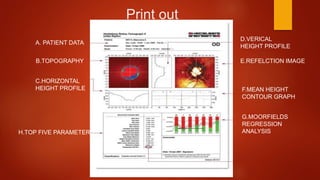
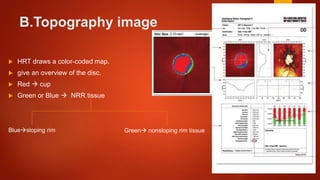
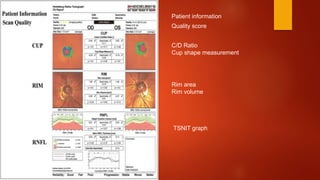
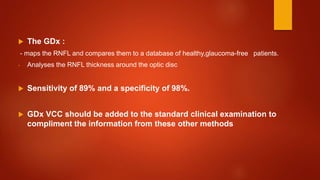
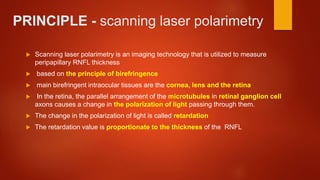
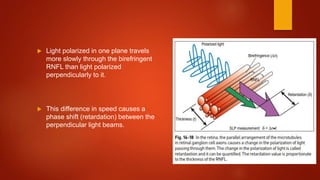
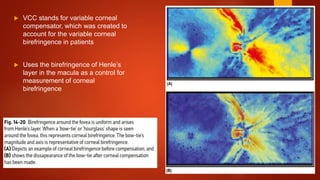
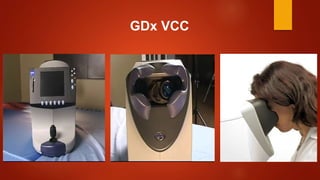
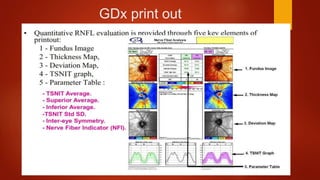
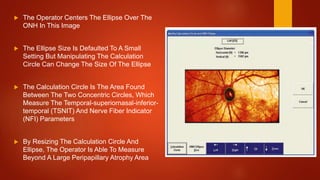
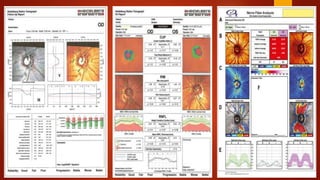
The document discusses two imaging techniques used to detect glaucoma - HRT (Heidelberg Retinal Tomography) and GDx (scanning laser polarimetry). HRT uses confocal scanning laser ophthalmoscopy to generate a 3D topographic image of the optic disc and retinal nerve fiber layer. GDx measures the retinal nerve fiber layer thickness around the optic disc using scanning laser polarimetry, which analyzes the polarization of light passing through the birefringent retinal nerve fiber layer. Both provide objective measures of the optic disc and retinal nerve fiber layer but have limitations such as dependency on accurate contour line placement for HRT.
Keratometer is an ophthalmic instruments and has a very important role in optometry field specially for IOL power calculation, Contact lens fitting, to rule out corneal pathology and its progression ie Keratoconus, PMCD.
Accommodation/ Accommodation of Eye, Measurement of Accommodation of Eye (hea...Bikash Sapkota
CLICK HERE TO DOWNLOAD FULL PPT ❤❤ https://healthkura.com/measurement-of-accommodation-of-eye/ ❤❤
Dear viewers Check Out my other piece of works at ❤❤❤ https://healthkura.com ❤❤❤
Measurement of Accommodation of eye:
Amplitude, Facility,
Relative Accommodation, Fatigue, Lag,
Dynamic Retinoscopy
Presentation Layout:
-Introduction to accommodation of eye
-Mechanism
-Components
-Measurement of accommodation of eye
- Amplitude
- Facility
- Relative accommodation
- Lag
-Dynamic Retinoscopy
Accommodation
-dioptric adjustment of the crystalline lens of the eye
- to obtain clear vision for a given target of regard
-process by which the refractive power of eye is altered
- to ensure a clear retinal image
For further reading
-Clinical Procedures in Optometry by J.D. Bartlett, J.B. Eskridge, J.F. Amos
-Primary Care Optometry by Theodere Grosvenor
-Borish’s Clinical Refraction by W.J. Benjamin
-Clinical Procedures for Ocular examination by Carlson et al
-American Academy of Ophthalmology
-Optometric Clinical Practice Guideline by American Optometric Association
-Internet
Follow me to get in touch with optometric and ophthalmic updates
To know Humphrey visual field analyser
To know about various types of perimetry
To identify field defect
To recognize that field defect is due to glaucoma or neurological lesion
To know that field defect is progressive or not
Interpretation of HVFA
Recent advances in glaucoma includes all the newer trends in the fields of measurement of increased IOP, assessment of anterior chamber angle and depth assessment and lastly the assessment of changes in the optic nerve head and RNFL thickness.
optical coherence tomography is a new tool that makes retinal diagnosis easier. the above ppt includes a detailed and precise notes on OCT and its interpretation.
Recent diagnostic advances simplified to assist in easy learning with descriptive pictures.Principles of OCT, HRT, CSLO, GDx and interpretation of the same explained with relevant images. The terms ganglion cell complex, glaucoma probabity score and corneal hysteresis explained.
Role of imaging in glaucoma management gunjan chadha
Glaucoma is chronic progressive optic neuropathy in which structural damage( Optic Nerve Head and Retinal Nerve Fiber Layer) proceeds the functional deterioration( Visual Field loss).
Hence structural imaging plays an important role in early diagnosis and follow up of a patient of glaucoma
Sarah Ali Hasan, Dr. Mandeep Singh, “Automatic Diagnosis of Astigmatism for Pentacam Sagittal Maps”, Third International Workshop on Recent Advances in Medical Informatics (RAMI-2014) (Accepted to be published on (27-29Sep). IEEE conference.
Early detection of glaucoma through retinal nerve fiber layer analysis using ...eSAT Journals
Abstract The retinal nerve fiber layer (RNFL) is a vital part of human visual system, which can be directly observed by the fundus camera. This paper describes a method for glaucomatous retina detection based on Texture and Fractal description, followed by classification using support vector machine classifier. The color fundus images are used, in which the region of retinal nerve fibers are analyzed. It is shown that Texture & Fractal dimensions are correlated and linear correlation coefficient values are estimated at 0.35, 0.57, and 0.87 for healthy RNFL, medium loss and severe loss of RNFL respectively. The features are measured at 303 RNFL regions retinal positions in the peri-papillary area from 50 non-glaucomatous and 24 glaucomatous retinal fundus images. The presented method can also be used for glaucoma detection. Keywords- Retinal nerve Fiber layer, Glaucoma, Fractal dimension, texture feature, Box counting method
Anti ulcer drugs and their Advance pharmacology ||
Anti-ulcer drugs are medications used to prevent and treat ulcers in the stomach and upper part of the small intestine (duodenal ulcers). These ulcers are often caused by an imbalance between stomach acid and the mucosal lining, which protects the stomach lining.
||Scope: Overview of various classes of anti-ulcer drugs, their mechanisms of action, indications, side effects, and clinical considerations.
Tom Selleck Health: A Comprehensive Look at the Iconic Actor’s Wellness Journeygreendigital
Tom Selleck, an enduring figure in Hollywood. has captivated audiences for decades with his rugged charm, iconic moustache. and memorable roles in television and film. From his breakout role as Thomas Magnum in Magnum P.I. to his current portrayal of Frank Reagan in Blue Bloods. Selleck's career has spanned over 50 years. But beyond his professional achievements. fans have often been curious about Tom Selleck Health. especially as he has aged in the public eye.
Follow us on: Pinterest
Introduction
Many have been interested in Tom Selleck health. not only because of his enduring presence on screen but also because of the challenges. and lifestyle choices he has faced and made over the years. This article delves into the various aspects of Tom Selleck health. exploring his fitness regimen, diet, mental health. and the challenges he has encountered as he ages. We'll look at how he maintains his well-being. the health issues he has faced, and his approach to ageing .
Early Life and Career
Childhood and Athletic Beginnings
Tom Selleck was born on January 29, 1945, in Detroit, Michigan, and grew up in Sherman Oaks, California. From an early age, he was involved in sports, particularly basketball. which played a significant role in his physical development. His athletic pursuits continued into college. where he attended the University of Southern California (USC) on a basketball scholarship. This early involvement in sports laid a strong foundation for his physical health and disciplined lifestyle.
Transition to Acting
Selleck's transition from an athlete to an actor came with its physical demands. His first significant role in "Magnum P.I." required him to perform various stunts and maintain a fit appearance. This role, which he played from 1980 to 1988. necessitated a rigorous fitness routine to meet the show's demands. setting the stage for his long-term commitment to health and wellness.
Fitness Regimen
Workout Routine
Tom Selleck health and fitness regimen has evolved. adapting to his changing roles and age. During his "Magnum, P.I." days. Selleck's workouts were intense and focused on building and maintaining muscle mass. His routine included weightlifting, cardiovascular exercises. and specific training for the stunts he performed on the show.
Selleck adjusted his fitness routine as he aged to suit his body's needs. Today, his workouts focus on maintaining flexibility, strength, and cardiovascular health. He incorporates low-impact exercises such as swimming, walking, and light weightlifting. This balanced approach helps him stay fit without putting undue strain on his joints and muscles.
Importance of Flexibility and Mobility
In recent years, Selleck has emphasized the importance of flexibility and mobility in his fitness regimen. Understanding the natural decline in muscle mass and joint flexibility with age. he includes stretching and yoga in his routine. These practices help prevent injuries, improve posture, and maintain mobilit
Ozempic: Preoperative Management of Patients on GLP-1 Receptor Agonists Saeid Safari
Preoperative Management of Patients on GLP-1 Receptor Agonists like Ozempic and Semiglutide
ASA GUIDELINE
NYSORA Guideline
2 Case Reports of Gastric Ultrasound
Title: Sense of Taste
Presenter: Dr. Faiza, Assistant Professor of Physiology
Qualifications:
MBBS (Best Graduate, AIMC Lahore)
FCPS Physiology
ICMT, CHPE, DHPE (STMU)
MPH (GC University, Faisalabad)
MBA (Virtual University of Pakistan)
Learning Objectives:
Describe the structure and function of taste buds.
Describe the relationship between the taste threshold and taste index of common substances.
Explain the chemical basis and signal transduction of taste perception for each type of primary taste sensation.
Recognize different abnormalities of taste perception and their causes.
Key Topics:
Significance of Taste Sensation:
Differentiation between pleasant and harmful food
Influence on behavior
Selection of food based on metabolic needs
Receptors of Taste:
Taste buds on the tongue
Influence of sense of smell, texture of food, and pain stimulation (e.g., by pepper)
Primary and Secondary Taste Sensations:
Primary taste sensations: Sweet, Sour, Salty, Bitter, Umami
Chemical basis and signal transduction mechanisms for each taste
Taste Threshold and Index:
Taste threshold values for Sweet (sucrose), Salty (NaCl), Sour (HCl), and Bitter (Quinine)
Taste index relationship: Inversely proportional to taste threshold
Taste Blindness:
Inability to taste certain substances, particularly thiourea compounds
Example: Phenylthiocarbamide
Structure and Function of Taste Buds:
Composition: Epithelial cells, Sustentacular/Supporting cells, Taste cells, Basal cells
Features: Taste pores, Taste hairs/microvilli, and Taste nerve fibers
Location of Taste Buds:
Found in papillae of the tongue (Fungiform, Circumvallate, Foliate)
Also present on the palate, tonsillar pillars, epiglottis, and proximal esophagus
Mechanism of Taste Stimulation:
Interaction of taste substances with receptors on microvilli
Signal transduction pathways for Umami, Sweet, Bitter, Sour, and Salty tastes
Taste Sensitivity and Adaptation:
Decrease in sensitivity with age
Rapid adaptation of taste sensation
Role of Saliva in Taste:
Dissolution of tastants to reach receptors
Washing away the stimulus
Taste Preferences and Aversions:
Mechanisms behind taste preference and aversion
Influence of receptors and neural pathways
Impact of Sensory Nerve Damage:
Degeneration of taste buds if the sensory nerve fiber is cut
Abnormalities of Taste Detection:
Conditions: Ageusia, Hypogeusia, Dysgeusia (parageusia)
Causes: Nerve damage, neurological disorders, infections, poor oral hygiene, adverse drug effects, deficiencies, aging, tobacco use, altered neurotransmitter levels
Neurotransmitters and Taste Threshold:
Effects of serotonin (5-HT) and norepinephrine (NE) on taste sensitivity
Supertasters:
25% of the population with heightened sensitivity to taste, especially bitterness
Increased number of fungiform papillae
These lecture slides, by Dr Sidra Arshad, offer a quick overview of physiological basis of a normal electrocardiogram.
Learning objectives:
1. Define an electrocardiogram (ECG) and electrocardiography
2. Describe how dipoles generated by the heart produce the waveforms of the ECG
3. Describe the components of a normal electrocardiogram of a typical bipolar leads (limb II)
4. Differentiate between intervals and segments
5. Enlist some common indications for obtaining an ECG
Study Resources:
1. Chapter 11, Guyton and Hall Textbook of Medical Physiology, 14th edition
2. Chapter 9, Human Physiology - From Cells to Systems, Lauralee Sherwood, 9th edition
3. Chapter 29, Ganong’s Review of Medical Physiology, 26th edition
4. Electrocardiogram, StatPearls - https://www.ncbi.nlm.nih.gov/books/NBK549803/
5. ECG in Medical Practice by ABM Abdullah, 4th edition
6. ECG Basics, http://www.nataliescasebook.com/tag/e-c-g-basics
Factory Supply Best Quality Pmk Oil CAS 28578–16–7 PMK Powder in Stockrebeccabio
Factory Supply Best Quality Pmk Oil CAS 28578–16–7 PMK Powder in Stock
Telegram: bmksupplier
signal: +85264872720
threema: TUD4A6YC
You can contact me on Telegram or Threema
Communicate promptly and reply
Free of customs clearance, Double Clearance 100% pass delivery to USA, Canada, Spain, Germany, Netherland, Poland, Italy, Sweden, UK, Czech Republic, Australia, Mexico, Russia, Ukraine, Kazakhstan.Door to door service
Hot Selling Organic intermediates
The prostate is an exocrine gland of the male mammalian reproductive system
It is a walnut-sized gland that forms part of the male reproductive system and is located in front of the rectum and just below the urinary bladder
Function is to store and secrete a clear, slightly alkaline fluid that constitutes 10-30% of the volume of the seminal fluid that along with the spermatozoa, constitutes semen
A healthy human prostate measures (4cm-vertical, by 3cm-horizontal, 2cm ant-post ).
It surrounds the urethra just below the urinary bladder. It has anterior, median, posterior and two lateral lobes
It’s work is regulated by androgens which are responsible for male sex characteristics
Generalised disease of the prostate due to hormonal derangement which leads to non malignant enlargement of the gland (increase in the number of epithelial cells and stromal tissue)to cause compression of the urethra leading to symptoms (LUTS
New Directions in Targeted Therapeutic Approaches for Older Adults With Mantl...i3 Health
i3 Health is pleased to make the speaker slides from this activity available for use as a non-accredited self-study or teaching resource.
This slide deck presented by Dr. Kami Maddocks, Professor-Clinical in the Division of Hematology and
Associate Division Director for Ambulatory Operations
The Ohio State University Comprehensive Cancer Center, will provide insight into new directions in targeted therapeutic approaches for older adults with mantle cell lymphoma.
STATEMENT OF NEED
Mantle cell lymphoma (MCL) is a rare, aggressive B-cell non-Hodgkin lymphoma (NHL) accounting for 5% to 7% of all lymphomas. Its prognosis ranges from indolent disease that does not require treatment for years to very aggressive disease, which is associated with poor survival (Silkenstedt et al, 2021). Typically, MCL is diagnosed at advanced stage and in older patients who cannot tolerate intensive therapy (NCCN, 2022). Although recent advances have slightly increased remission rates, recurrence and relapse remain very common, leading to a median overall survival between 3 and 6 years (LLS, 2021). Though there are several effective options, progress is still needed towards establishing an accepted frontline approach for MCL (Castellino et al, 2022). Treatment selection and management of MCL are complicated by the heterogeneity of prognosis, advanced age and comorbidities of patients, and lack of an established standard approach for treatment, making it vital that clinicians be familiar with the latest research and advances in this area. In this activity chaired by Michael Wang, MD, Professor in the Department of Lymphoma & Myeloma at MD Anderson Cancer Center, expert faculty will discuss prognostic factors informing treatment, the promising results of recent trials in new therapeutic approaches, and the implications of treatment resistance in therapeutic selection for MCL.
Target Audience
Hematology/oncology fellows, attending faculty, and other health care professionals involved in the treatment of patients with mantle cell lymphoma (MCL).
Learning Objectives
1.) Identify clinical and biological prognostic factors that can guide treatment decision making for older adults with MCL
2.) Evaluate emerging data on targeted therapeutic approaches for treatment-naive and relapsed/refractory MCL and their applicability to older adults
3.) Assess mechanisms of resistance to targeted therapies for MCL and their implications for treatment selection
- Video recording of this lecture in English language: https://youtu.be/lK81BzxMqdo
- Video recording of this lecture in Arabic language: https://youtu.be/Ve4P0COk9OI
- Link to download the book free: https://nephrotube.blogspot.com/p/nephrotube-nephrology-books.html
- Link to NephroTube website: www.NephroTube.com
- Link to NephroTube social media accounts: https://nephrotube.blogspot.com/p/join-nephrotube-on-social-media.html
Pulmonary Thromboembolism - etilogy, types, medical- Surgical and nursing man...VarunMahajani
Disruption of blood supply to lung alveoli due to blockage of one or more pulmonary blood vessels is called as Pulmonary thromboembolism. In this presentation we will discuss its causes, types and its management in depth.
2. INTRODUCTION
Normal methods of detecting glaucoma:
1. IOP measurement
2. Optic disc observation
3. Functional assessment : Visual field assessment
4. Structural assessment : Assess the structure of optic nerve and/or RNFL: By
Imaging :
Confocal scanning laser ophthalmoscopy ( HRT ; Heidelberg Retinal
Tomography ;Heidelberg Engineering, Heidelberg, Germany )
Scanning Laser polarimetry(GDx ; Carl Zeiss Meditec , Dublin , California , USA
)
Optical Coherence Tomography ( OCT ; Carl Zeiss Meditec)
3.
4. Changes in RNFL and optic nerve head may precede the VFD.
ONH can be scanned with HRT and OCT
The nerve fiber layer can be scanned with GDX and OCT
macula can be scanned with OCT
In advanced glaucoma:
1- Scanning computerized ophthalmic diagnostic imaging play a least
prominent role.
2– VF testing is more appropriate to assess disease progression.
7. INTRODUCTION
Non quantitative methods like disc photography, measurement of CDR
require subjective physician interpretation and can be difficult and time-
consuming in a busy clinical practice.and also observer dependent
Have to provide a more objective method to detect changes and
progression
8. The culmination of these efforts has resulted in the development of
confocal scanning laser ophthalmoscopy, which provides rapid,
noninvasive, non contact imaging of the disc.
Provides three-dimensional topographic analysis of optic disk
9. PRINCIPLE
Confocal scanning laser ophthalmoscopy
Uses laser light instead of a bright flash of white
light to illuminate the retina (670 nm diode laser)
Laser is used as light source & beam focused to
one point of examined object
Reflected light go same way back through optics &
separated from incident laser beam by beam splitter
&deflected to detector
This allow to measure reflected light only at one
individual point of object
10.
11. What the HRT does
Once the patient is positioned, HRT II automatically performs a pre-scan
through the optic disc to determine the depth of the individual’s optic nerve.
Next, it determines the number of imaging planes to use (range of scan
depth 1-4mm)
Each successive scan plane is set to measure 0.0625 mm deeper
Automatically obtains three scans for analysis.
Aligns and averages the scans to create the mean topography image
12. A series of 32 confocal images, each 256 X 256
pixels, is obtained in a duration of 1.6 seconds.
Computer converts 32 confocal images to a single
topographic image in approximately 90 seconds
13. Print out
A. PATIENT DATA
B.TOPOGRAPHY
C.HORIZONTAL
HEIGHT PROFILE
D.VERICAL
HEIGHT PROFILE
E.REFELCTION IMAGE
H.TOP FIVE PARAMETERS
F.MEAN HEIGHT
CONTOUR GRAPH
G.MOORFIELDS
REGRESSION
ANALYSIS
14. A.Patient data
Provides information on exam type (baseline or
follow-up), patient demographic information
(patient name , age, gender, ethnicity, etc.), and
basic image information including image focus
position, and whether astigmatic lenses were used
during acquisition.
15. B.Topography image
HRT draws a color-coded map.
give an overview of the disc.
Red cup
Green or Blue NRR tissue
Bluesloping rim Green nonsloping rim tissue
16. Also gives disc size
small (sizes less than 1.6 mm2) Average (1.6 mm–2.6 mm2) Large (greater than 2.6 mm2)
17. C.HORIZONTAL HEIGHT PROFILE
Height profile along the white horizontal line in the topography image.
The subjacent reference line (red) indicates the location of the reference
plane (separation between cup and neuroretinal rim).
The two black lines perpendicular to the
height profile denote the borders
of the disc as defined by the contour line.
18. D.VERTICAL HEIGHT PROFILE
Height profile along the white vertical line in the topography image.
The subjacent reference line (red) indicates the location of the reference
plane (separation between cup and neuroretinal rim).
The two black lines perpendicular to the height profile denote the borders
of the disc as defined by the contour line.
19. E.REFELCTION IMAGE
False-color image that appears similar to a
photograph of the optic disc
Darker areas are regions of decreased overall
reflectance, whereas lighter areas, such as the base
of the cup, are areas of the greatest reflectance
Valuable in locating and drawing the contour line
around the disc margin
In the reflection image the optic nerve head is divided
into 6 sectors.
Depending on this patient’s age and overall disc size the
eye is then statistically classified as.
20. F.MEAN CONTOUR HEIGHT GRAPH
After the contour line is drawn around the border of the optic disc, the
software automatically places a reference plane parallel to the peripapillary
retinal surface located 50 μm below the retinal surface
The reference plane is used to calculate the thickness and cross-sectional
area of the retinal nerve fiber layer
The parameters of area and volume of the neuroretinal rim and optic cup
are also calculated based on the location of the reference plane. cup
area of the image that falls below the reference plane, neuroretinal rim
above the reference plane
21. Green contour line should never go below red reference plane . If it does,
then contour line is likely not in proper position
The graph depicts, from left to right: the thicknesses of the temporal (T);
temporal-superior (TS); nasal-superior (NS); nasal (N); nasal-inferior (NI);
temporalinferior(TI); and temporal (T) sectors.
the thickness of the normal retina is irregular, the contour line will appear
as what is known as the ‘double-hump.’ The hills or ‘humps’
correspond to the superior and inferior nerve fiber layer, which are
normally thicker than the rest of the areas.
Reference line
Retinal surface height profile
23. H.Stereometric analysis
If the SD is greater than 40 µm, the test should be
repeated to improve reproducibility or the results
should be interpreted with caution.
29. Follow-Up Report
Baseline exam, and length of time in months
between reports compared
Topography image red indicate worse area
and green indicate improved area
30. Glaucoma Probability Score (GPS)
new software included in the HRT 3 generation allows calculation of the
GPS
MRA is replaced by GPS.
Shows the probability of damage
Fast, simple interpretation
Based on the 3-D shape of the optic disc and RNFL
Utilizes large, ethnic-selectable databases
Employs artificial intelligence: Relevance Vector Machine
No drawing a contour line or relying on a reference plane
Reduced dependency on operator skill
31. unlike the MRA, the GPS utilizes the
whole topographic image of the optic
disc, including the cup size, cup depth,
rim steepness, and horizontal/vertical
RNFL curvature whereas the MRA uses
only a logarithmic relationship between
the neuroretinal rim and optic disc areas.
32.
33. Limitations
The contour line (which is a subjective determination of the edge of the
disc) and the reference plane set by the device to delineate cup from
rim, are the two main sources of error in this technology.
Because these determinations may be incorrect, this makes the HRT II not
a good on-the-spot diagnostic device. However, in sequential analyses,
these sources of error remain constant and the device is good to measure
change over time.
34. Moorfields Regression Analysis Can Discriminate Glaucomatous Nerves
From Normals With 84.3% Sensitivity And 96.3% Specificity.
How Ever These Problems Were Solved In Hrt3 Where Gpa Software Is
Used.
The HRT Will Occasionally Call A Severely Damaged Optic Nerve Normal
Or A Normal Optic Nerve Abnormal.
Heidelberg Retina Tomography Tends To Overestimate Rim Area In
Small Optic Nerves And To Underestimate Rim Area In Large Nerves.
So On Either Extreme Of Disc Size Range, Care Should Be Taken When
Analyzing These Scans.
36. INTRODUCTION
GDX evaluates the site of damage before the patients experience any vision
loss
GDX is:
- Simple to use and easy for both the patient and operator.
- Near infra-red wavelength(780 nm)
- Measurement time is 0.7 seconds.
- Total chair time less than 3 minutes for both eyes.
- Undilated pupils work best.
- Painless procedure.
- Doesn’t require any drops.
- Completely safe.
37. The GDx :
- maps the RNFL and compares them to a database of healthy,glaucoma-free patients.
- Analyses the RNFL thickness around the optic disc
Sensitivity of 89% and a specificity of 98%.
GDx VCC should be added to the standard clinical examination to
compliment the information from these other methods
38. PRINCIPLE - scanning laser polarimetry
Scanning laser polarimetry is an imaging technology that is utilized to measure
peripapillary RNFL thickness
based on the principle of birefringence
main birefringent intraocular tissues are the cornea, lens and the retina
In the retina, the parallel arrangement of the microtubules in retinal ganglion cell
axons causes a change in the polarization of light passing through them.
The change in the polarization of light is called retardation
The retardation value is proportionate to the thickness of the RNFL
39. Light polarized in one plane travels
more slowly through the birefringent
RNFL than light polarized
perpendicularly to it.
This difference in speed causes a
phase shift (retardation) between the
perpendicular light beams.
40. VCC stands for variable corneal
compensator, which was created to
account for the variable corneal
birefringence in patients
Uses the birefringence of Henle’s
layer in the macula as a control for
measurement of corneal
birefringence
43. A.Patients information
Patient data and quality score: the patient’s name,
date of birth, gender and ethnicity are reported. An
ideal quality score is from 7 to 10
44. B.FUNDUS IMAGE
The fundus image is useful to check for image quality:
Every image has a Q score representing the overall quality of the scan
The Q ranges from 1-10, with values 8-10 representing acceptable quality.
This score is based on a number of factors including :
-Well focused,
- Evenly illuminated,
- Optic disc is well centered,
- Ellipse is properly placed around the ONH.
45. The Operator Centers The Ellipse Over The
ONH In This Image
The Ellipse Size Is Defaulted To A Small
Setting But Manipulating The Calculation
Circle Can Change The Size Of The Ellipse
The Calculation Circle Is The Area Found
Between The Two Concentric Circles, Which
Measure The Temporal-superiornasal-inferior-
temporal (TSNIT) And Nerve Fiber Indicator
(NFI) Parameters
By Resizing The Calculation Circle And
Ellipse, The Operator Is Able To Measure
Beyond A Large Peripapillary Atrophy Area
46.
47. C.RNFL thickness map
The thickness map shows the RNFL thickness in a color-coded format from blue to
red.
Hot colors like red and yellow mean high retardation or thicker RNFL
cool colors like blue and green mean low retardation / thinner RNFL
A healthy eye has yellow and red colors in the superior and inferior regions
representing thick RNFL regions and blue and green areas nasally and temporally
representing thinner RNFL areas.
In glaucoma, RNFL loss will result in a more uniform blue appearance
48.
49. D.Deviation maps
The deviation map reveals the location and magnitude of RNFL defects
over the entire thickness map
RNFL thickness of patient is compared to the age-matched normative
database
Dark blue squares RNFL thickness is below the 5th percentile of the
normative database
Light blue squares deviation below the 2% level
Yellow deviation below 1%
Red deviation below 0.05%.
50.
51. E.TSNIT map
TSNIT stands for Temporal-Superior-Nasal-Inferior-Temporal
TSNIT displays the RNFL thickness values along the calculation circle
In a normal eye the TSNIT plot follows the typical ‘double hump’ pattern,
with thick RNFL measures superiorly and inferiorly and thin RNFL values
nasally and temporally
In a healthy eye, the TSNIT curve will fall within the shaded area which
represents the 95% normal range for that age
When there is RNFL loss, the TSNIT curve will fall below this shaded area,
especially in the superior and inferior regions
52. In the center of the printout at the bottom, the TSNIT graphs for both eyes are
displayed together.
healthy eye there is good symmetry between the TSNIT graphs of the two eyes
and the two curves will overlap
in glaucoma, one eye often has more advanced RNFL loss and therefore the two
curves will have less overlap
53. F.Parameters table
The TSNIT parameters are summary measures
based on RNFL thickness values within the
calculation circle
Normal parameter values are displayed in green
abnormal values are color-coded based on their
probability of normality.colours are similar to
deviation maps.
54. TSNIT Average: The average RNFL thickness around the entire calculation circle
Superior Average: The average RNFL thickness in the superior 120° region of the
calculation circle
Inferior Average: The average RNFL thickness in the inferior 120° region of the
calculation circle
TSNIT SD
Inter-eye Symmetry Values range from –1 to 1, Normal eyes have good symmetry with
values around 0.9
55. The Nerve Fiber Indicator (NFI)
Global measure based on the entire RNFL thickness map
Calculated using an advanced form of neural network, called
a Support Vector Machine (SVM)
Not colour coded
Output values range from 1 –100
1-30 -> low likelihood of glaucoma
31-50 -> glaucoma suspect
51+ -> high likelihood of glaucoma
Clinical research has shown that the NFI is
the best parameter for discriminating normal
from glaucoma
56. Serial Analysis
Detecting RNFL Change Over Time
Serial Analysis can compare up
to four exams
The Deviation from Reference
Map displays the RNFL
difference, pixel by pixel, of the
followup exam compared to the
baseline exam
57. LIMITATIONS
Eyes with macular pathology may show wrong RNFL values due to
improper anterior segment birefringence (ASB) compensation at macula
ASB may get altered after refractive surgery,so do fresh macular scan to
compensate for changes
Large disc,large areas of PPA,affect RNFL,so use large scan circle
60. CONCLUSIONS
The ability to detect early glaucomatous structural changes has great potential
value in delaying and avoiding progression of the disease
the most difficult optic discs to interpret in terms of glaucomatous changes–
specifically highly myopic and tilted optic discs – are also those discs which
optic nerve imaging devices have the greatest limitations in discriminating
abnormality from pathology
should not be regarded as replacing the skilled ophthalmologist’s capacity to
evaluate all aspects of the patient’s diagnosis.
but they can definitely aid in the complicated decision-making process
62. Topographic Change Analysis (TCA)
Statistically-based progression algorithm that accurately detects structural
change over time by comparing variability between examinations and
providing a statistical indicator of change.
Aligns subsequent images with the baseline examination, providing a
point-by-point analysis of the optic disc and peripapillary RNFL
Editor's Notes
This laser, which is not powerful enough to harm the eye, is first focused on the surface of the optic nerve and captures that image. Then it is focused on the layer just below the surface and captures that image. The HRT continues to take images of deeper and deeper layers until the desired depth has been reached. Finally, the instrument takes all these pictures of the layers and puts them together to form a 3-dimentional image of the entire optic nerve.
Any ONH that is determined to be “outside normal limits” is not necessarily glaucomatous but is statistically outside the normal ranges
for the group of eyes in the normative database. The decision as to whether “outside normal limits” represents “glaucoma” is a clinical judgment made by considering all
clinical information together.
MRA makes use of the relationship between log neuroretinal rim area and optic disc area to define the normal ranges.
Figure 3.2 illustrates the linear regression line between log neuroretinal rim area and optic disc area (marked “50%”). This is the “average” or “predicted” relationship between log neuroretinal rim area and optic disc area. The lower three lines represent the lower 95.0%, 99.0%, and 99.9% prediction intervals for the same relationship. Thus, for the 95.0% prediction interval, 95.0% of normal eyes would be expected to have a neuroretinal rim area above that interval line. The same reasoning applies to the 99.0% and 99.9% prediction intervals. These intervals are calculated for the ONH as a whole and for each of the six predefined sectors.
The prediction intervals for neuroretinal rim areashould be regarded in the same way as theprobability smbols for abnormality in the reportsfrom automated perimeters. The closer the top ofthe green bar gets to the lower prediction intervals,the greater the probability that the rim area isabnormal.The MRA Report given in the HRTIIsoftwareenables a visual inspection of where the neuroretinal rim area lies in relation to thenormal ranges .