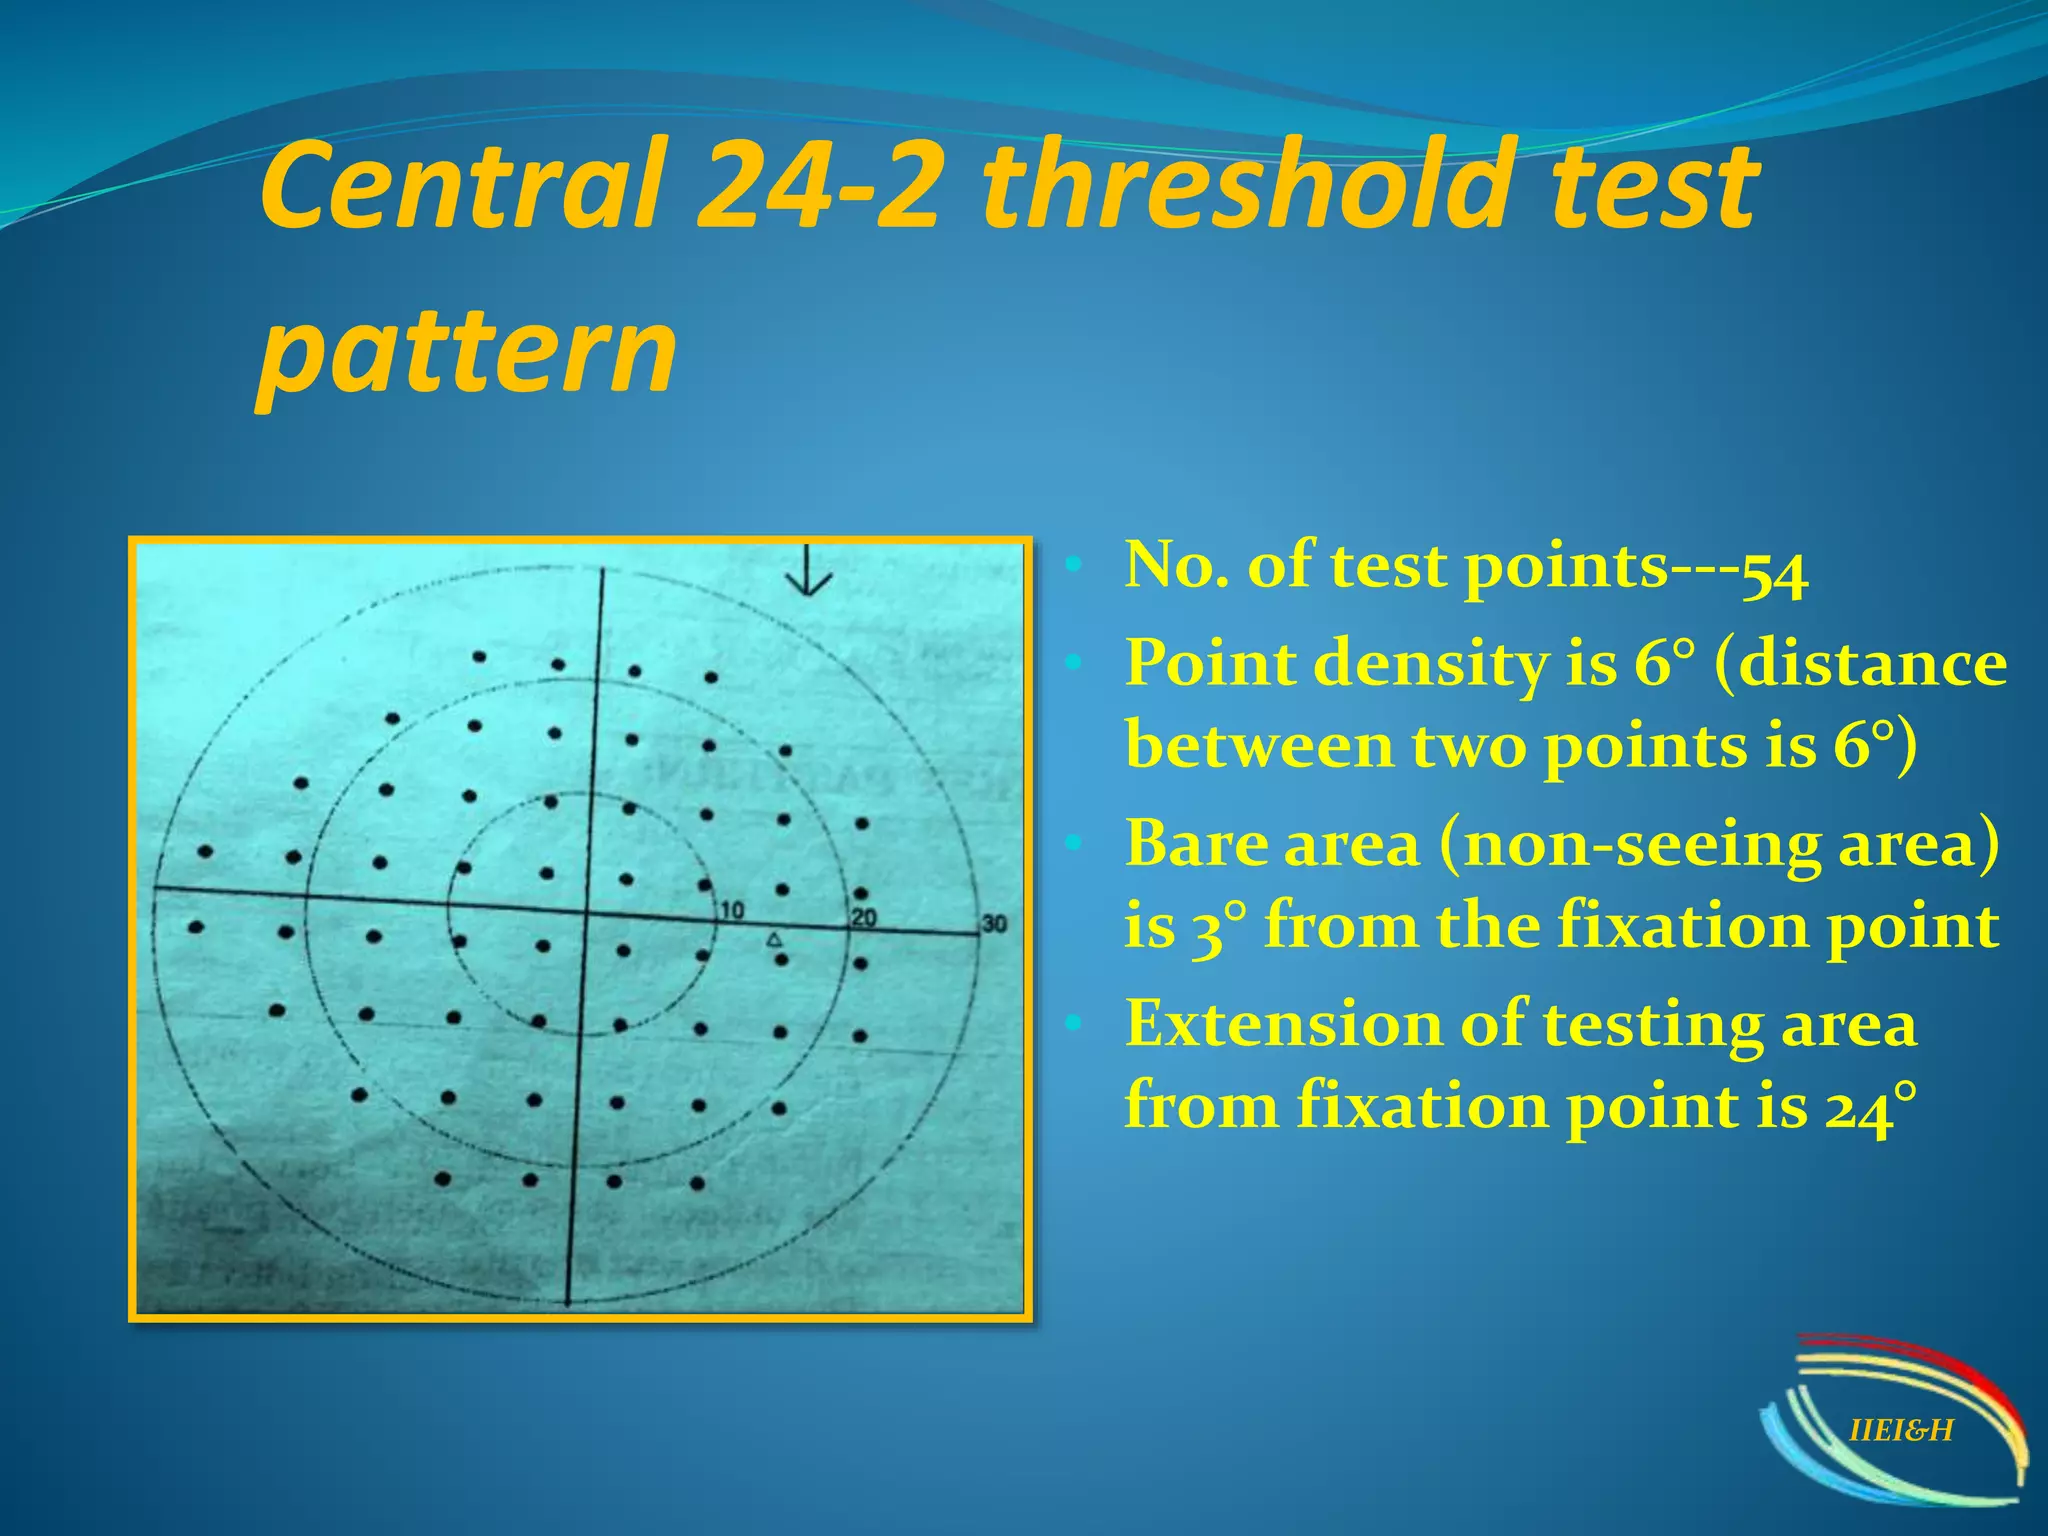
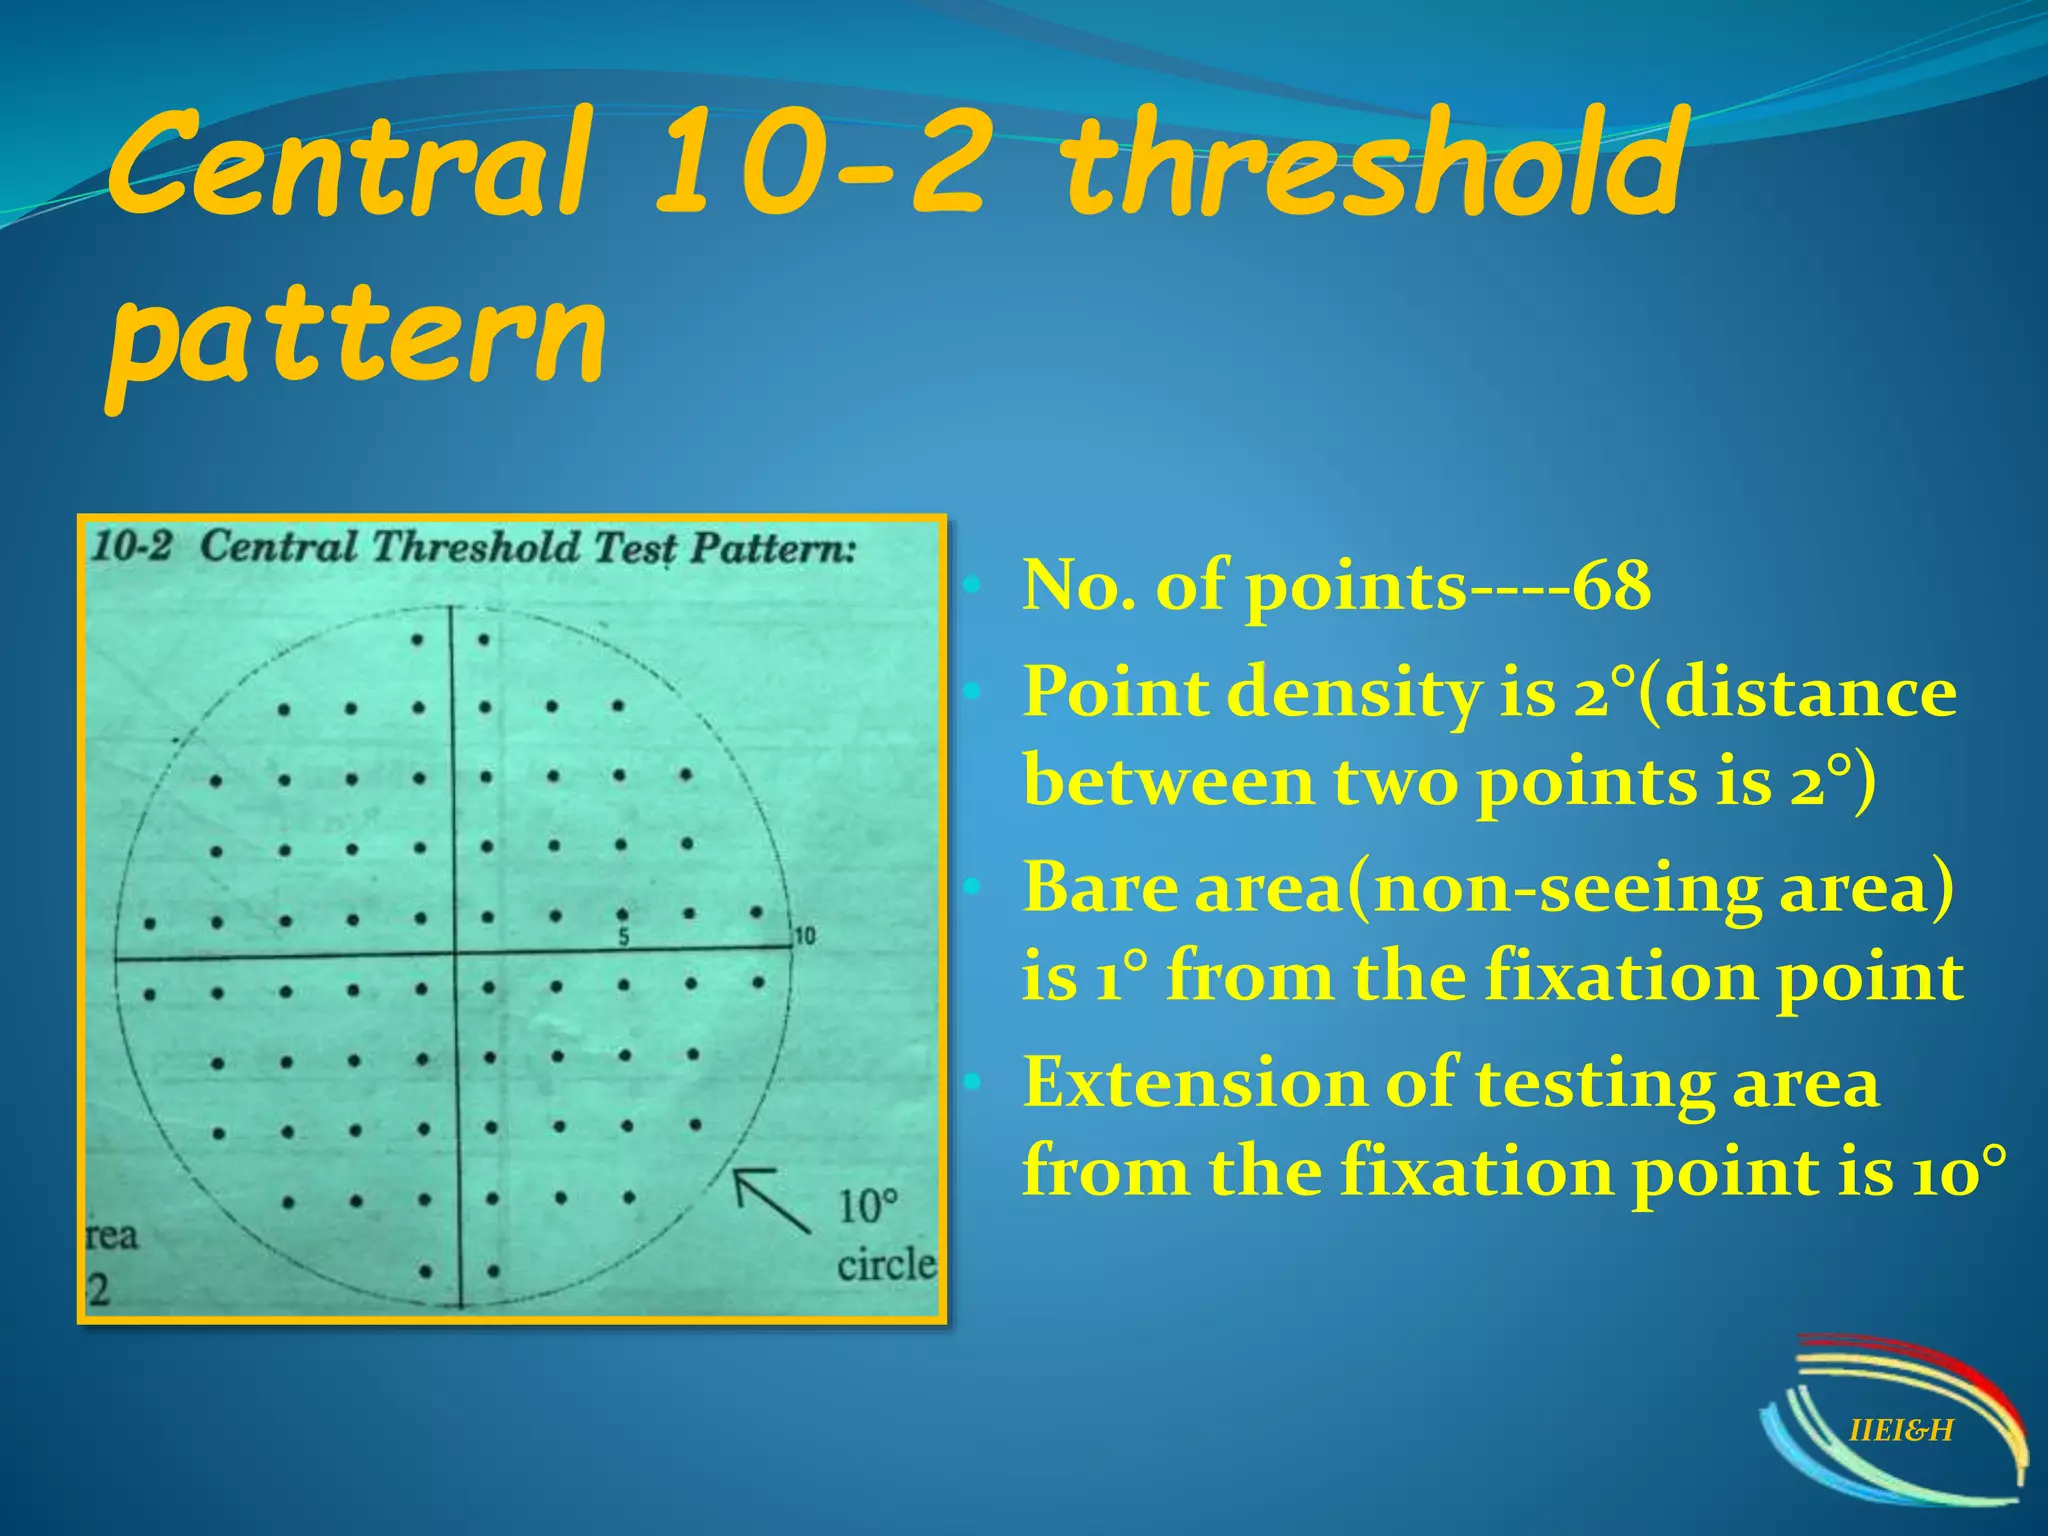
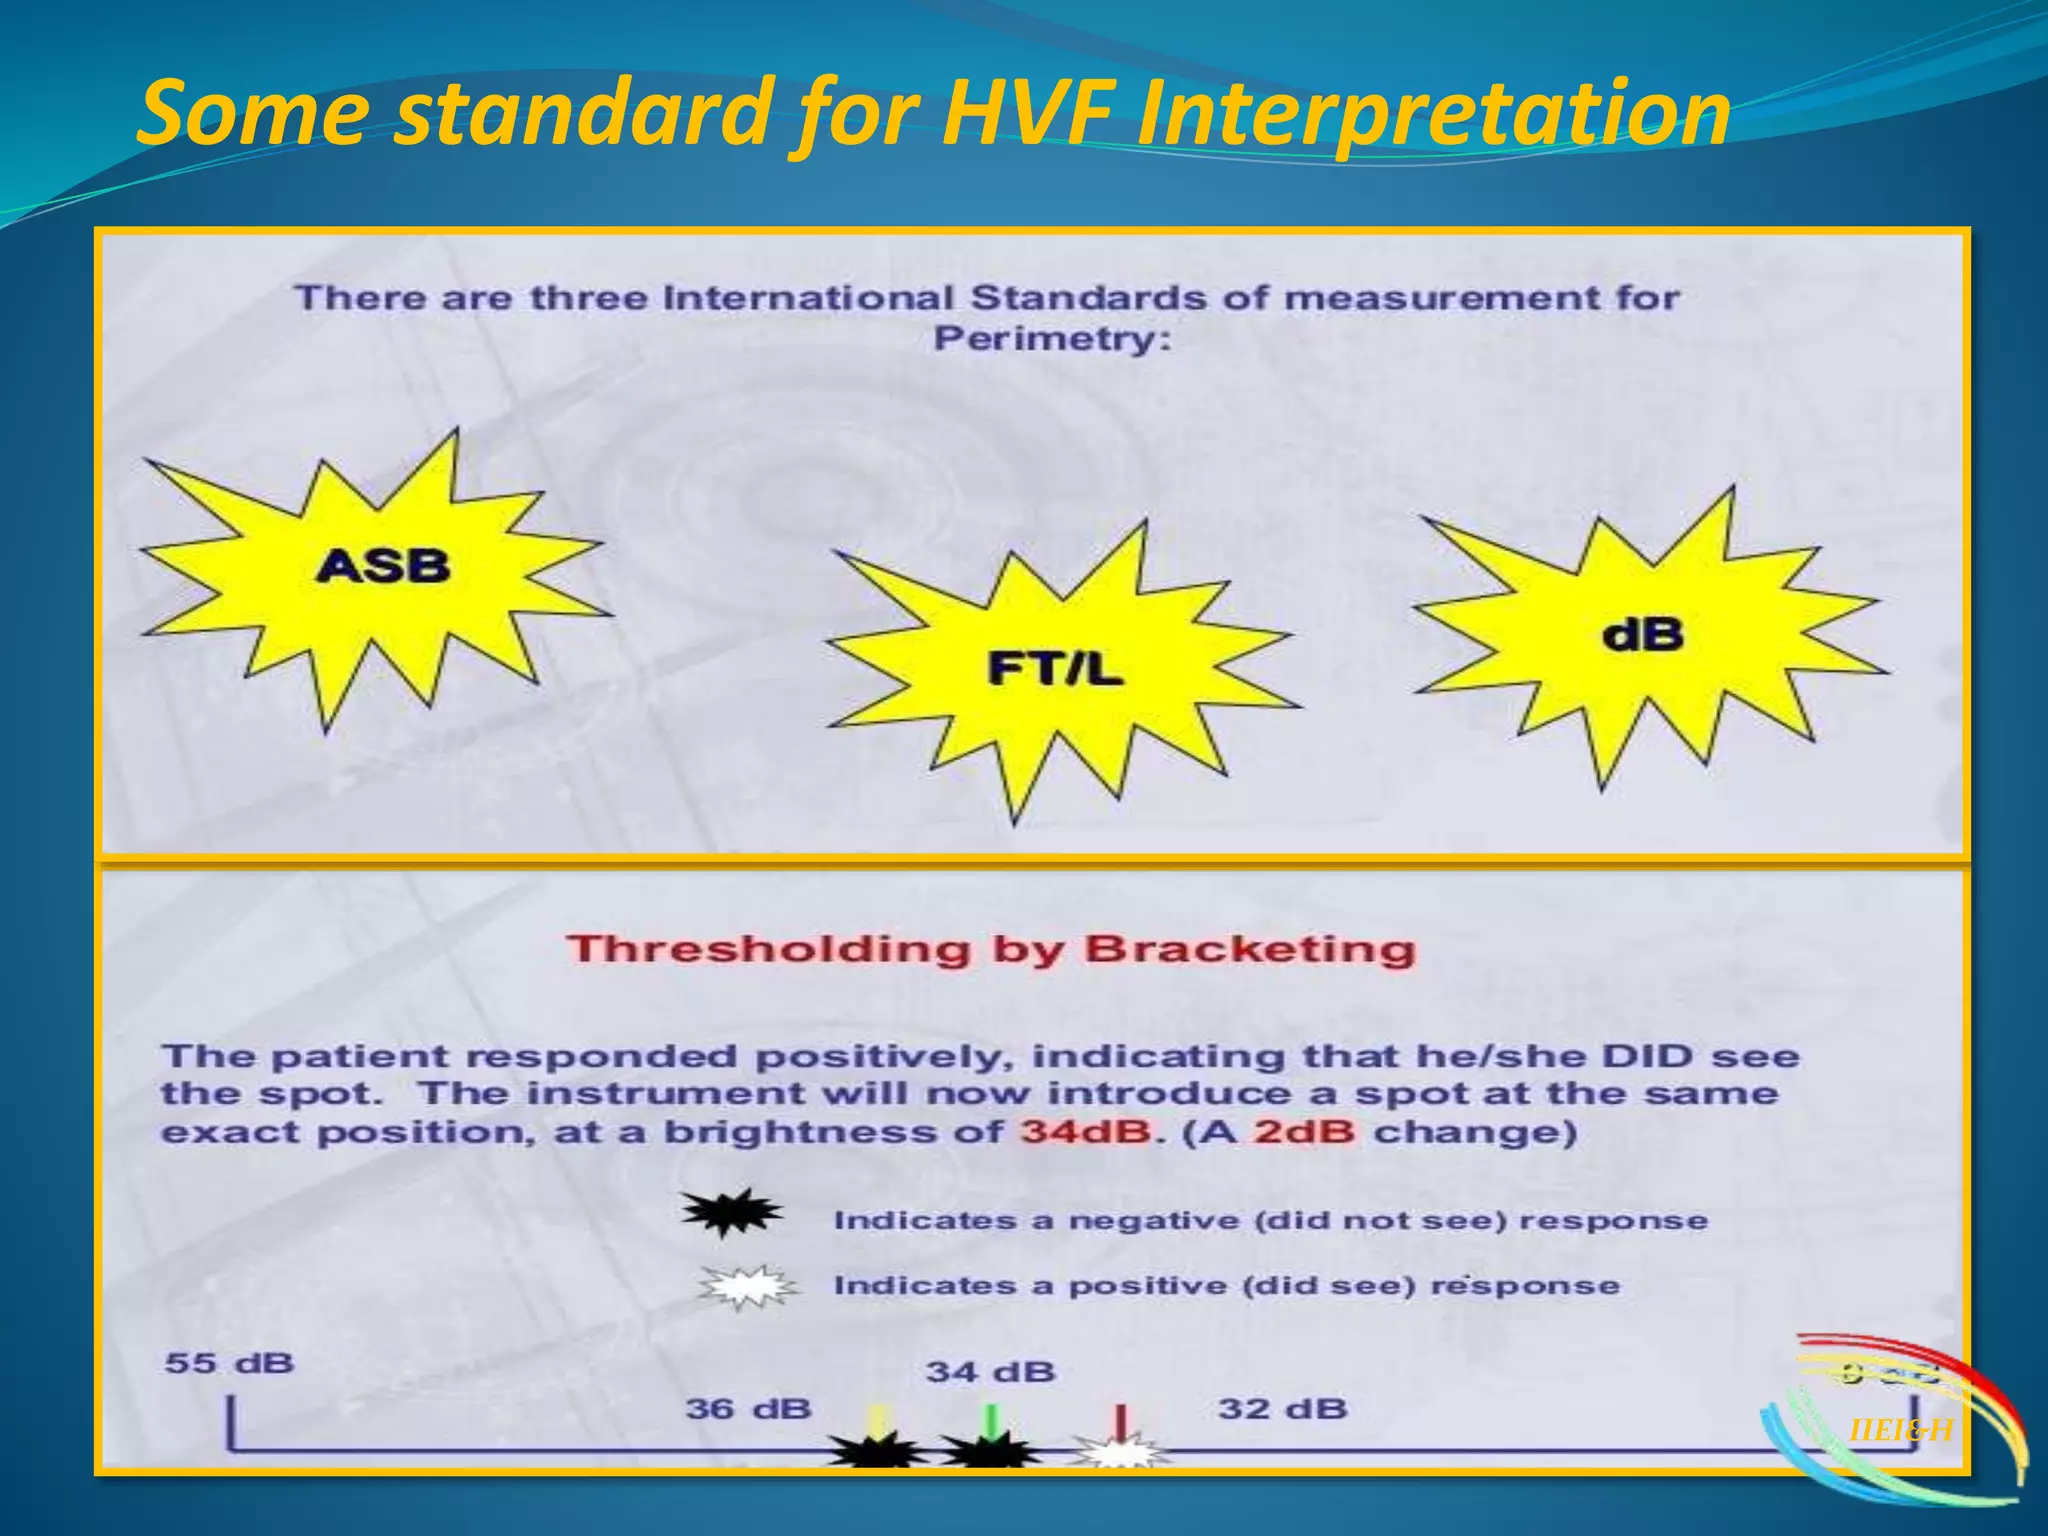
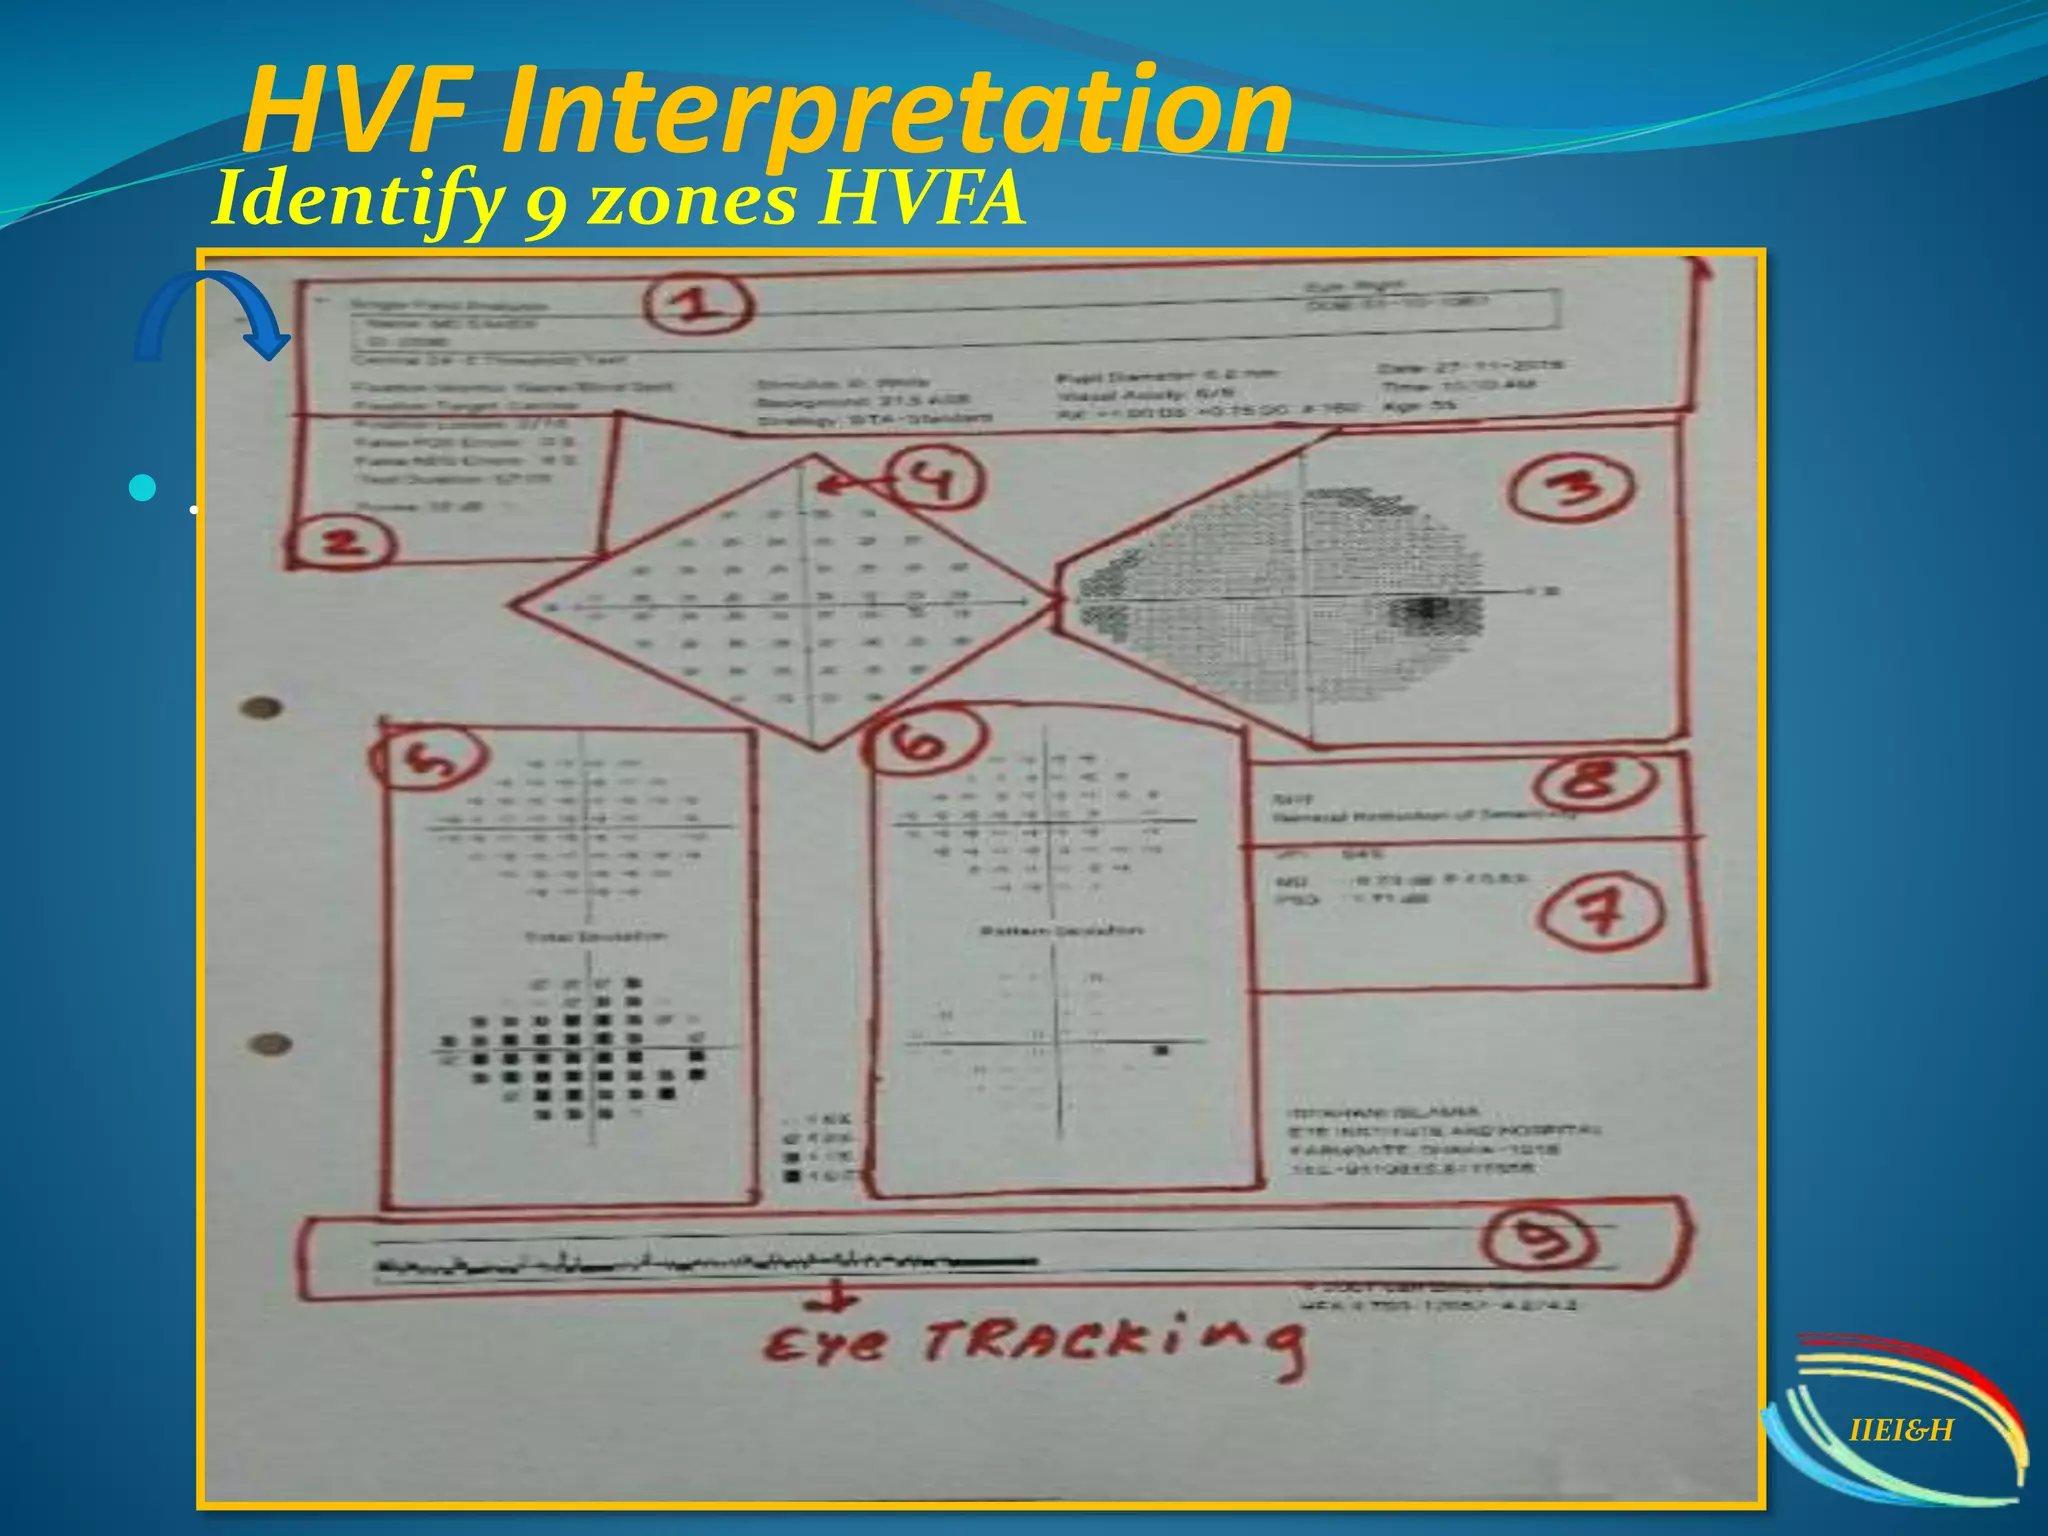
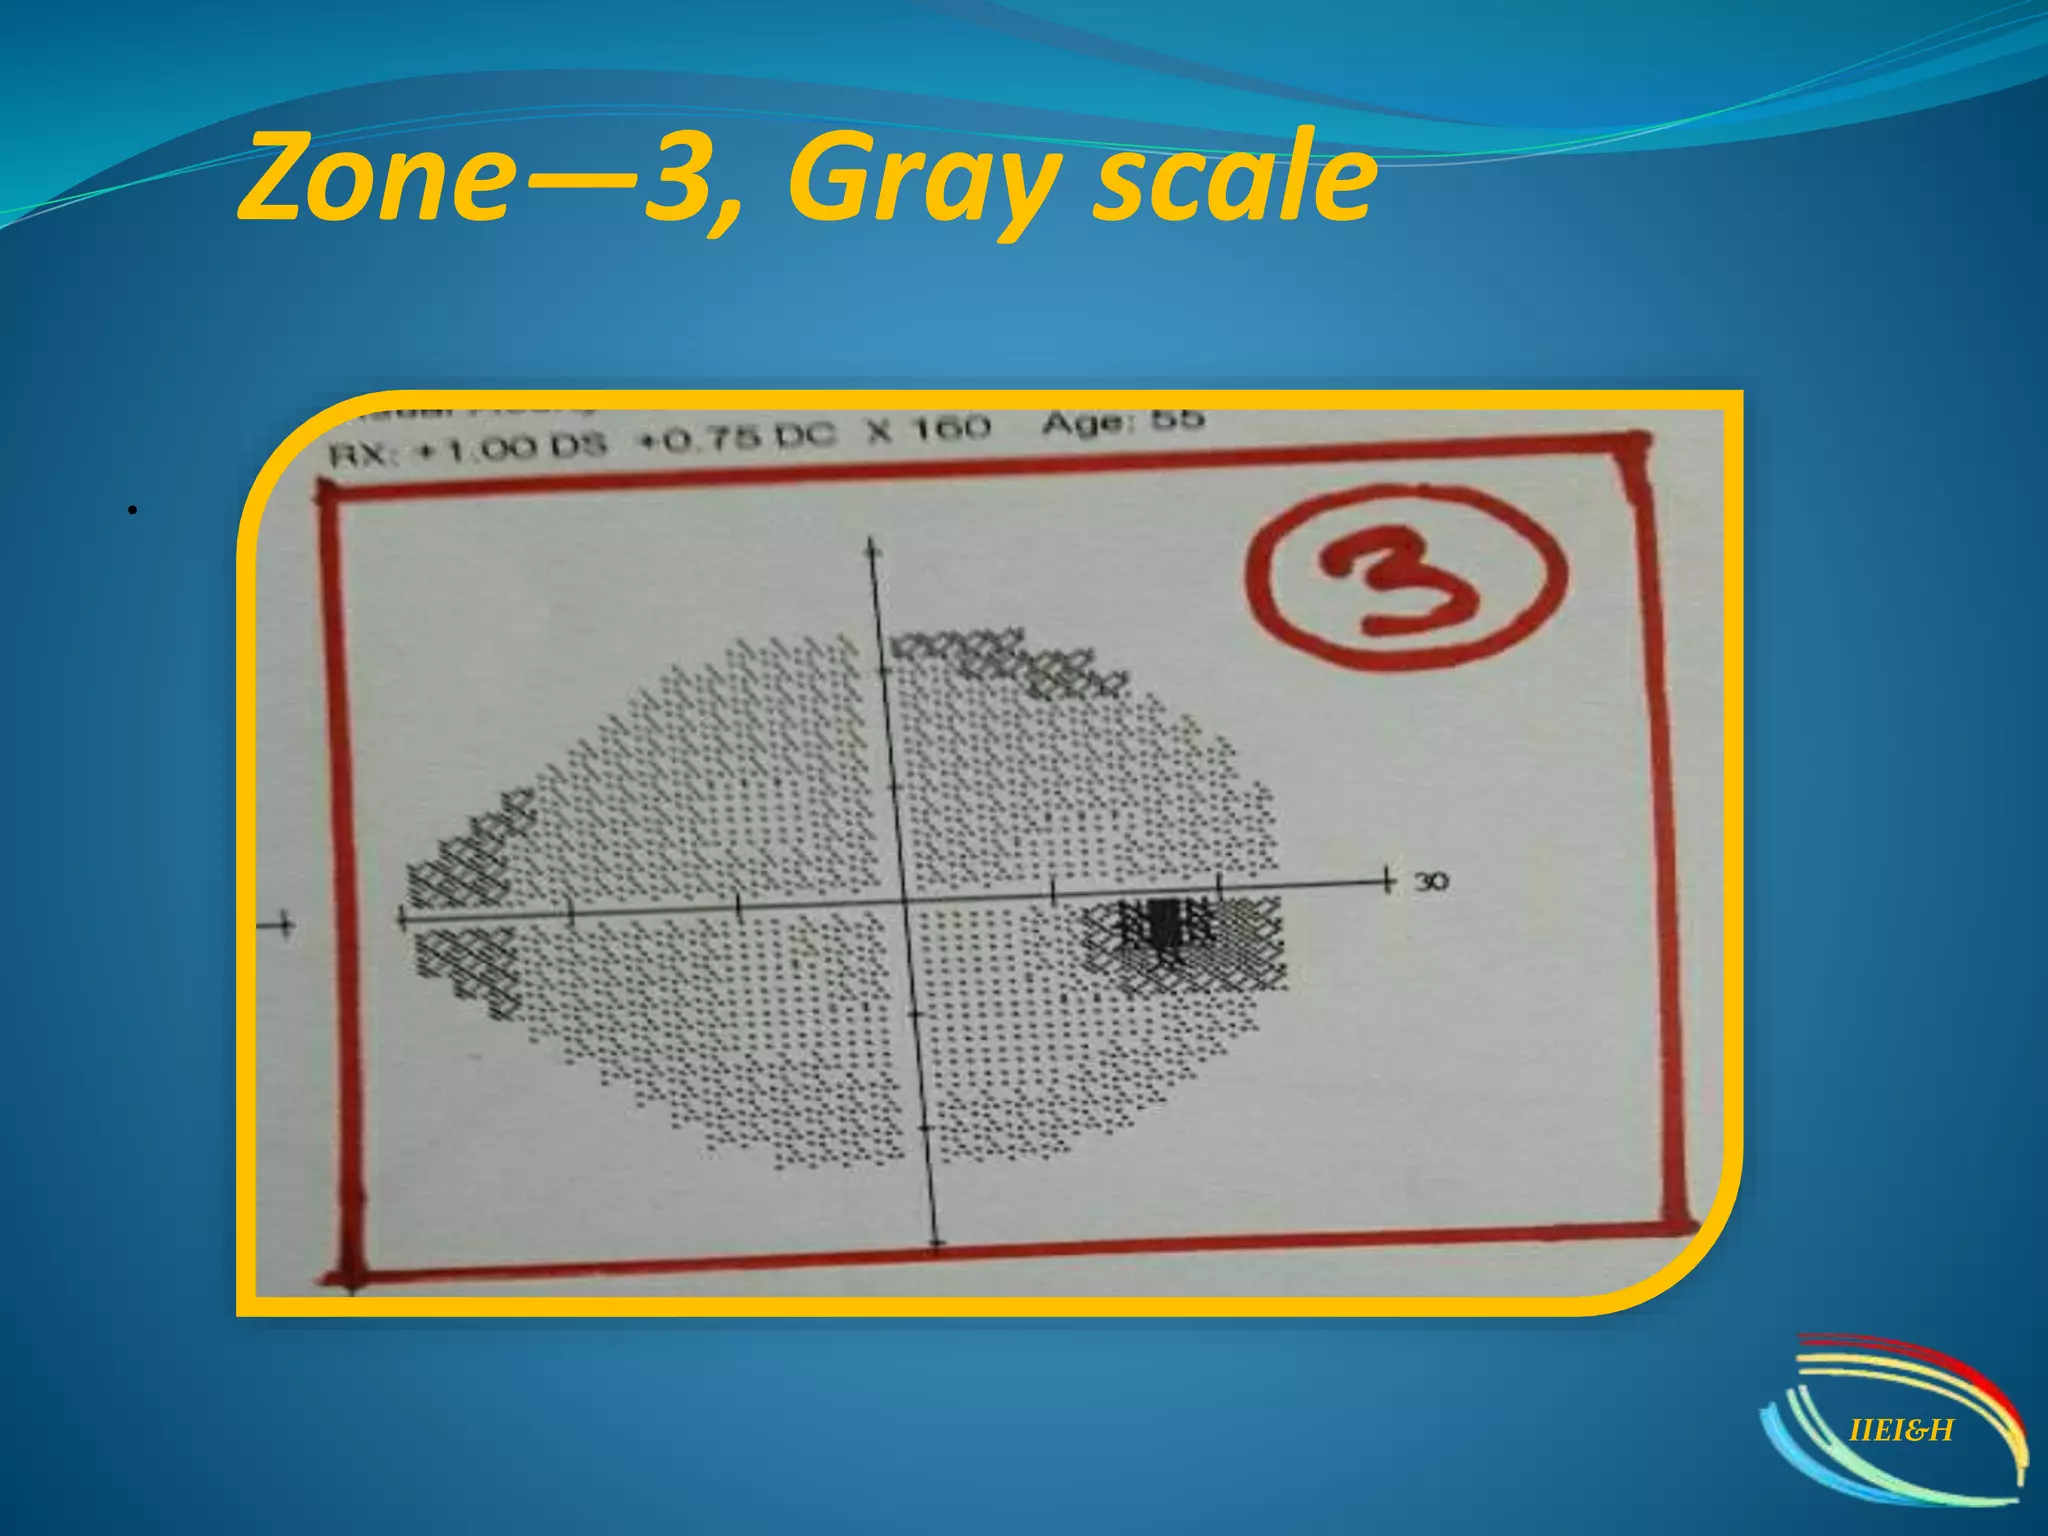
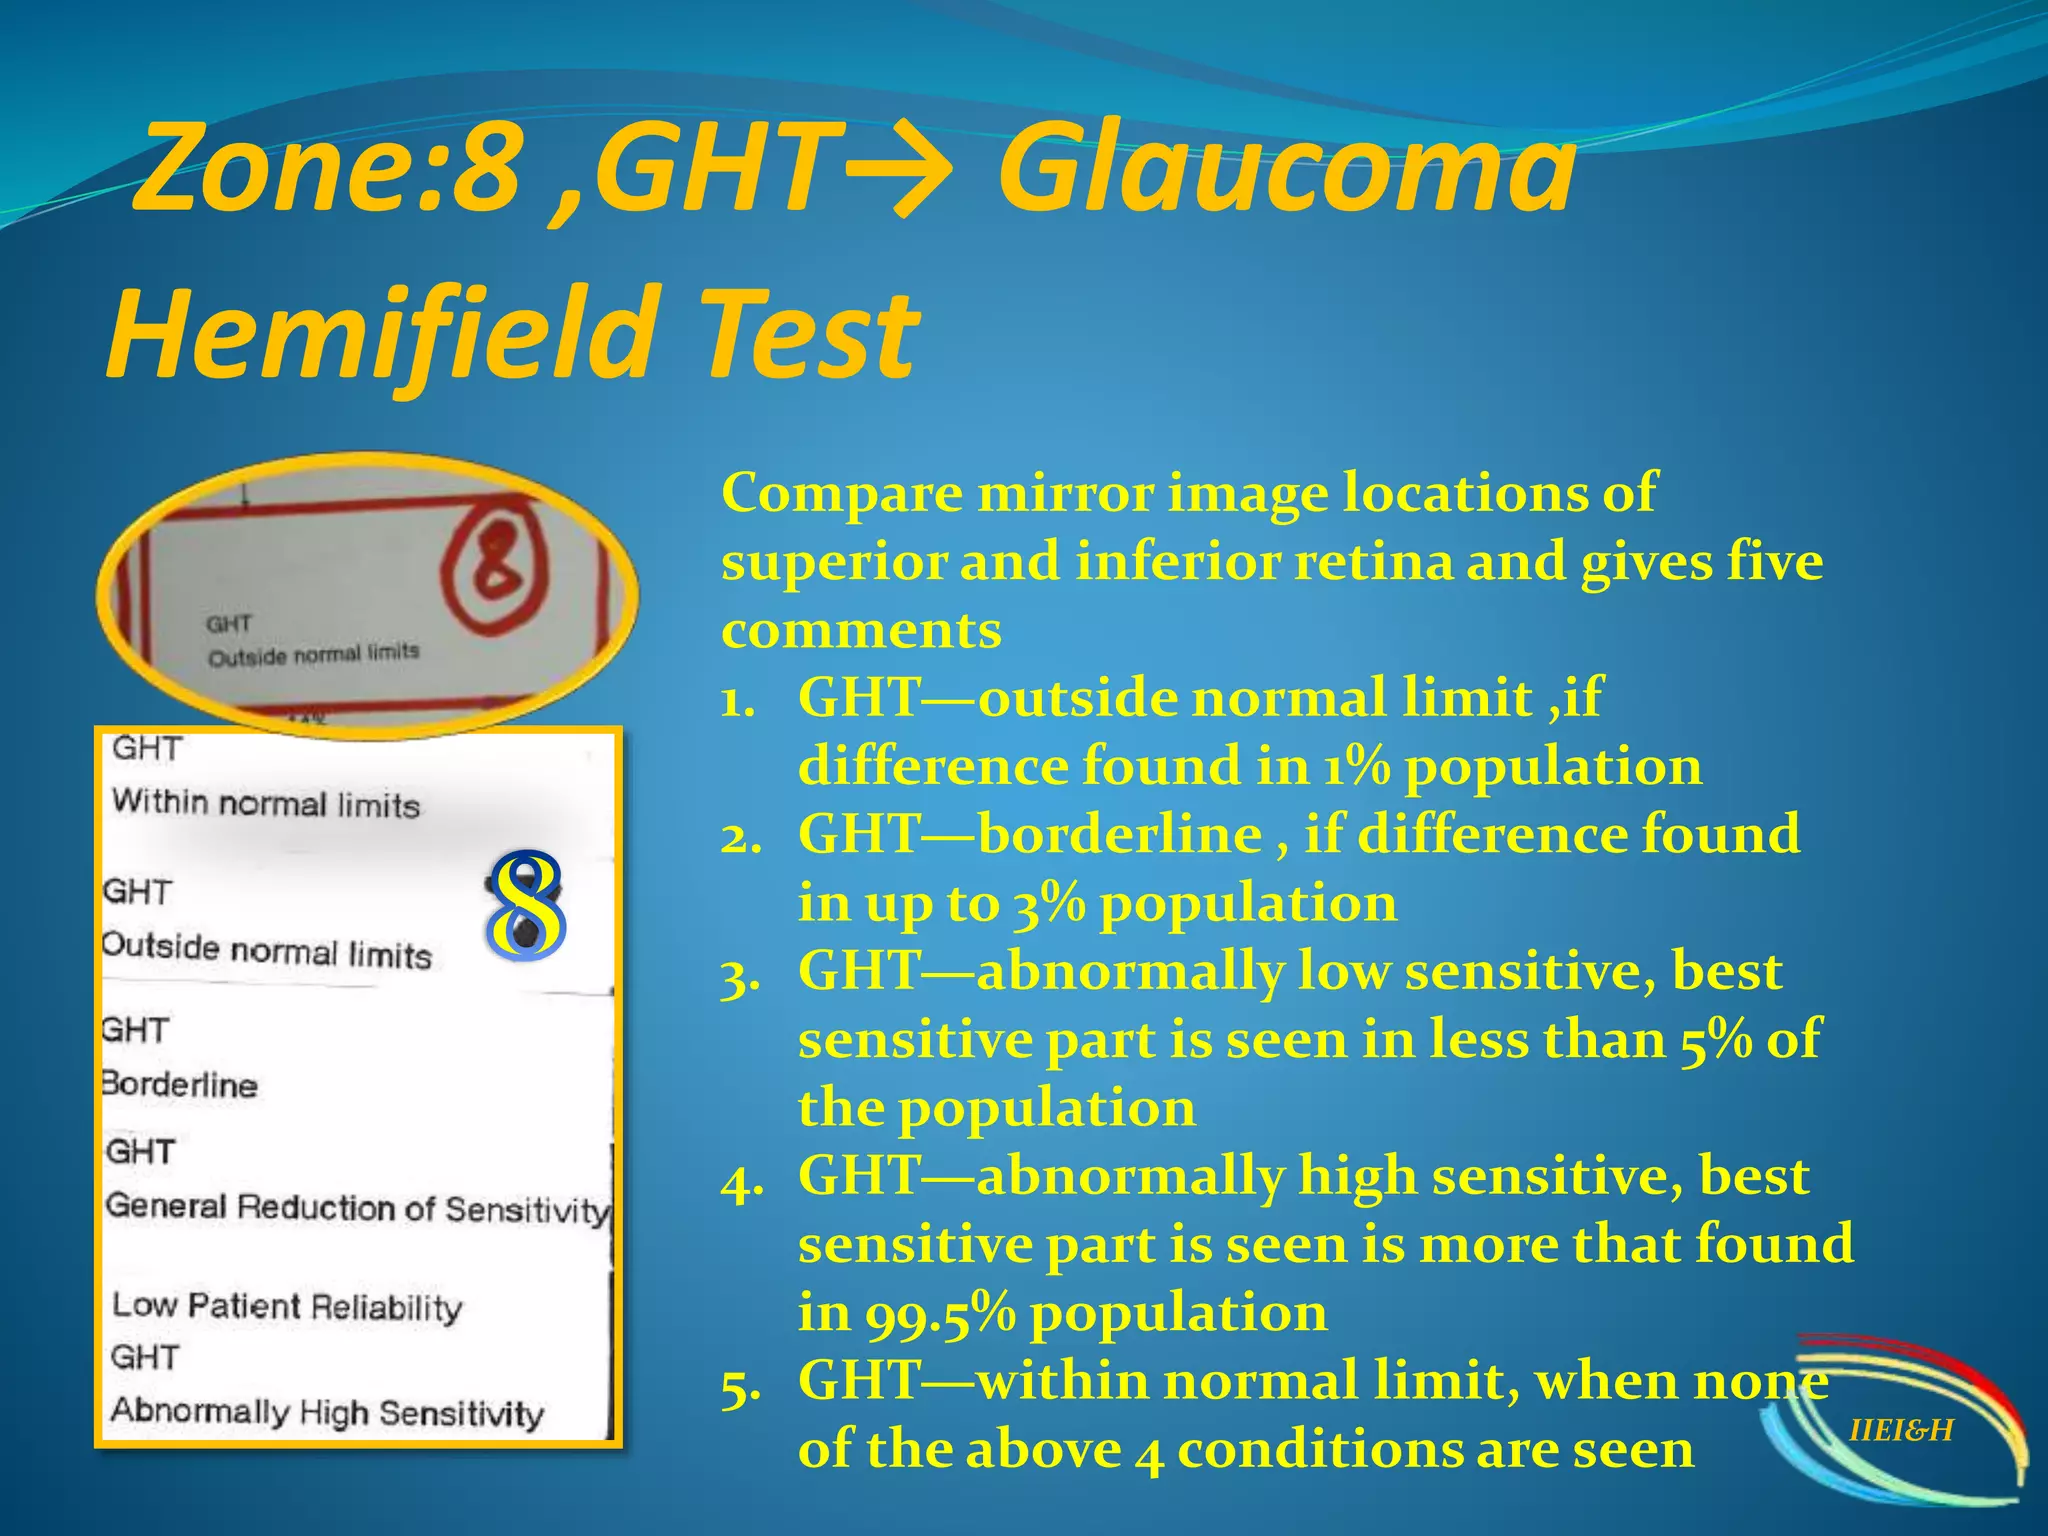
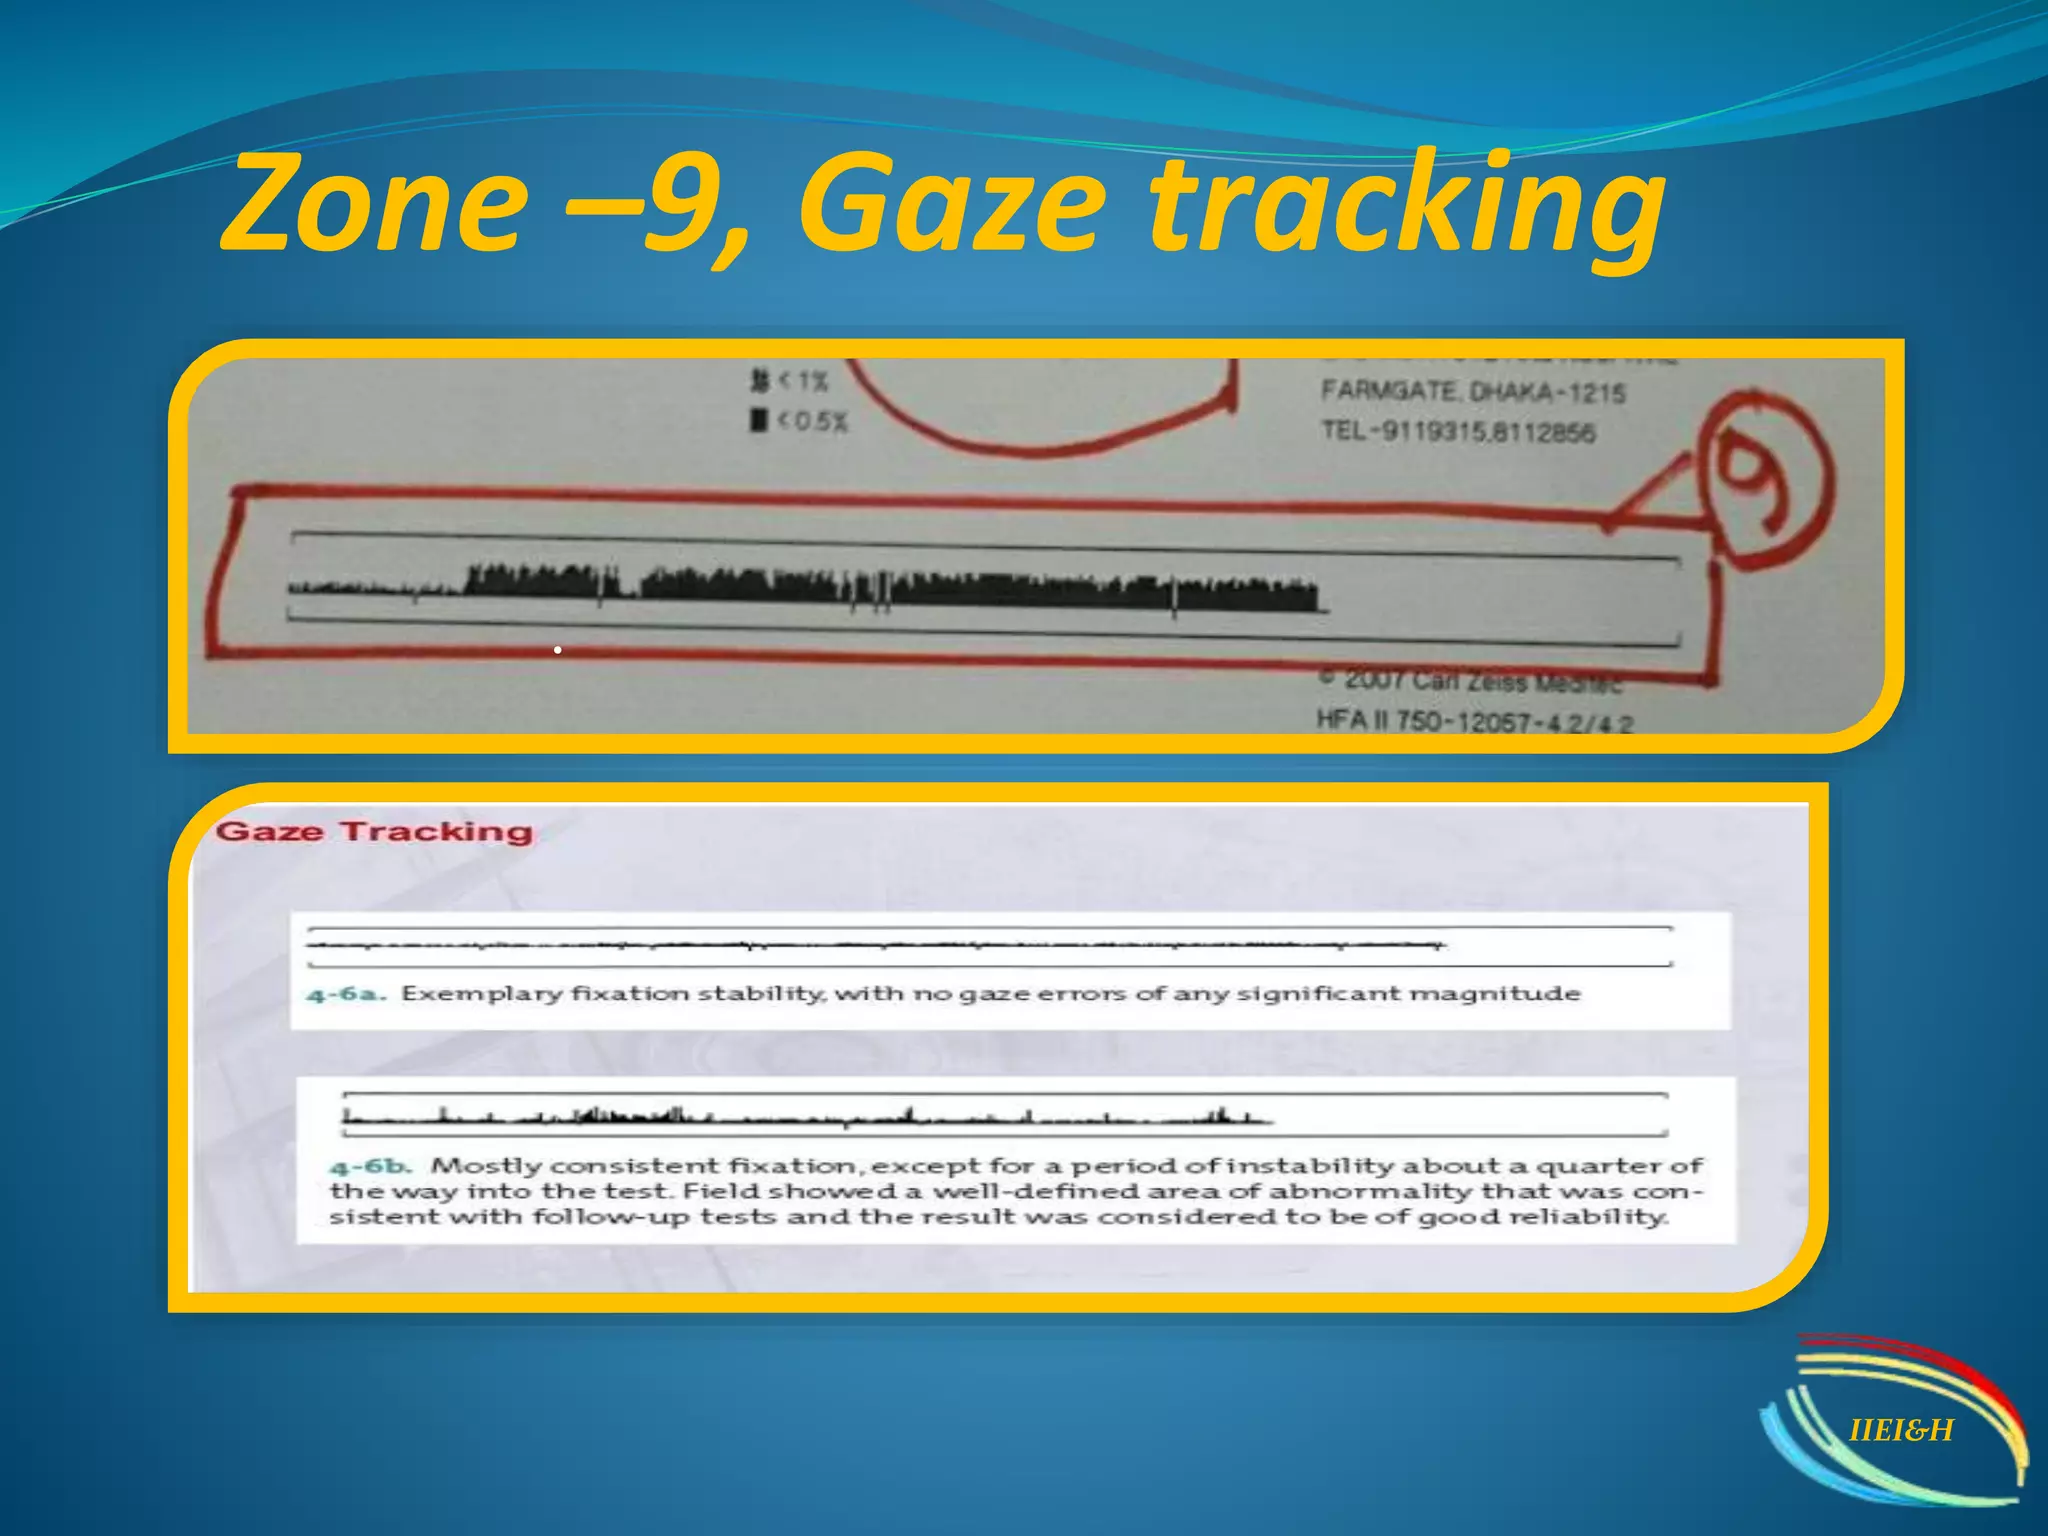
Perimetry
Md.Azizul Islam
Junior Optometrist
Ispahani Islamia Eye Institute & Hospital
IIEI&H
Aims of today,s topic
Will be able….
To know about various type of perimetry
 To identify field defect
 To recognize that field defect is due to
glaucoma or neurological lesion
To know that field defect is progressive or not
Interpretation of HVFA
 To know Common perimetric errors
IIEI&H
Define Visual Field
 The field of vision is defined as the area that is
perceived simultaneously by a fixating eye.
 The limits of the normal field of vision are 60° into
the superior field, 75° into the inferior field, 110°
temporally, and 60° nasally.
 Traquair, in his classic thesis, described an island
of vision in the sea of darkness . The island
represents the perceived field of vision, and the
sea of darkness is the surrounding areas that are
not seen.
IIEI&H
 60°superiorly .
 60°nasally .
 75°inferiorly .
 100° temporally
•The macula corresponds
to the central 13 degrees
of the visual field;
•The fovea to the central
3 degrees.
IIEI&H
Hill of vision
Types of perimetry
 Kinetic…stimulus moves
(Confrontation, lister ,Bjerrumr,s screen, Goldmann)
 Static …stimulus does not moves
(HVFA, OCTOPUS )
IIEI&H
In kinetic perimetry, a stimulus is moved from a non-seeing
(subthreshold) area to a seeing (suprathreshold) area, and the location
where the object is first seen is recorded. The speed the stimulus is
moved should be standardized, typically at 2-4 degrees per second.
In static perimetry, stationary stimuli are presented at defined points
in the visual field. Stimuli presented for longer durations of time may
be seen better as a result of temporal summation of information,
though limited additional benefit is derived beyond times over 1/10th
of a second.
Difference between kinetic and static
1.VFD detect earlier with
20% defect
1. Detect when 40% damage
2. Area fixed but stimulus
but varies in intensity
2. Intensity is fixed but stimulus
moves from non-seeing to seeing
area
3. Three dimensional 3. Two dimensional
4. Computerized 4. Not computerized
5. Threshold type 5. Non threshold type
6. Less error 6. More error
7. Both glaucoma and
neurological
7. Good for neurological
IIEI&H
Humphrey Visual Field
 24-2 White on White is the standard
 Can be full threshold, SITA standard
or SITA Fast. SITA (Swedish Interactive
Threshold Algorithm)
 SWAP (Short Wavelength Automated
Perimetry) and 30-2 less useful
 10-2 For advanced Glaucoma
 Not directly comparable with Octopus
or Medmont (different algorithms)!
IIEI&H
Humphrey visual field test,
Classification
Two types– on the basis of strategies
1.Threshold test—using threshold stimulus for
diagnosis of glaucoma and neurological
lesions
2. Screening test– using suprathreshold stimulus
for detection of glaucoma
IIEI&H
Threshold test—is of
three types
a . Central tests b. Peripheral tests c. Special tests
Central 30-2 Peripheral 60-4 Neurological - 20
Central 24-2 Nasal step Neurological–30
Central 10- 2
Macular program

IIEI&H
Central 30-2
 Number of test points:76
 Density :6 degree
 Only 3 degree bare area is
left surrounding the
fixation spot
IIEI&H
Central 24-2 threshold test
pattern
• No. of test points---54
• Point density is 6° (distance
between two points is 6°)
• Bare area (non-seeing area)
is 3° from the fixation point
• Extension of testing area
from fixation point is 24°
IIEI&H
Central 10-2 threshold
pattern
• No. of points----68
• Point density is 2°(distance
between two points is 2°)
• Bare area(non-seeing area)
is 1° from the fixation point
• Extension of testing area
from the fixation point is 10°
IIEI&H
Macular program
•No. of teat point is 16
•Point density is
2°(distance between two
points is 2°)
•Bare area (non-seeing
area) is 1° from the fixation
point
•Extension of testing area
from the fixation point is 5°
IIEI&H
Some standard for HVF Interpretation
IIEI&H
CONTD…
IIEI&H
HVF test printout (single field)
interpretation…..
 We can divide the printout into 9 zones
 Zone—1, Patients data and test data
 Zone—2, Foveal threshold and reliable indices
 Zone—3, Gray scale
 Zone—4, Patients raw data
 Zone—5, Total deviation plot
 Zone– 6, Pattern deviation plot
 Zone—7, Global indices
 Zone—8, Glaucoma Hemifield Test(GHT)
 Zone—9, Eye tracking(±)
IIEI&H
HVF Interpretation
 .
IIEI&H
Identify 9 zones HVFA
Zone—1, Patients data and test
data……
.
IIEI&H
Zone—2 ,Foveal threshold and
reliable indices…
N
N
N

IIEI&H
Zone—3, Gray scale
.
IIEI&H
Zone :4 Numerical display
.
IIEI&H
Zone –5, total deviation plot ,
has two components
 A. Total deviation
numerical
plot(TDNP)
 B. Total
deviation
probability
plot(TDPP)
IIEI&H
Zone –6, pattern deviation plot ,
has two components
 A.Pattern
deviation
numerical
plot(PDNP)
 B. Pattern
deviation
probability
plot(PDPP)
IIEI&H
Zone—7, Global indices
MD—mean deviation
• Indicate average severity
of the field loss Expressed
in decibel(dB) value
PSD—Pattern Standard
Deviation
• This is a measure of focal
loss or variability within
the field ,if score is high,
damage is more
IIEI&H
Zone:8 ,GHT→ Glaucoma
Hemifield Test
Compare mirror image locations of
superior and inferior retina and gives five
comments
1. GHT—outside normal limit ,if
difference found in 1% population
2. GHT—borderline , if difference found
in up to 3% population
3. GHT—abnormally low sensitive, best
sensitive part is seen in less than 5% of
the population
4. GHT—abnormally high sensitive, best
sensitive part is seen is more that found
in 99.5% population
5. GHT—within normal limit, when none
of the above 4 conditions are seen IIEI&H
Zone –9, Gaze tracking
.
IIEI&H
Visual field defects
 Generalized depression→ both central
and peripheral fields are depressed as in
cataract
 Peripheral depression → only peripheral
field is depressed as in RP
 Temporal contraction → only temporal
field is depressed as in aging people
(Depression means reduced sensitivity of
the retina)
 Scotomas → Non-seeing area of the visual
field . Central scotoma , Peripheral scotoma
Types:Absolute,Relative,Positive,Negative.
IIEI&H
INTERPRETATION
Factors for consistency in testing
 Best Refractive correction used. Contact lens to
avoid rim artifacts.
 Pupil Diameter – at least 3.5 mm in size.
 Visual Acuity
 Date & Time of testing
 Age-For comparison with normative data
 Short term fluctuation-Fluctuation occurring
within the test. Should be <3dB.
IIEI&H
INTERPRETATION…contd.
Reliability of patient
Fatigue, anxiety and learning effect
Fixation loss – should be less than 20%
False positive and negative response
should be less than 33%.
IIEI&H
INTERPRETATION…contd.
 Progression of defect
 Test parameters comparable
 Defect - increased in size / depth
 >= 7 dB increase in depth of existing defect
 >= 9 dB depression adj. to abnormal point
 >= 11 dB depression of a normal point ( New
Defect )
 Box plot change analysis
 Overview
 Glaucoma change probability analysis
IIEI&H
Several types of errors can lead to inaccurate results:
Incorrect patient name.
Incorrect patient age. As threshold values are compared to age-
adjusted normal values, incorrect age entry will lead to
comparisons with the wrong set of normal values.
Inappropriate correction of refractive error. Failure to properly
correct for refractive error will cause stimuli to become visually
defocused,
Lens rim artifacts. Thick rims for correcting refractive error, or
inappropriate head positioning which causes the lens rim to block
peripheral stimuli can cause artifactual depression of the
peripheral points. Points are typically severely affected (often
with threshold sensitivities of 0 dB), and often show an abrupt
drop-off from directly adjacent points.
Common perimetric errors
IIEI&H
Cloverleaf fields. This pattern of visual field defects
reflects poor visual attention and/or malingering. Field
results typically show high rates of false negative responses.
Miotic pupils or Cataracts. Ocular features which allow less
light to reach the retina can cause diffuse depression of the
visual field, along with statistically significant decreases in
mean deviation. A small pupil may simulate a glaucomatous
visual field defect by generalized depression because of
miosis or exacerbate an already constricted field, giving a
false impression of progression of glaucoma.
 In cases with concomitant cataract, attention should be
paid to the pattern deviation plot as it adjusts for
generalized depression caused by the cataract.
Common perimetric errors
IIEI&H
Take Home Messages
 Not every visual field
defect is glaucoma!
 Structural change
often proceeds
functional change
 Progression on visual
fields over time
important.
 24-2 HVF the Gold
Standard
IIEI&H
References
 Basic perimetry carl zeiss 2007 .
 Essentials of Ophthalmology , Basak 5th Edition.
 AAO, Basic and Clinical Science Course. Section 10: Glaucoma,
2015-2016.
 A AO, Glaucoma: Standard automated static perimetry Practicing
Ophthalmologists Learning System, 2017 - 2019 San Francisco:
American Academy of Ophthalmology, 2017.
 Picture: Me ,Google.
34
IIEI&H
IIEI&H
IIEI&H
For:Azizul islam

Humphrey visual field analyser (HVFA)

  • 1.
    Perimetry Md.Azizul Islam Junior Optometrist IspahaniIslamia Eye Institute & Hospital IIEI&H
  • 2.
    Aims of today,stopic Will be able…. To know about various type of perimetry  To identify field defect  To recognize that field defect is due to glaucoma or neurological lesion To know that field defect is progressive or not Interpretation of HVFA  To know Common perimetric errors IIEI&H
  • 3.
    Define Visual Field The field of vision is defined as the area that is perceived simultaneously by a fixating eye.  The limits of the normal field of vision are 60° into the superior field, 75° into the inferior field, 110° temporally, and 60° nasally.  Traquair, in his classic thesis, described an island of vision in the sea of darkness . The island represents the perceived field of vision, and the sea of darkness is the surrounding areas that are not seen. IIEI&H
  • 4.
     60°superiorly . 60°nasally .  75°inferiorly .  100° temporally •The macula corresponds to the central 13 degrees of the visual field; •The fovea to the central 3 degrees. IIEI&H Hill of vision
  • 5.
    Types of perimetry Kinetic…stimulus moves (Confrontation, lister ,Bjerrumr,s screen, Goldmann)  Static …stimulus does not moves (HVFA, OCTOPUS ) IIEI&H In kinetic perimetry, a stimulus is moved from a non-seeing (subthreshold) area to a seeing (suprathreshold) area, and the location where the object is first seen is recorded. The speed the stimulus is moved should be standardized, typically at 2-4 degrees per second. In static perimetry, stationary stimuli are presented at defined points in the visual field. Stimuli presented for longer durations of time may be seen better as a result of temporal summation of information, though limited additional benefit is derived beyond times over 1/10th of a second.
  • 6.
    Difference between kineticand static 1.VFD detect earlier with 20% defect 1. Detect when 40% damage 2. Area fixed but stimulus but varies in intensity 2. Intensity is fixed but stimulus moves from non-seeing to seeing area 3. Three dimensional 3. Two dimensional 4. Computerized 4. Not computerized 5. Threshold type 5. Non threshold type 6. Less error 6. More error 7. Both glaucoma and neurological 7. Good for neurological IIEI&H
  • 7.
    Humphrey Visual Field 24-2 White on White is the standard  Can be full threshold, SITA standard or SITA Fast. SITA (Swedish Interactive Threshold Algorithm)  SWAP (Short Wavelength Automated Perimetry) and 30-2 less useful  10-2 For advanced Glaucoma  Not directly comparable with Octopus or Medmont (different algorithms)! IIEI&H
  • 8.
    Humphrey visual fieldtest, Classification Two types– on the basis of strategies 1.Threshold test—using threshold stimulus for diagnosis of glaucoma and neurological lesions 2. Screening test– using suprathreshold stimulus for detection of glaucoma IIEI&H
  • 9.
    Threshold test—is of threetypes a . Central tests b. Peripheral tests c. Special tests Central 30-2 Peripheral 60-4 Neurological - 20 Central 24-2 Nasal step Neurological–30 Central 10- 2 Macular program  IIEI&H
  • 10.
    Central 30-2  Numberof test points:76  Density :6 degree  Only 3 degree bare area is left surrounding the fixation spot IIEI&H
  • 11.
    Central 24-2 thresholdtest pattern • No. of test points---54 • Point density is 6° (distance between two points is 6°) • Bare area (non-seeing area) is 3° from the fixation point • Extension of testing area from fixation point is 24° IIEI&H
  • 12.
    Central 10-2 threshold pattern •No. of points----68 • Point density is 2°(distance between two points is 2°) • Bare area(non-seeing area) is 1° from the fixation point • Extension of testing area from the fixation point is 10° IIEI&H
  • 13.
    Macular program •No. ofteat point is 16 •Point density is 2°(distance between two points is 2°) •Bare area (non-seeing area) is 1° from the fixation point •Extension of testing area from the fixation point is 5° IIEI&H
  • 14.
    Some standard forHVF Interpretation IIEI&H
  • 15.
  • 16.
    HVF test printout(single field) interpretation…..  We can divide the printout into 9 zones  Zone—1, Patients data and test data  Zone—2, Foveal threshold and reliable indices  Zone—3, Gray scale  Zone—4, Patients raw data  Zone—5, Total deviation plot  Zone– 6, Pattern deviation plot  Zone—7, Global indices  Zone—8, Glaucoma Hemifield Test(GHT)  Zone—9, Eye tracking(±) IIEI&H
  • 17.
  • 18.
    Zone—1, Patients dataand test data…… . IIEI&H
  • 19.
    Zone—2 ,Foveal thresholdand reliable indices… N N N IIEI&H
  • 20.
  • 21.
    Zone :4 Numericaldisplay . IIEI&H
  • 22.
    Zone –5, totaldeviation plot , has two components  A. Total deviation numerical plot(TDNP)  B. Total deviation probability plot(TDPP) IIEI&H
  • 23.
    Zone –6, patterndeviation plot , has two components  A.Pattern deviation numerical plot(PDNP)  B. Pattern deviation probability plot(PDPP) IIEI&H
  • 24.
    Zone—7, Global indices MD—meandeviation • Indicate average severity of the field loss Expressed in decibel(dB) value PSD—Pattern Standard Deviation • This is a measure of focal loss or variability within the field ,if score is high, damage is more IIEI&H
  • 25.
    Zone:8 ,GHT→ Glaucoma HemifieldTest Compare mirror image locations of superior and inferior retina and gives five comments 1. GHT—outside normal limit ,if difference found in 1% population 2. GHT—borderline , if difference found in up to 3% population 3. GHT—abnormally low sensitive, best sensitive part is seen in less than 5% of the population 4. GHT—abnormally high sensitive, best sensitive part is seen is more that found in 99.5% population 5. GHT—within normal limit, when none of the above 4 conditions are seen IIEI&H
  • 26.
    Zone –9, Gazetracking . IIEI&H
  • 27.
    Visual field defects Generalized depression→ both central and peripheral fields are depressed as in cataract  Peripheral depression → only peripheral field is depressed as in RP  Temporal contraction → only temporal field is depressed as in aging people (Depression means reduced sensitivity of the retina)  Scotomas → Non-seeing area of the visual field . Central scotoma , Peripheral scotoma Types:Absolute,Relative,Positive,Negative. IIEI&H
  • 28.
    INTERPRETATION Factors for consistencyin testing  Best Refractive correction used. Contact lens to avoid rim artifacts.  Pupil Diameter – at least 3.5 mm in size.  Visual Acuity  Date & Time of testing  Age-For comparison with normative data  Short term fluctuation-Fluctuation occurring within the test. Should be <3dB. IIEI&H
  • 29.
    INTERPRETATION…contd. Reliability of patient Fatigue,anxiety and learning effect Fixation loss – should be less than 20% False positive and negative response should be less than 33%. IIEI&H
  • 30.
    INTERPRETATION…contd.  Progression ofdefect  Test parameters comparable  Defect - increased in size / depth  >= 7 dB increase in depth of existing defect  >= 9 dB depression adj. to abnormal point  >= 11 dB depression of a normal point ( New Defect )  Box plot change analysis  Overview  Glaucoma change probability analysis IIEI&H
  • 31.
    Several types oferrors can lead to inaccurate results: Incorrect patient name. Incorrect patient age. As threshold values are compared to age- adjusted normal values, incorrect age entry will lead to comparisons with the wrong set of normal values. Inappropriate correction of refractive error. Failure to properly correct for refractive error will cause stimuli to become visually defocused, Lens rim artifacts. Thick rims for correcting refractive error, or inappropriate head positioning which causes the lens rim to block peripheral stimuli can cause artifactual depression of the peripheral points. Points are typically severely affected (often with threshold sensitivities of 0 dB), and often show an abrupt drop-off from directly adjacent points. Common perimetric errors IIEI&H
  • 32.
    Cloverleaf fields. Thispattern of visual field defects reflects poor visual attention and/or malingering. Field results typically show high rates of false negative responses. Miotic pupils or Cataracts. Ocular features which allow less light to reach the retina can cause diffuse depression of the visual field, along with statistically significant decreases in mean deviation. A small pupil may simulate a glaucomatous visual field defect by generalized depression because of miosis or exacerbate an already constricted field, giving a false impression of progression of glaucoma.  In cases with concomitant cataract, attention should be paid to the pattern deviation plot as it adjusts for generalized depression caused by the cataract. Common perimetric errors IIEI&H
  • 33.
    Take Home Messages Not every visual field defect is glaucoma!  Structural change often proceeds functional change  Progression on visual fields over time important.  24-2 HVF the Gold Standard IIEI&H
  • 34.
    References  Basic perimetrycarl zeiss 2007 .  Essentials of Ophthalmology , Basak 5th Edition.  AAO, Basic and Clinical Science Course. Section 10: Glaucoma, 2015-2016.  A AO, Glaucoma: Standard automated static perimetry Practicing Ophthalmologists Learning System, 2017 - 2019 San Francisco: American Academy of Ophthalmology, 2017.  Picture: Me ,Google. 34 IIEI&H IIEI&H
  • 35.