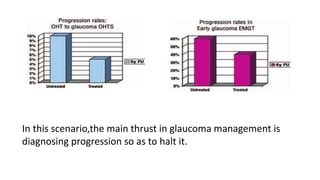
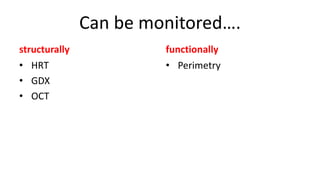
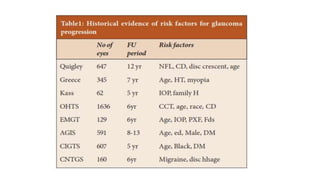
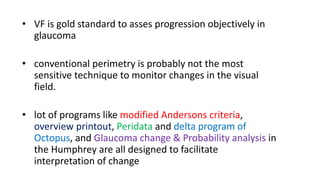
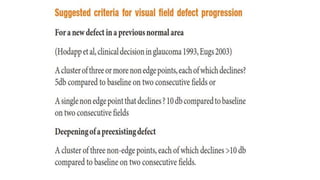
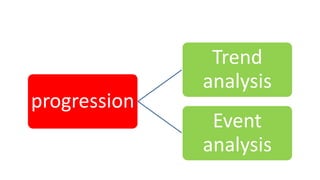
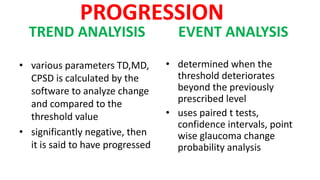
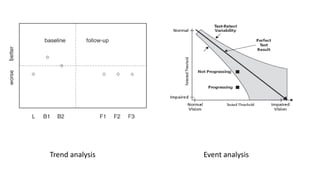
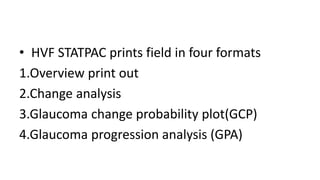
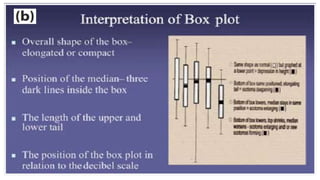
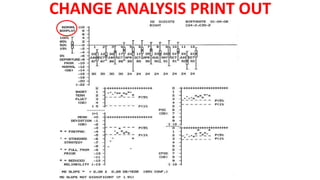
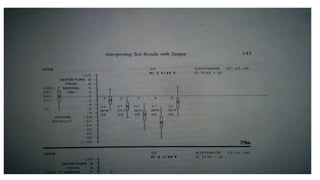
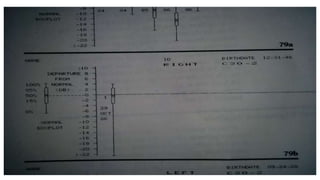
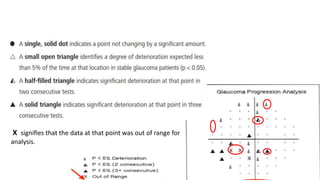
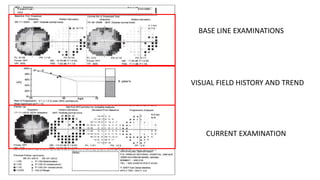
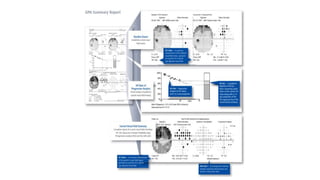
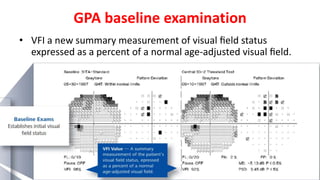
HVF PROGRESSION
SIVATEJA CHALLA
• Glaucoma is progressive optic neuropathy
characterised by progressive loss of retinal
ganglion cells
• Progress is totally irreversible
In this scenario,the main thrust in glaucoma management is
diagnosing progression so as to halt it.
Can be monitored….
structurally
• HRT
• GDX
• OCT
functionally
• Perimetry
• Clinical detection of changes in the optic disc and
RNFL corroborated by visual field assessment
still remain the accepted methods to detect
progression in glaucoma
• Drawback in clinical evaluation of the optic disc
and RNFL is that it is subjective with considerable
intra and inter observer variation
• VF is gold standard to asses progression objectively in
glaucoma
• conventional perimetry is probably not the most
sensitive technique to monitor changes in the visual
field.
• lot of programs like modified Andersons criteria,
overview printout, Peridata and delta program of
Octopus, and Glaucoma change & Probability analysis in
the Humphrey are all designed to facilitate
interpretation of change
progression
Trend
analysis
Event
analysis
PROGRESSION
TREND ANALYISIS
• various parameters TD,MD,
CPSD is calculated by the
software to analyze change
and compared to the
threshold value
• significantly negative, then
it is said to have progressed
EVENT ANALYSIS
• determined when the
threshold deteriorates
beyond the previously
prescribed level
• uses paired t tests,
confidence intervals, point
wise glaucoma change
probability analysis
Trend analysis Event analysis
• HVF STATPAC prints field in four formats
1.Overview print out
2.Change analysis
3.Glaucoma change probability plot(GCP)
4.Glaucoma progression analysis (GPA)
OVERVIEW PRINT OUT
• 16 serial follow ups of a particular
patient, just by a glance
• does not give us the reliability
indices
• all the fields being compared should
be of the same strategy.
CHANGE ANALYSIS PRINT OUT
• Produces analytical summary of changes in
patients visual field from time of earliest test
to most recent test
• Box plots are seen
• Also gives summary of four global indices
SF,PSD,CPSD and MD
CHANGE ANALYSIS PRINT OUT
Linear regression analysis
Glaucoma change
probability
• An improved sensitivity is designated as
an Open triangle and a worsened
sensitivity is depicted as close triangle
• >3 closed triangles depicts progression
• Important limitation is use of MD as an
indicator of progression is its inability to
distinguish between focal and diffuse
change. Cataracts are characterised by
the diffuse perimetric defects which may
coincide or be confused wit
glaucomatous progression.
GLAUCOMA PROGRESSION ANALYSIS
• Developed by carl zeiss,event based
• Change based on pattern deviation plot
• Requisites2 base line VF and 1 f/u VF
• Up to 14 follow up tests can be compared with
baseline
X signifies that the data at that point was out of range for
analysis.
BASE LINE EXAMINATIONS
VISUAL FIELD HISTORY AND TREND
CURRENT EXAMINATION
GPA baseline examination
• VFI a new summary measurement of visual field status
expressed as a percent of a normal age-adjusted visual field.
VFI rate of progression analysis
Current VF summary
GPA Alert
• Possible progression:
same 3 or more points
show deterioration in at
least 2 consecutive tests
• Likely progression:
same 3 or more points
show deterioration in at
least 3 consecutive
tests.
problems
• Learning curve
• Long term fluctuations
• Already Bad fields
• Other pathologies
THANK YOU

Hvf progession

  • 1.
  • 2.
    • Glaucoma isprogressive optic neuropathy characterised by progressive loss of retinal ganglion cells • Progress is totally irreversible
  • 3.
    In this scenario,themain thrust in glaucoma management is diagnosing progression so as to halt it.
  • 4.
    Can be monitored…. structurally •HRT • GDX • OCT functionally • Perimetry
  • 5.
    • Clinical detectionof changes in the optic disc and RNFL corroborated by visual field assessment still remain the accepted methods to detect progression in glaucoma • Drawback in clinical evaluation of the optic disc and RNFL is that it is subjective with considerable intra and inter observer variation
  • 7.
    • VF isgold standard to asses progression objectively in glaucoma • conventional perimetry is probably not the most sensitive technique to monitor changes in the visual field. • lot of programs like modified Andersons criteria, overview printout, Peridata and delta program of Octopus, and Glaucoma change & Probability analysis in the Humphrey are all designed to facilitate interpretation of change
  • 9.
  • 10.
    PROGRESSION TREND ANALYISIS • variousparameters TD,MD, CPSD is calculated by the software to analyze change and compared to the threshold value • significantly negative, then it is said to have progressed EVENT ANALYSIS • determined when the threshold deteriorates beyond the previously prescribed level • uses paired t tests, confidence intervals, point wise glaucoma change probability analysis
  • 11.
  • 12.
    • HVF STATPACprints field in four formats 1.Overview print out 2.Change analysis 3.Glaucoma change probability plot(GCP) 4.Glaucoma progression analysis (GPA)
  • 13.
    OVERVIEW PRINT OUT •16 serial follow ups of a particular patient, just by a glance • does not give us the reliability indices • all the fields being compared should be of the same strategy.
  • 15.
    CHANGE ANALYSIS PRINTOUT • Produces analytical summary of changes in patients visual field from time of earliest test to most recent test • Box plots are seen • Also gives summary of four global indices SF,PSD,CPSD and MD
  • 18.
  • 21.
  • 22.
    Glaucoma change probability • Animproved sensitivity is designated as an Open triangle and a worsened sensitivity is depicted as close triangle • >3 closed triangles depicts progression • Important limitation is use of MD as an indicator of progression is its inability to distinguish between focal and diffuse change. Cataracts are characterised by the diffuse perimetric defects which may coincide or be confused wit glaucomatous progression.
  • 24.
    GLAUCOMA PROGRESSION ANALYSIS •Developed by carl zeiss,event based • Change based on pattern deviation plot • Requisites2 base line VF and 1 f/u VF • Up to 14 follow up tests can be compared with baseline
  • 25.
    X signifies thatthe data at that point was out of range for analysis.
  • 26.
    BASE LINE EXAMINATIONS VISUALFIELD HISTORY AND TREND CURRENT EXAMINATION
  • 28.
    GPA baseline examination •VFI a new summary measurement of visual field status expressed as a percent of a normal age-adjusted visual field.
  • 29.
    VFI rate ofprogression analysis
  • 31.
  • 32.
    GPA Alert • Possibleprogression: same 3 or more points show deterioration in at least 2 consecutive tests • Likely progression: same 3 or more points show deterioration in at least 3 consecutive tests.
  • 33.
    problems • Learning curve •Long term fluctuations • Already Bad fields • Other pathologies
  • 35.

Editor's Notes

  • #21 Scotoma deepens over time,length of the tail increases,but less that 15% of the points are involved here