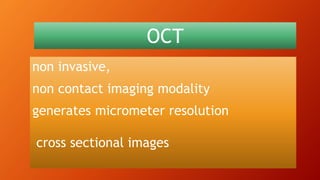
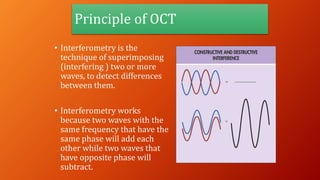
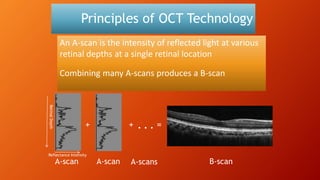
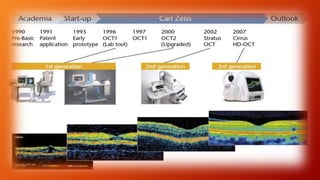
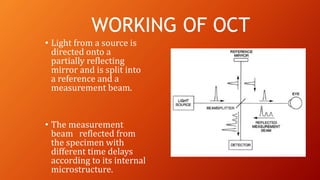
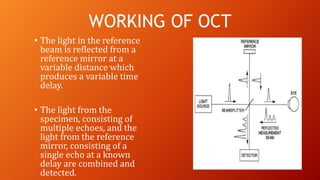
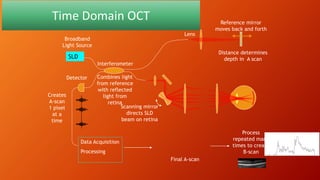
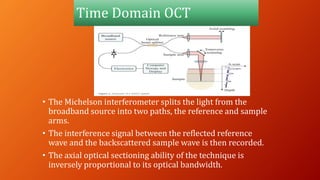
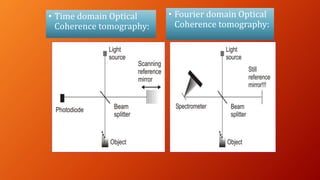
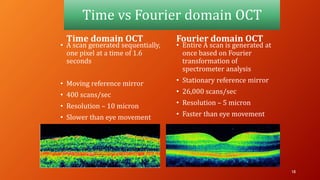
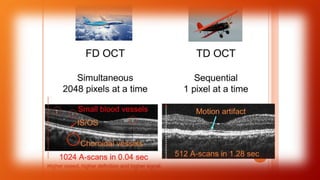
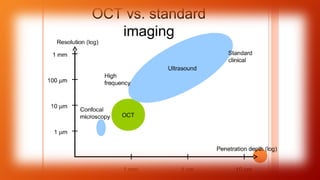
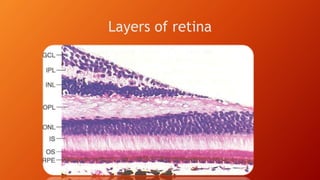
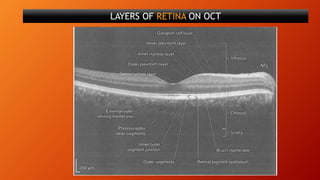
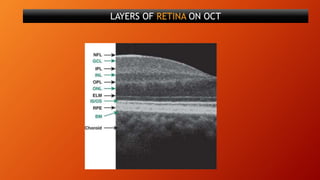
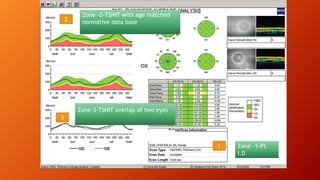
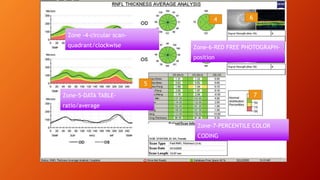
OCT DEMYSTIFIED
TO SEE THE UNSEEN
INDOREDRISHTI.WORDPRESS.COM
DR DINESH MITTAL DR SONALEE MITTAL
DRISHTI EYE HOSP VIJAYNAGAR INDORE
non invasive,
non contact imaging modality
generates micrometer resolution
cross sectional images
OCT
Scattering is a fundamental property of a
heterogeneous medium, and occurs because of
variations in the refractive index within tissue.
4
Principle of OCT
• Interferometry is the
technique of superimposing
(interfering ) two or more
waves, to detect differences
between them.
• Interferometry works
because two waves with the
same frequency that have the
same phase will add each
other while two waves that
have opposite phase will
subtract.
Principles of OCT Technology
An A-scan is the intensity of reflected light at various
retinal depths at a single retinal location
Combining many A-scans produces a B-scan
A-scan A-scan
+ + . . . =
B-scanA-scans
RetinalDepth
Reflectance Intensity
• Light from a source is
directed onto a
partially reflecting
mirror and is split into
a reference and a
measurement beam.
• The measurement
beam reflected from
the specimen with
different time delays
according to its internal
microstructure.
WORKING OF OCT
• The light in the reference
beam is reflected from a
reference mirror at a
variable distance which
produces a variable time
delay.
• The light from the
specimen, consisting of
multiple echoes, and the
light from the reference
mirror, consisting of a
single echo at a known
delay are combined and
detected.
WORKING OF OCT
A-SCAN, B-SCAN, 3D-SCAN
A-scan
B-scan
Time Domain OCT
SLD
Lens
Detector
Data Acquisition
Processing
Combines light
from reference
with reflected
light from
retina
Distance determines
depth in A scan
Reference mirror
moves back and forth
Scanning mirror
directs SLD
beam on retina
Interferometer
Broadband
Light Source
Creates
A-scan
1 pixel
at a
time
Final A-scan
Process
repeated many
times to create
B-scan
Time Domain OCT
• The Michelson interferometer splits the light from the
broadband source into two paths, the reference and sample
arms.
• The interference signal between the reflected reference
wave and the backscattered sample wave is then recorded.
• The axial optical sectioning ability of the technique is
inversely proportional to its optical bandwidth.
Fourier Domain OCT
SLD
Spectrometer
analyzes
signal by
wavelength FFT
Grating splits
signal by
wavelength
Broadband
Light Source
Reference mirror
stationary
Combines light
from reference
with reflected
light from
retina
Interferometer
Spectral
interferogram
Fourier transform
converts signal to
typical A-scan
Entire A-scan
created at a
single time
Process
repeated many
times to create
B-scan
Fourier domain OCT
• In FD-OCT ,the detector arm of the Michelson
interferometer uses a spectrometer instead a single
detector.
• The spectrometer measures spectral modulations
produced by interference between the sample and
reference reflections.
SPECTRAL/FOURIER DOMAIN OCT
• No need for mobile reference mirror
• assessment of interference patterns as a function of
frequency rather than of time.
• use spectral interferometry and a mathematical
function (Fourier transformation)
• images can be acquired 50 to 100 times more quickly
than in TD systems ( 20,000 A-scans /s )
• Time domain Optical
Coherence tomography:
• Fourier domain Optical
Coherence tomography:
Time vs Fourier domain OCT
Time domain OCT
• A scan generated sequentially,
one pixel at a time of 1.6
seconds
• Moving reference mirror
• 400 scans/sec
• Resolution – 10 micron
• Slower than eye movement
Fourier domain OCT
• Entire A scan is generated at
once based on Fourier
transformation of
spectrometer analysis
• Stationary reference mirror
• 26,000 scans/sec
• Resolution – 5 micron
• Faster than eye movement
18
Spectral OCT/SLO
• Limitation of OCT technology was difficulty in accurately localizing the
cross-sectional images and correlating them with a conventional en face
view of the fundus.
• To localize and visually interpret the images, integrating a scanning
laser ophthalmoscopy (SLO) into the OCT was needed.
• This rationale was used by OTI technologies (Toronto, Canada) to
develop the Spectral OCT/SLO.
• The Spectral OCT/SLO is a computerized optical scanner
device providing high-resolution, high-definition images
of the fundus anatomy.
• It integrats SLO’s confocal imaging principles with OCT’s
high resolution tomographic images.
• The system simultaneously produces SLO and OCT
images that are created through the same optical path,
and therefore correspond pixel to pixel.
• It produces a new image format called as C scan
OCT Fundus Images
• .
• SD OCT can generate
“OCT fundus images”
that mimic the images
obtained from fundus
photography
Layers of retina
1. nerve fiber layer ( hyper reflective )
2. ganglion cell layer ( hypo reflective )
3. internal limiting membrane ( hyper reflective )
4. inner plexiform layer ( hyper reflective )
5. inner nuclear layer ( hypo reflective )
6. outer plexiform layer ( hyper reflective )
7. outer nuclear layer ( hypo reflective )
8. external limiting membrane ( hyper reflective )
9. photoreceptors ( hyper reflective )
10.pigment epithelium ( hyper reflective )
Normal retina layers
vitreous
internal limiting membranenerve fiber layer
ganglion cell layer & inner plexiform layer
inner nuclear layer & outer plexiform layer
photoreceptors
pigment epithelium
bruch’s membrane &
choriocapilaris
outer nuclear layer & external limiting
memmbrane
sclera
TEN RETINAL LAYERS
LAYERS OF RETINA ON OCT
OCT IN DIFFERENT RETINAL DISEASES
• differentiate lamellar / pseudo / full-thickness
macular holes
• diagnosing vitreomacular traction syndrome
• differentiating various presentations of diabetic
macular edema
• monitoring the course of CSR
• making treatment decisions in ARMD
OCT role in DME
•Confirm presence of macular edema
•Know type of macular edema
•Assess macular thickness
•Vitero macular interface abnormalities
•Intra retinal exudates
OCT role in DME
•Sub retinal fluid
•Photoreceptor IS / OS junction
abnormalities
•Know response to laser , IV
pharmacotherapy & surgery
•For follow up & documentation.
OCT can also produce a retinal thickness map.
The OCT software automatically determines
the inner and outer retinal boundaries and
produces a false-color topographic map
showing areas of increased thickening in
brighter colors and areas of lesser thicken -ing
in darker colors
RETINAL THICKNESS MAP
OCT can also produce a
retinal thickness map.
The OCT software
automatically determines
the inner and outer retinal
boundaries and produces
a false-color topographic
map showing areas of
increased thickening in
brighter colors and areas
of lesser thicken -ing in
darker colors
An assessment of macular volume can also be
obtained from the retinal thickness map. By
evaluating differences in retinal volume over
time, the clinician can judge the efficacy of
therapy
RETINAL THICKNESS MAP
OCT gold standard in monitoring the progression and
treatment response in DME patients .
Retinal thickness is the most commonly used
quantitative parameter.
cirrhus measures the retinal thickness between ILM
& anterior edge of rpe layer .
normal subjects central retinal thickness is 265 µm
with cirrhus oct .
DME can be classified as
Diffuse retinal thickness Sponge like generalized mild hypo reflective swelling of retina
Cystoid macular odema presence of intra retinal cystoid areas of low reflectivity & separated by
higher reflectivity septa
Serous retinal detachment focal elevation of neurosensory retina overlying a hyporeflective dome
shaped space .
Viteromacular interface abnormalilities may involve epiretinal membrane or vitreo macular traction or both
DME
DRUSEN EVOLUTION IN DRY ARMD
FIBROVASCULAR PED
WET ARMD
CSR
PARTIAL THICKNESS FULL THICKNESS
MACULAR HOLE
OCT IN GLAUCOMA
Ganglion cell
death
RNFL CHANGES
GLAUCOMA PROGRESSION
OCT Software analyses-
Peri papilary
Nerve fiber layer
Macular thickness
Optic nerve
head
1. Macula
Thickness
2. RNFL
3. Optic Nerve
Head
(ONH)
Ganglion cells- 30-35% of total retinal thickness at macula
upto 50%of ganglion cells in macula
glaucoma preferentially involves the ganglion cell complex (GCC).
Macula Thickness Analysis
Glaucoma with thinner GCC
Normal
RNFL Analysis
• Analysis of RNFL aids in identification of early glaucomatous loss
• Circular scans of 3.4 mm diameter in the peripapillary region (cylindrical
retinal cross-section)
• RNFL thickness measurement is graphed in a TSNIT orientation
• Compared to age-matched normative data
RNFL analysis
• Circular scanning
around ONH at a radius
of 1. 73mm
• Three scans are
acquired and data is
averaged and compared
with normative data
base of age matched
subjects
• Scan begins temporally
RNFL thickness average analysis
printout -7 zones
• Zone -1-Pt. I.D
• Zone -2-TSNIT with age matched normative data
base
• Zone-3-TSNIT overlap of two eyes
• Zone -4-circular scan-quadrant/clockwise
• Zone-5-DATA TABLE-ratio/average
• Zone-6-RED FREE PHOTOGRAPH-position
• Zone-7-PERCENTILE COLOR CODING
7
6
5
4
3
2
1
3
2
1 Zone -1-Pt.
I.D
Zone -2-TSNIT with age matched
normative data base
Zone-3-TSNIT overlap of two eyes
7
6
5
4
Zone -4-circular scan-
quadrant/clockwise
Zone-5-DATA TABLE-
ratio/average
Zone-6-RED FREE PHOTOGRAPH-
position
Zone-7-PERCENTILE COLOR
CODING
Optic Nerve Head Analysis
• Radial line scans through optic disc provide crosssectional information on
cupping and neuroretinal rim area
• Disc margins are objectively identified using signal from
end of RPE
• Parameters:
• Disc
• cup and rim area
• horizontal and vertical cup-to-disc ratio
• vertical integrated rim area
• horizontal integrated rim width
Optic nerve head analysis
Optic nerve head scans
are composed of six
linear scans in a spoke
pattern separated by
30-degree intervals
centered on the ONH
Cup/disk ratios and cup Volumes
Disc size:
 by measuring the distance
between the terminal ends
of the choriod at the level of
the pigment epithelium
(green line)
Cup:
 determined by drawing a line
b/w both sides of the cup at
a point 140um above the
green line.
 Area below the line is cup
and above is neuroretinal
rim
OCT IN CORNEA
OCT ANTERIOR EYE
• OCT image of a
normal anterior
chamber
• cornea, sclera, iris
and lens anterior
capsule identified
• It gives optical
images with higher
resolution than
Scheimpflug-based
devices
•
T Tear film
Ep Epithelium
B Bowman layer
S Stroma
En & D Endothelium & Descemets layer
• • It measures corneal thickness and gives a
that is less affected by corneal opacities
• • It can be used in diagnosis and treatment of refractive
complications and some corneal pathologies
• • It is taking an important role in detecting early KC and
other ectatic corneal disorders
THANK YOU
DR DINESH
DR SONALEE

OPTICAL COHERENCE DEMYSTIFIED

  • 1.
    OCT DEMYSTIFIED TO SEETHE UNSEEN INDOREDRISHTI.WORDPRESS.COM
  • 2.
    DR DINESH MITTALDR SONALEE MITTAL DRISHTI EYE HOSP VIJAYNAGAR INDORE
  • 3.
    non invasive, non contactimaging modality generates micrometer resolution cross sectional images OCT
  • 4.
    Scattering is afundamental property of a heterogeneous medium, and occurs because of variations in the refractive index within tissue. 4
  • 5.
    Principle of OCT •Interferometry is the technique of superimposing (interfering ) two or more waves, to detect differences between them. • Interferometry works because two waves with the same frequency that have the same phase will add each other while two waves that have opposite phase will subtract.
  • 6.
    Principles of OCTTechnology An A-scan is the intensity of reflected light at various retinal depths at a single retinal location Combining many A-scans produces a B-scan A-scan A-scan + + . . . = B-scanA-scans RetinalDepth Reflectance Intensity
  • 8.
    • Light froma source is directed onto a partially reflecting mirror and is split into a reference and a measurement beam. • The measurement beam reflected from the specimen with different time delays according to its internal microstructure. WORKING OF OCT
  • 9.
    • The lightin the reference beam is reflected from a reference mirror at a variable distance which produces a variable time delay. • The light from the specimen, consisting of multiple echoes, and the light from the reference mirror, consisting of a single echo at a known delay are combined and detected. WORKING OF OCT
  • 10.
  • 12.
    Time Domain OCT SLD Lens Detector DataAcquisition Processing Combines light from reference with reflected light from retina Distance determines depth in A scan Reference mirror moves back and forth Scanning mirror directs SLD beam on retina Interferometer Broadband Light Source Creates A-scan 1 pixel at a time Final A-scan Process repeated many times to create B-scan
  • 13.
    Time Domain OCT •The Michelson interferometer splits the light from the broadband source into two paths, the reference and sample arms. • The interference signal between the reflected reference wave and the backscattered sample wave is then recorded. • The axial optical sectioning ability of the technique is inversely proportional to its optical bandwidth.
  • 14.
    Fourier Domain OCT SLD Spectrometer analyzes signalby wavelength FFT Grating splits signal by wavelength Broadband Light Source Reference mirror stationary Combines light from reference with reflected light from retina Interferometer Spectral interferogram Fourier transform converts signal to typical A-scan Entire A-scan created at a single time Process repeated many times to create B-scan
  • 15.
    Fourier domain OCT •In FD-OCT ,the detector arm of the Michelson interferometer uses a spectrometer instead a single detector. • The spectrometer measures spectral modulations produced by interference between the sample and reference reflections.
  • 16.
    SPECTRAL/FOURIER DOMAIN OCT •No need for mobile reference mirror • assessment of interference patterns as a function of frequency rather than of time. • use spectral interferometry and a mathematical function (Fourier transformation) • images can be acquired 50 to 100 times more quickly than in TD systems ( 20,000 A-scans /s )
  • 17.
    • Time domainOptical Coherence tomography: • Fourier domain Optical Coherence tomography:
  • 18.
    Time vs Fourierdomain OCT Time domain OCT • A scan generated sequentially, one pixel at a time of 1.6 seconds • Moving reference mirror • 400 scans/sec • Resolution – 10 micron • Slower than eye movement Fourier domain OCT • Entire A scan is generated at once based on Fourier transformation of spectrometer analysis • Stationary reference mirror • 26,000 scans/sec • Resolution – 5 micron • Faster than eye movement 18
  • 19.
    Spectral OCT/SLO • Limitationof OCT technology was difficulty in accurately localizing the cross-sectional images and correlating them with a conventional en face view of the fundus. • To localize and visually interpret the images, integrating a scanning laser ophthalmoscopy (SLO) into the OCT was needed. • This rationale was used by OTI technologies (Toronto, Canada) to develop the Spectral OCT/SLO.
  • 20.
    • The SpectralOCT/SLO is a computerized optical scanner device providing high-resolution, high-definition images of the fundus anatomy. • It integrats SLO’s confocal imaging principles with OCT’s high resolution tomographic images. • The system simultaneously produces SLO and OCT images that are created through the same optical path, and therefore correspond pixel to pixel. • It produces a new image format called as C scan
  • 23.
    OCT Fundus Images •. • SD OCT can generate “OCT fundus images” that mimic the images obtained from fundus photography
  • 25.
  • 26.
    1. nerve fiberlayer ( hyper reflective ) 2. ganglion cell layer ( hypo reflective ) 3. internal limiting membrane ( hyper reflective ) 4. inner plexiform layer ( hyper reflective ) 5. inner nuclear layer ( hypo reflective ) 6. outer plexiform layer ( hyper reflective ) 7. outer nuclear layer ( hypo reflective ) 8. external limiting membrane ( hyper reflective ) 9. photoreceptors ( hyper reflective ) 10.pigment epithelium ( hyper reflective ) Normal retina layers
  • 27.
    vitreous internal limiting membranenervefiber layer ganglion cell layer & inner plexiform layer inner nuclear layer & outer plexiform layer photoreceptors pigment epithelium bruch’s membrane & choriocapilaris outer nuclear layer & external limiting memmbrane sclera TEN RETINAL LAYERS
  • 28.
  • 29.
  • 30.
    OCT IN DIFFERENTRETINAL DISEASES • differentiate lamellar / pseudo / full-thickness macular holes • diagnosing vitreomacular traction syndrome • differentiating various presentations of diabetic macular edema • monitoring the course of CSR • making treatment decisions in ARMD
  • 31.
    OCT role inDME •Confirm presence of macular edema •Know type of macular edema •Assess macular thickness •Vitero macular interface abnormalities •Intra retinal exudates
  • 32.
    OCT role inDME •Sub retinal fluid •Photoreceptor IS / OS junction abnormalities •Know response to laser , IV pharmacotherapy & surgery •For follow up & documentation.
  • 33.
    OCT can alsoproduce a retinal thickness map. The OCT software automatically determines the inner and outer retinal boundaries and produces a false-color topographic map showing areas of increased thickening in brighter colors and areas of lesser thicken -ing in darker colors RETINAL THICKNESS MAP
  • 34.
    OCT can alsoproduce a retinal thickness map. The OCT software automatically determines the inner and outer retinal boundaries and produces a false-color topographic map showing areas of increased thickening in brighter colors and areas of lesser thicken -ing in darker colors
  • 35.
    An assessment ofmacular volume can also be obtained from the retinal thickness map. By evaluating differences in retinal volume over time, the clinician can judge the efficacy of therapy RETINAL THICKNESS MAP
  • 36.
    OCT gold standardin monitoring the progression and treatment response in DME patients . Retinal thickness is the most commonly used quantitative parameter. cirrhus measures the retinal thickness between ILM & anterior edge of rpe layer . normal subjects central retinal thickness is 265 µm with cirrhus oct .
  • 37.
    DME can beclassified as Diffuse retinal thickness Sponge like generalized mild hypo reflective swelling of retina Cystoid macular odema presence of intra retinal cystoid areas of low reflectivity & separated by higher reflectivity septa Serous retinal detachment focal elevation of neurosensory retina overlying a hyporeflective dome shaped space . Viteromacular interface abnormalilities may involve epiretinal membrane or vitreo macular traction or both DME
  • 38.
  • 39.
  • 40.
  • 41.
    PARTIAL THICKNESS FULLTHICKNESS MACULAR HOLE
  • 42.
  • 43.
  • 44.
    OCT Software analyses- Peripapilary Nerve fiber layer Macular thickness Optic nerve head 1. Macula Thickness 2. RNFL 3. Optic Nerve Head (ONH)
  • 45.
    Ganglion cells- 30-35%of total retinal thickness at macula upto 50%of ganglion cells in macula glaucoma preferentially involves the ganglion cell complex (GCC). Macula Thickness Analysis Glaucoma with thinner GCC Normal
  • 47.
    RNFL Analysis • Analysisof RNFL aids in identification of early glaucomatous loss • Circular scans of 3.4 mm diameter in the peripapillary region (cylindrical retinal cross-section) • RNFL thickness measurement is graphed in a TSNIT orientation • Compared to age-matched normative data
  • 48.
    RNFL analysis • Circularscanning around ONH at a radius of 1. 73mm • Three scans are acquired and data is averaged and compared with normative data base of age matched subjects • Scan begins temporally
  • 49.
    RNFL thickness averageanalysis printout -7 zones • Zone -1-Pt. I.D • Zone -2-TSNIT with age matched normative data base • Zone-3-TSNIT overlap of two eyes • Zone -4-circular scan-quadrant/clockwise • Zone-5-DATA TABLE-ratio/average • Zone-6-RED FREE PHOTOGRAPH-position • Zone-7-PERCENTILE COLOR CODING
  • 50.
  • 51.
    3 2 1 Zone -1-Pt. I.D Zone-2-TSNIT with age matched normative data base Zone-3-TSNIT overlap of two eyes
  • 52.
    7 6 5 4 Zone -4-circular scan- quadrant/clockwise Zone-5-DATATABLE- ratio/average Zone-6-RED FREE PHOTOGRAPH- position Zone-7-PERCENTILE COLOR CODING
  • 53.
    Optic Nerve HeadAnalysis • Radial line scans through optic disc provide crosssectional information on cupping and neuroretinal rim area • Disc margins are objectively identified using signal from end of RPE • Parameters: • Disc • cup and rim area • horizontal and vertical cup-to-disc ratio • vertical integrated rim area • horizontal integrated rim width
  • 54.
    Optic nerve headanalysis Optic nerve head scans are composed of six linear scans in a spoke pattern separated by 30-degree intervals centered on the ONH
  • 55.
    Cup/disk ratios andcup Volumes Disc size:  by measuring the distance between the terminal ends of the choriod at the level of the pigment epithelium (green line) Cup:  determined by drawing a line b/w both sides of the cup at a point 140um above the green line.  Area below the line is cup and above is neuroretinal rim
  • 56.
  • 57.
    OCT ANTERIOR EYE •OCT image of a normal anterior chamber • cornea, sclera, iris and lens anterior capsule identified
  • 58.
    • It givesoptical images with higher resolution than Scheimpflug-based devices • T Tear film Ep Epithelium B Bowman layer S Stroma En & D Endothelium & Descemets layer
  • 59.
    • • Itmeasures corneal thickness and gives a that is less affected by corneal opacities • • It can be used in diagnosis and treatment of refractive complications and some corneal pathologies • • It is taking an important role in detecting early KC and other ectatic corneal disorders
  • 60.