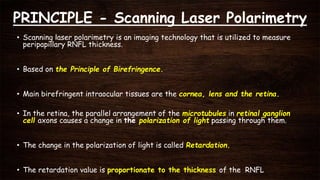
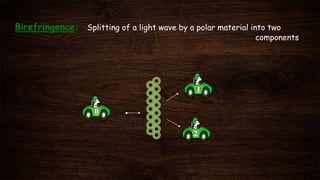
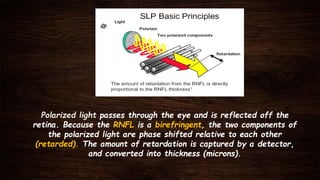
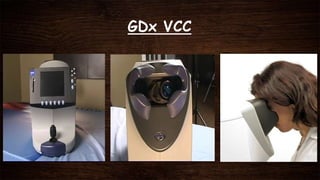
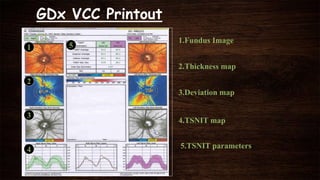
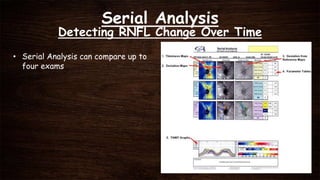
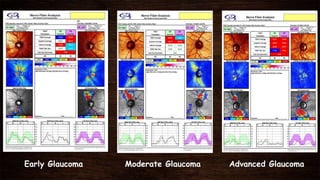
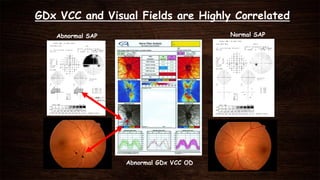
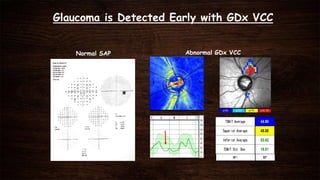
GDx
DR SHYLESH B DABKE
GLAUCOMA FELLOW
ARAVIND EYE HOSPITAL
Download and watch in slideshow mode, online viewing will be disgusting
INTRODUCTION
• GDX measures thickness of RNFL based on birefringent property of
the tissue.
• GDX is:
- Simple to use and easy for both the patient and operator.
- Near Infra-red wavelength(780 nm).
- Measurement time is 0.7 seconds.
- Total chair time less than 3 minutes for both eyes.
- Undilated pupils work best.
- Painless & safe procedure.
• The GDx :
- Maps the RNFL and compares them to a database of healthy,glaucoma-free
patients.
- Analyses the RNFL thickness around the optic disc.
• Sensitivity of 89% and a Specificity of 98%.
Why RNFL Assessment??
• RNFL defects - earliest sign of glaucoma.
• 88% of ocular hypertensives who converted to glaucoma had
RNFL defects along with VF defects. 60%of these converters
had RNFL defects 6 years prior to VF defects (Sommer et al).
• RNFL changes are detected more frequently than ONH changes
in eyes converted from ocular hypertension to glaucoma
(Quigley et al).
• RNFL damage occurs earlier than VF defects and ONH damage.
PRINCIPLE - Scanning Laser Polarimetry
• Scanning laser polarimetry is an imaging technology that is utilized to measure
peripapillary RNFL thickness.
• Based on the Principle of Birefringence.
• Main birefringent intraocular tissues are the cornea, lens and the retina.
• In the retina, the parallel arrangement of the microtubules in retinal ganglion
cell axons causes a change in the polarization of light passing through them.
• The change in the polarization of light is called Retardation.
• The retardation value is proportionate to the thickness of the RNFL
RNFL - highly ordered parallel axon bundles
Axons - microtubules, cylindrical intracellular organelles with
diameters smaller than the wavelength of light.
Highly ordered structure of microtubules are the source of
RNFL birefringence
0
1
2
Birefringence: Splitting of a light wave by a polar material into two
components
These components travel at different velocities
which creates a relative phase shift
2
Retardation
1
Amount of phase shift is ≃ RNFL thickness
Polarized light passes through the eye and is reflected off the
retina. Because the RNFL is a birefringent, the two components of
the polarized light are phase shifted relative to each other
(retarded). The amount of retardation is captured by a detector,
and converted into thickness (microns).
Scanning Laser Polarimetry
• Amount of retardation is captured by a detector and converted into
thickness (microns)
• Raster scan - 40° horizontally and 20° vertically and includes both
peripapillary region and macular region
• Anterior segment birefringence - cornea and lens.
• The total retardation is the sum of the cornea, lens and the retina.
• Compensation of anterior segment birefringence is needed to isolate
RNFL birefringence.
• GDx VCC(variable corneal compensation) measures and individually
compensates for each eye.
• VCC stands for variable corneal compensator, which was created to account for
the variable corneal birefringence in patients
• Uses the birefringence of Henle’s layer in the macula as a control for
measurement of corneal birefringence
GDx VCC
GDx VCC Printout
1.Fundus Image
2.Thickness map
3.Deviation map
4.TSNIT map
5.TSNIT parameters
2
1
4
3
5
Patients information
• Patient data and quality score:
- Patient’s name
- Date of birth
- Gender
- Ethnicity
- An ideal quality score is from 7 to 10
FUNDUS IMAGE
• The fundus image is useful to check for
image quality:
• Every image has a Q Score representing the
overall quality of the scan
• The Q ranges from 1-10, with values 8-10
representing acceptable quality.
• This score is based on a number of factors
including :
-Well focused,
- Evenly illuminated,
- Optic disc is well centered,
- Ellipse is properly placed around the ONH.
• The operator centers ellipse over the ONH
• The fixed sized default calculation circle is a centred on ONH.
• Inner diameter of the band is 2.4mm, outer diameter of the band is
3.2mm & the band is 0.4mm wide.
• The calculation circle is the area found between the two concentric
circles, which measure the temporal-superiornasal-inferior-temporal
(TSNIT) and nerve fiber indicator (NFI) parameters
• By Resizing The Calculation Circle And Ellipse, the Operator
is able To Measure Beyond A Large Peripapillary Atrophy Area
RNFL Thickness Map
• The thickness map shows the RNFL thickness in a
color-coded format from blue to red.
• Hot colors like red and yellow mean high
retardation or thicker RNFL
• Cool colors like blue and green mean low
retardation / thinner RNFL
Healthy RNFL Glaucomatous RNFL
• A healthy eye has yellow and red colors in the superior and inferior regions
representing thick RNFL regions and blue and green areas nasally and temporally
representing thinner RNFL areas.
• In glaucoma, RNFL loss will result in a more uniform blue appearance
Deviation Maps
• Reveals the location & magnitude of RNFL
defects over the entire thickness map
• RNFL thickness of patient is compared to
the age-matched normative database
• Each square represents a “Super Pixel”
• RNFL thickness at each super pixel is
compared to age matched normative
database
• Super pixel that fall below normal range
is flagged by color squares based on
probability of normality
• Dark blue squares RNFL thickness is below the 5th
percentile of the normative database
• Light blue squares deviation below the 2% level
• Yellow deviation below 1%
• Red deviation below 0.5%.
TSNIT Map • Displays the RNFL thickness values along the
calculation circle
• In a normal eye the TSNIT plot follows the
typical ‘Double Hump’ pattern, with thick RNFL
measures superiorly and inferiorly and thin
RNFL values nasally and temporally
• In a healthy eye, the TSNIT curve will fall
within the shaded area which represents the
95% normal range for that age
• When there is RNFL loss, the TSNIT curve will
fall below this shaded area, especially in the
superior and inferior regions
• In the center of the printout at the
bottom, the TSNIT graphs for both eyes
are displayed together.
• Healthy eye there is good symmetry
between the TSNIT graphs of the two
eyes and the two curves will overlap
• In glaucoma, one eye often has more
advanced RNFL loss and therefore the
two curves will have less overlap
Parameters Table
• The TSNIT parameters are summary
measures based on RNFL thickness
values within the calculation circle
• Normal parameter values are displayed
in green
• Abnormal values are color-coded based
on their probability of normality.colours
are similar to deviation maps.
• TSNIT SD : Captures the amount of modulation (peak to trough difference)
in TSNIT graph.
In normal eye there is high modulation.
In glaucoma eye there is RNFL loss in Sup
& Inf region which results in low
modulation & a low TSNIT SD value.
• Inter-eye Symmetry
Values nearing 1 – Good Symmetry
Values nearing 0 – Poor Symmetry
The Nerve Fiber Indicator (NFI)
• Global measure based on the entire RNFL thickness map
• Calculated using an advanced form of neural network, called a
Support Vector Machine (SVM)
• Not colour coded
• Output values range from 1 –100
– 1-30 -> low likelihood of glaucoma
– 31-50 -> glaucoma suspect
– 51+ -> high likelihood of glaucoma
Clinical research has shown that the
NFI is the best parameter for
discriminating normal from glaucoma
Serial Analysis
Detecting RNFL Change Over Time
• Serial Analysis can compare up to
four exams
Early Glaucoma Moderate Glaucoma Advanced Glaucoma
GDx VCC and Visual Fields are Highly Correlated
Abnormal SAP
Abnormal GDx VCC OD
Normal SAP
Glaucoma is Detected Early with GDx VCC
Normal SAP Abnormal GDx VCC
Glaucoma is Detected Early with GDx VCC
Normal SAP
GDx VCC Abnormal OS
Normal SAP
CONCLUSIONS
• The ability to detect early glaucomatous structural changes has great
potential value in delaying and avoiding progression of the disease
• Should not be regarded as replacing the skilled ophthalmologist’s capacity
to evaluate all aspects of the patient’s diagnosis.
• But they can definitely aid in the complicated decision-making process

G Dx - Dr Shylesh B Dabke

  • 1.
    GDx DR SHYLESH BDABKE GLAUCOMA FELLOW ARAVIND EYE HOSPITAL Download and watch in slideshow mode, online viewing will be disgusting
  • 2.
    INTRODUCTION • GDX measuresthickness of RNFL based on birefringent property of the tissue. • GDX is: - Simple to use and easy for both the patient and operator. - Near Infra-red wavelength(780 nm). - Measurement time is 0.7 seconds. - Total chair time less than 3 minutes for both eyes. - Undilated pupils work best. - Painless & safe procedure.
  • 3.
    • The GDx: - Maps the RNFL and compares them to a database of healthy,glaucoma-free patients. - Analyses the RNFL thickness around the optic disc. • Sensitivity of 89% and a Specificity of 98%.
  • 4.
    Why RNFL Assessment?? •RNFL defects - earliest sign of glaucoma. • 88% of ocular hypertensives who converted to glaucoma had RNFL defects along with VF defects. 60%of these converters had RNFL defects 6 years prior to VF defects (Sommer et al). • RNFL changes are detected more frequently than ONH changes in eyes converted from ocular hypertension to glaucoma (Quigley et al). • RNFL damage occurs earlier than VF defects and ONH damage.
  • 5.
    PRINCIPLE - ScanningLaser Polarimetry • Scanning laser polarimetry is an imaging technology that is utilized to measure peripapillary RNFL thickness. • Based on the Principle of Birefringence. • Main birefringent intraocular tissues are the cornea, lens and the retina. • In the retina, the parallel arrangement of the microtubules in retinal ganglion cell axons causes a change in the polarization of light passing through them. • The change in the polarization of light is called Retardation. • The retardation value is proportionate to the thickness of the RNFL
  • 6.
    RNFL - highlyordered parallel axon bundles Axons - microtubules, cylindrical intracellular organelles with diameters smaller than the wavelength of light. Highly ordered structure of microtubules are the source of RNFL birefringence
  • 7.
    0 1 2 Birefringence: Splitting ofa light wave by a polar material into two components
  • 8.
    These components travelat different velocities which creates a relative phase shift 2 Retardation 1 Amount of phase shift is ≃ RNFL thickness
  • 9.
    Polarized light passesthrough the eye and is reflected off the retina. Because the RNFL is a birefringent, the two components of the polarized light are phase shifted relative to each other (retarded). The amount of retardation is captured by a detector, and converted into thickness (microns).
  • 10.
    Scanning Laser Polarimetry •Amount of retardation is captured by a detector and converted into thickness (microns) • Raster scan - 40° horizontally and 20° vertically and includes both peripapillary region and macular region
  • 11.
    • Anterior segmentbirefringence - cornea and lens. • The total retardation is the sum of the cornea, lens and the retina. • Compensation of anterior segment birefringence is needed to isolate RNFL birefringence. • GDx VCC(variable corneal compensation) measures and individually compensates for each eye.
  • 12.
    • VCC standsfor variable corneal compensator, which was created to account for the variable corneal birefringence in patients • Uses the birefringence of Henle’s layer in the macula as a control for measurement of corneal birefringence
  • 14.
  • 15.
    GDx VCC Printout 1.FundusImage 2.Thickness map 3.Deviation map 4.TSNIT map 5.TSNIT parameters 2 1 4 3 5
  • 16.
    Patients information • Patientdata and quality score: - Patient’s name - Date of birth - Gender - Ethnicity - An ideal quality score is from 7 to 10
  • 17.
    FUNDUS IMAGE • Thefundus image is useful to check for image quality: • Every image has a Q Score representing the overall quality of the scan • The Q ranges from 1-10, with values 8-10 representing acceptable quality. • This score is based on a number of factors including : -Well focused, - Evenly illuminated, - Optic disc is well centered, - Ellipse is properly placed around the ONH.
  • 18.
    • The operatorcenters ellipse over the ONH
  • 19.
    • The fixedsized default calculation circle is a centred on ONH. • Inner diameter of the band is 2.4mm, outer diameter of the band is 3.2mm & the band is 0.4mm wide. • The calculation circle is the area found between the two concentric circles, which measure the temporal-superiornasal-inferior-temporal (TSNIT) and nerve fiber indicator (NFI) parameters • By Resizing The Calculation Circle And Ellipse, the Operator is able To Measure Beyond A Large Peripapillary Atrophy Area
  • 20.
    RNFL Thickness Map •The thickness map shows the RNFL thickness in a color-coded format from blue to red. • Hot colors like red and yellow mean high retardation or thicker RNFL • Cool colors like blue and green mean low retardation / thinner RNFL
  • 21.
    Healthy RNFL GlaucomatousRNFL • A healthy eye has yellow and red colors in the superior and inferior regions representing thick RNFL regions and blue and green areas nasally and temporally representing thinner RNFL areas. • In glaucoma, RNFL loss will result in a more uniform blue appearance
  • 22.
    Deviation Maps • Revealsthe location & magnitude of RNFL defects over the entire thickness map • RNFL thickness of patient is compared to the age-matched normative database • Each square represents a “Super Pixel” • RNFL thickness at each super pixel is compared to age matched normative database • Super pixel that fall below normal range is flagged by color squares based on probability of normality
  • 23.
    • Dark bluesquares RNFL thickness is below the 5th percentile of the normative database • Light blue squares deviation below the 2% level • Yellow deviation below 1% • Red deviation below 0.5%.
  • 25.
    TSNIT Map •Displays the RNFL thickness values along the calculation circle • In a normal eye the TSNIT plot follows the typical ‘Double Hump’ pattern, with thick RNFL measures superiorly and inferiorly and thin RNFL values nasally and temporally • In a healthy eye, the TSNIT curve will fall within the shaded area which represents the 95% normal range for that age • When there is RNFL loss, the TSNIT curve will fall below this shaded area, especially in the superior and inferior regions
  • 26.
    • In thecenter of the printout at the bottom, the TSNIT graphs for both eyes are displayed together. • Healthy eye there is good symmetry between the TSNIT graphs of the two eyes and the two curves will overlap • In glaucoma, one eye often has more advanced RNFL loss and therefore the two curves will have less overlap
  • 27.
    Parameters Table • TheTSNIT parameters are summary measures based on RNFL thickness values within the calculation circle • Normal parameter values are displayed in green • Abnormal values are color-coded based on their probability of normality.colours are similar to deviation maps.
  • 29.
    • TSNIT SD: Captures the amount of modulation (peak to trough difference) in TSNIT graph. In normal eye there is high modulation. In glaucoma eye there is RNFL loss in Sup & Inf region which results in low modulation & a low TSNIT SD value.
  • 30.
    • Inter-eye Symmetry Valuesnearing 1 – Good Symmetry Values nearing 0 – Poor Symmetry
  • 31.
    The Nerve FiberIndicator (NFI) • Global measure based on the entire RNFL thickness map • Calculated using an advanced form of neural network, called a Support Vector Machine (SVM) • Not colour coded • Output values range from 1 –100 – 1-30 -> low likelihood of glaucoma – 31-50 -> glaucoma suspect – 51+ -> high likelihood of glaucoma Clinical research has shown that the NFI is the best parameter for discriminating normal from glaucoma
  • 32.
    Serial Analysis Detecting RNFLChange Over Time • Serial Analysis can compare up to four exams
  • 33.
    Early Glaucoma ModerateGlaucoma Advanced Glaucoma
  • 34.
    GDx VCC andVisual Fields are Highly Correlated Abnormal SAP Abnormal GDx VCC OD Normal SAP
  • 35.
    Glaucoma is DetectedEarly with GDx VCC Normal SAP Abnormal GDx VCC
  • 36.
    Glaucoma is DetectedEarly with GDx VCC Normal SAP GDx VCC Abnormal OS Normal SAP
  • 37.
    CONCLUSIONS • The abilityto detect early glaucomatous structural changes has great potential value in delaying and avoiding progression of the disease • Should not be regarded as replacing the skilled ophthalmologist’s capacity to evaluate all aspects of the patient’s diagnosis. • But they can definitely aid in the complicated decision-making process