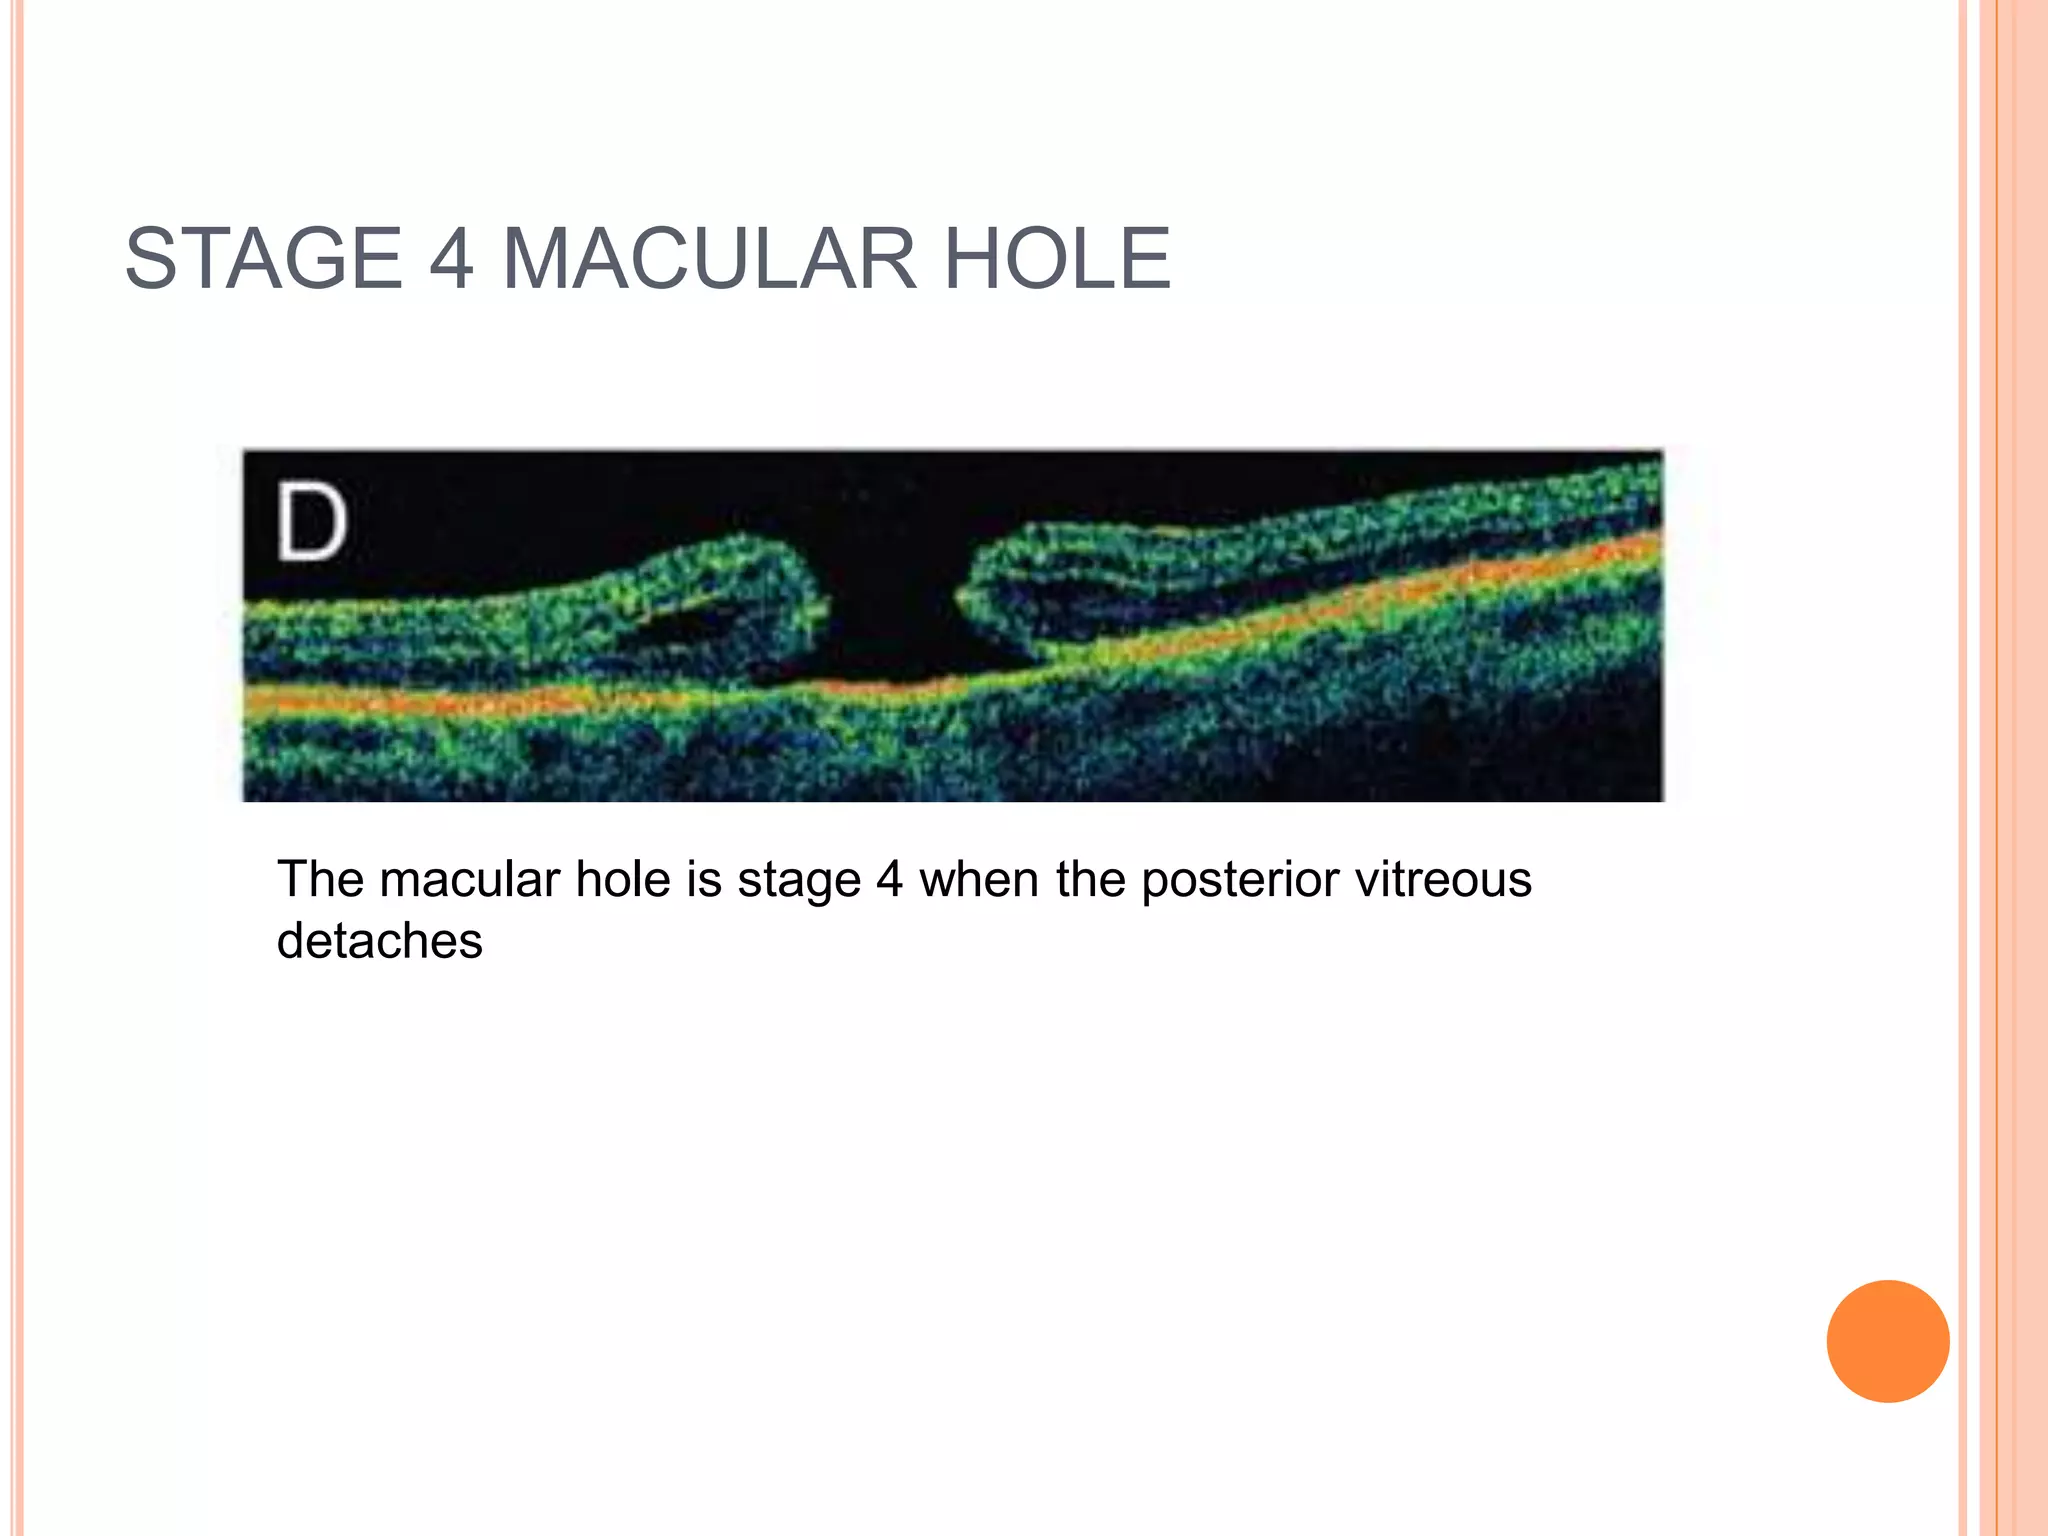
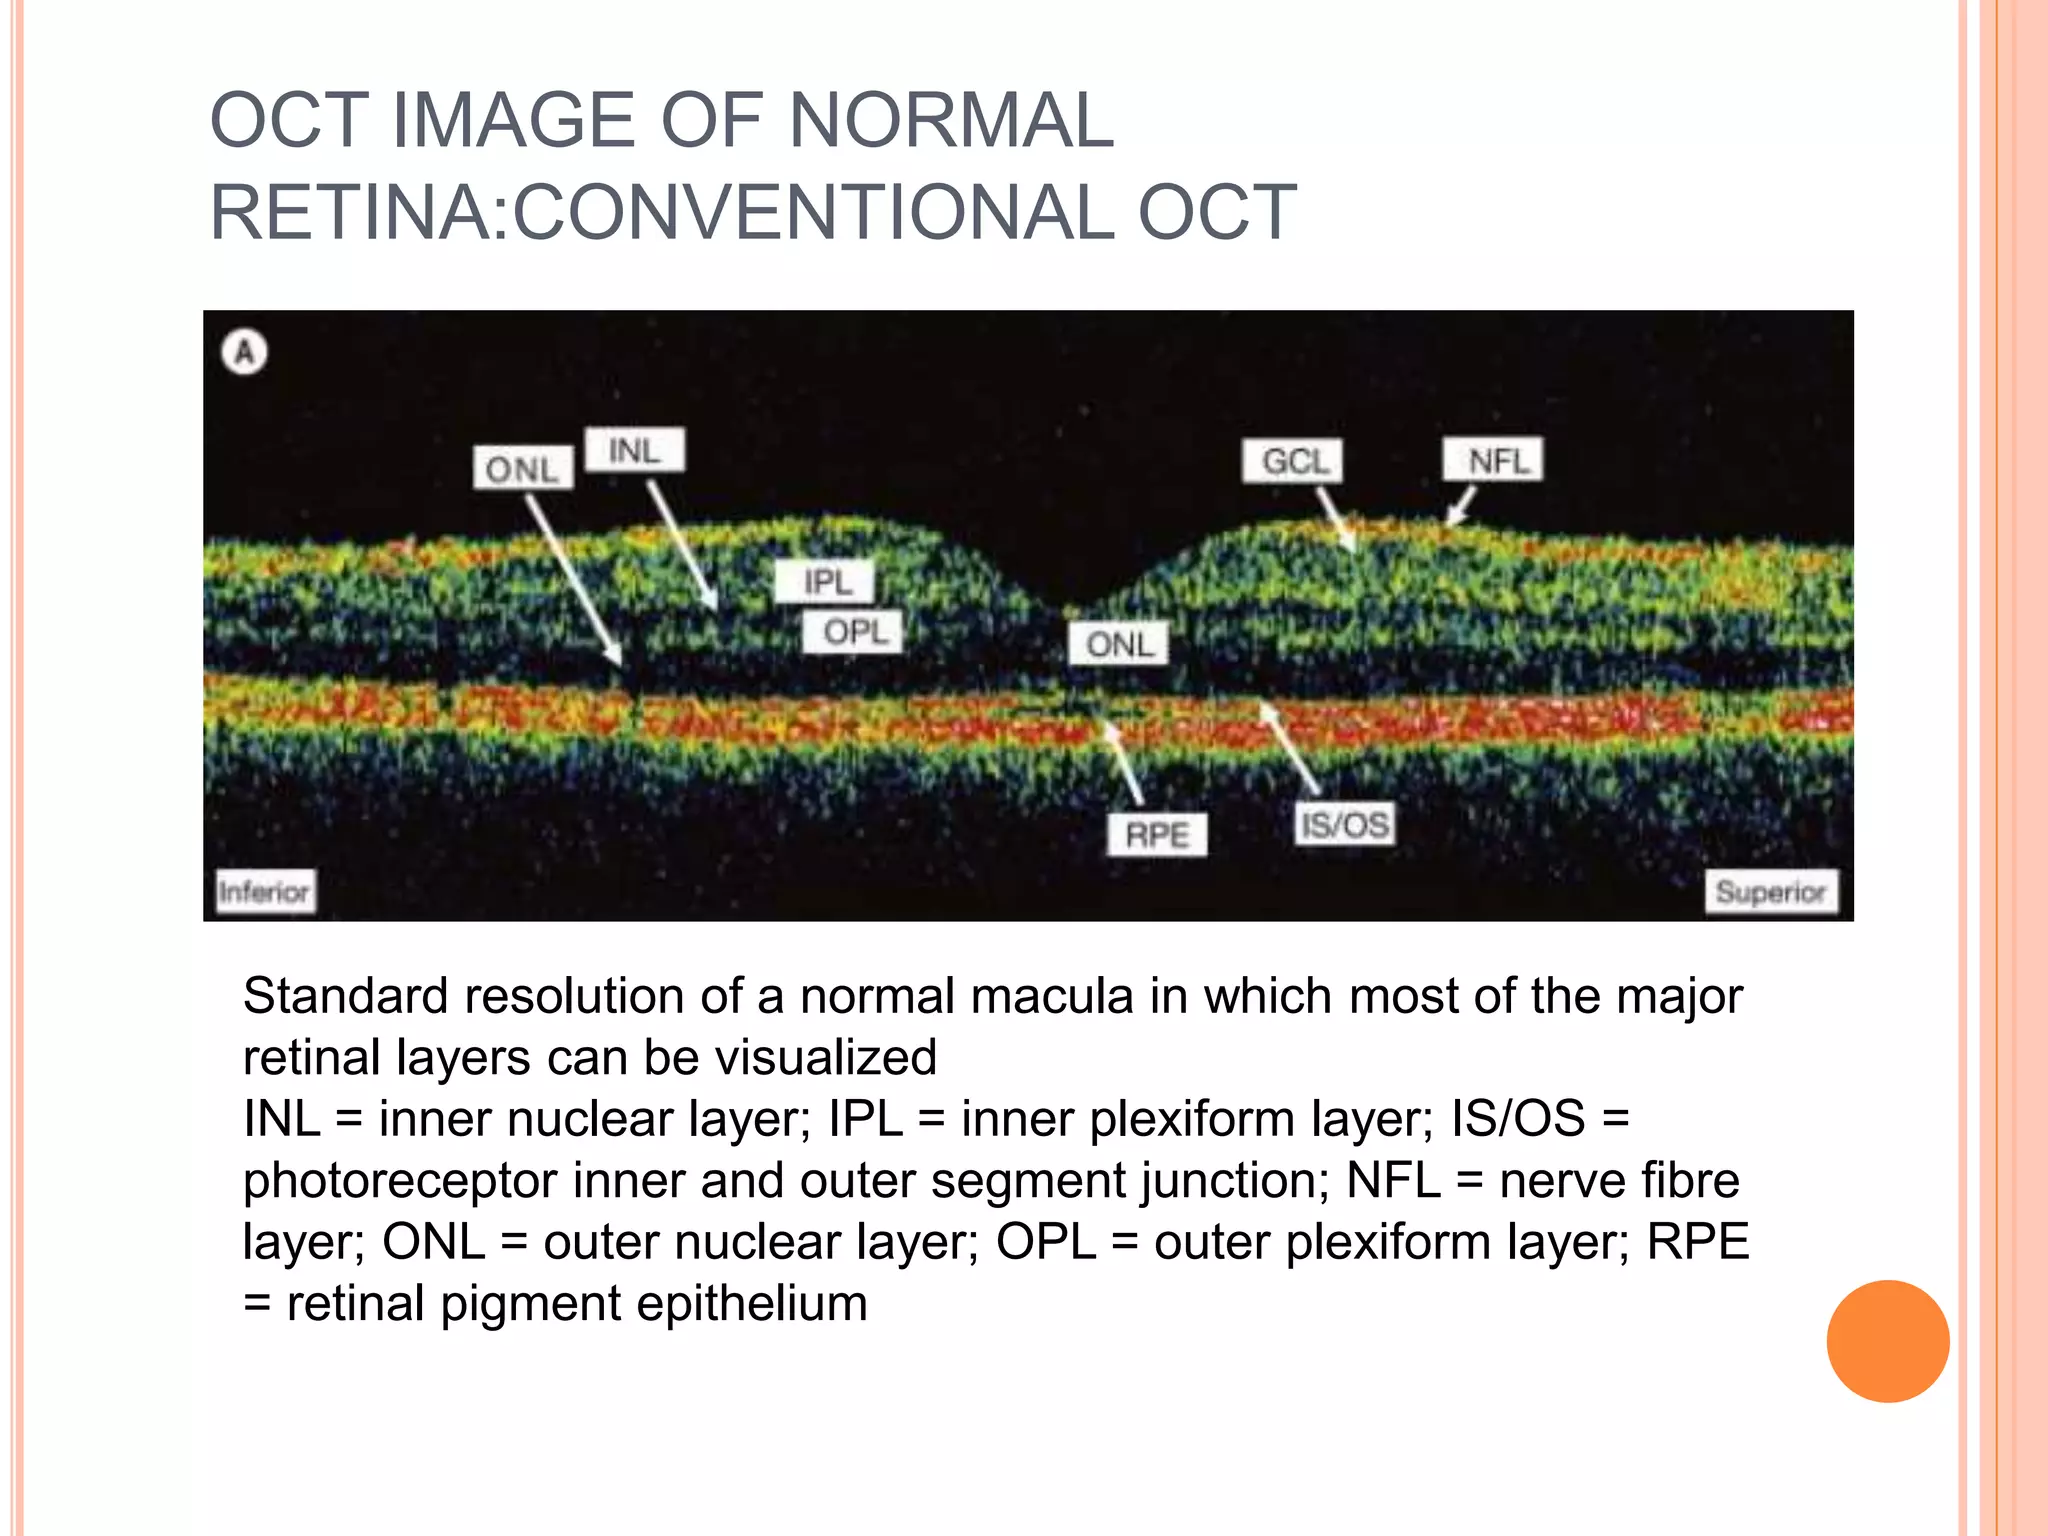
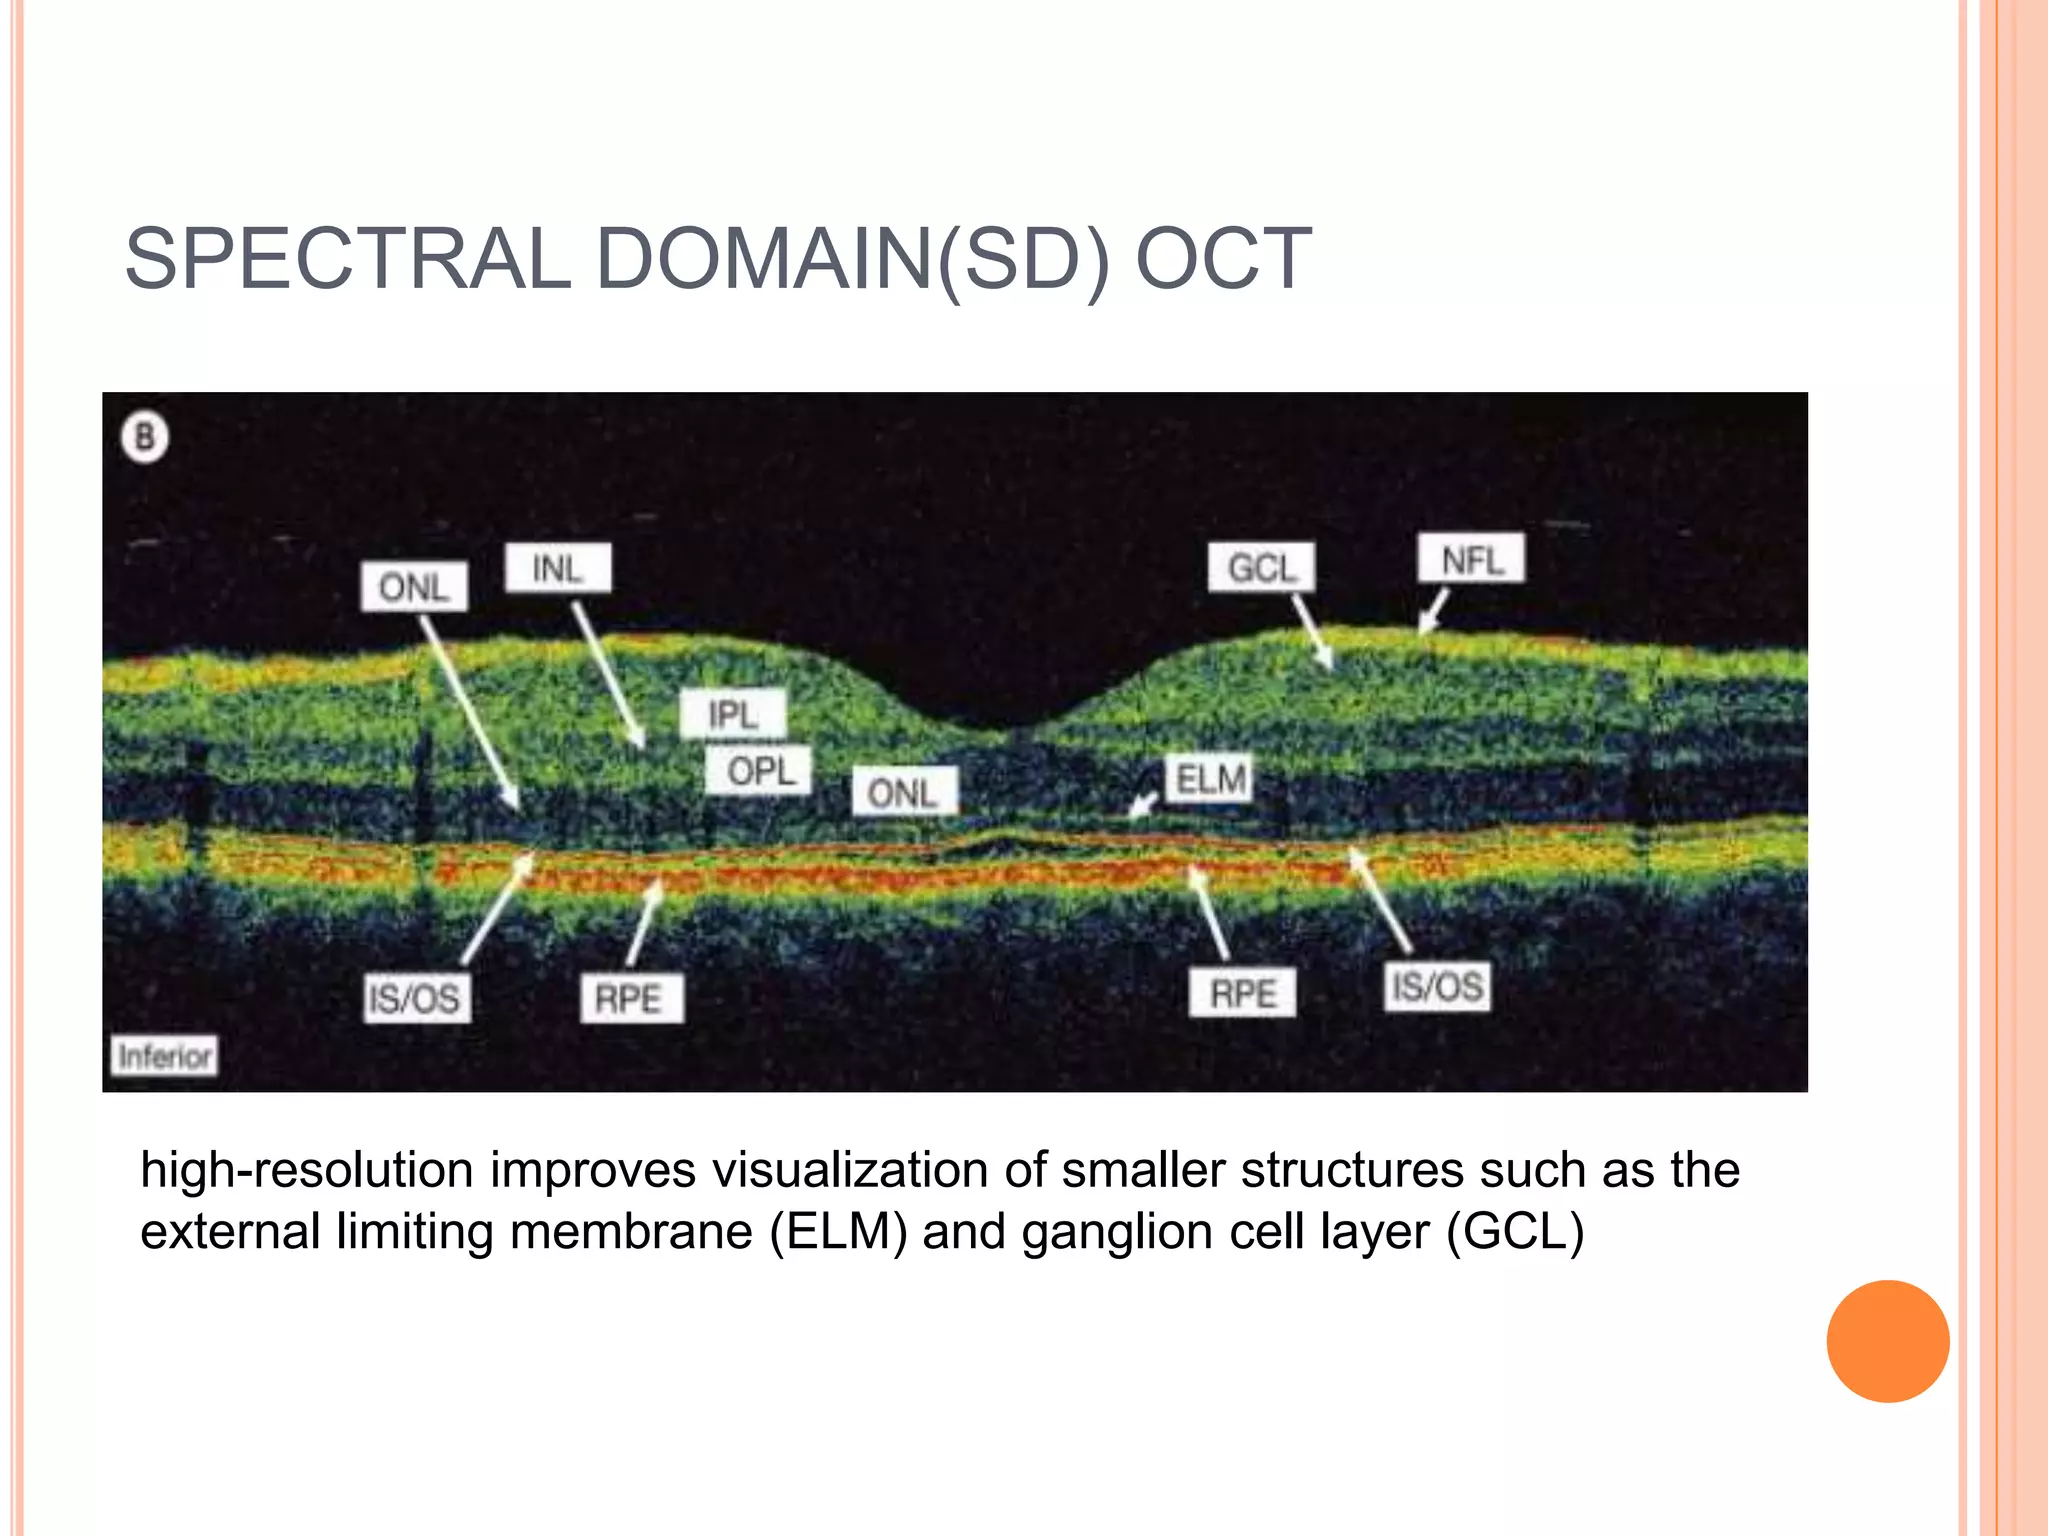
Optical coherence tomography (OCT) is a non-invasive imaging technique that uses light to generate high-resolution cross-sectional images of the retina and optic nerve. It provides detailed visualization of retinal structures on a microscopic scale. OCT is useful for diagnosing and monitoring various posterior segment diseases. It allows differentiation between stages of macular hole, detection of epiretinal membranes, and identification of fluid associated with neovascular age-related macular degeneration. Advances in spectral domain OCT technology have improved imaging speed and resolution, enabling clearer visualization of small retinal structures and layers.


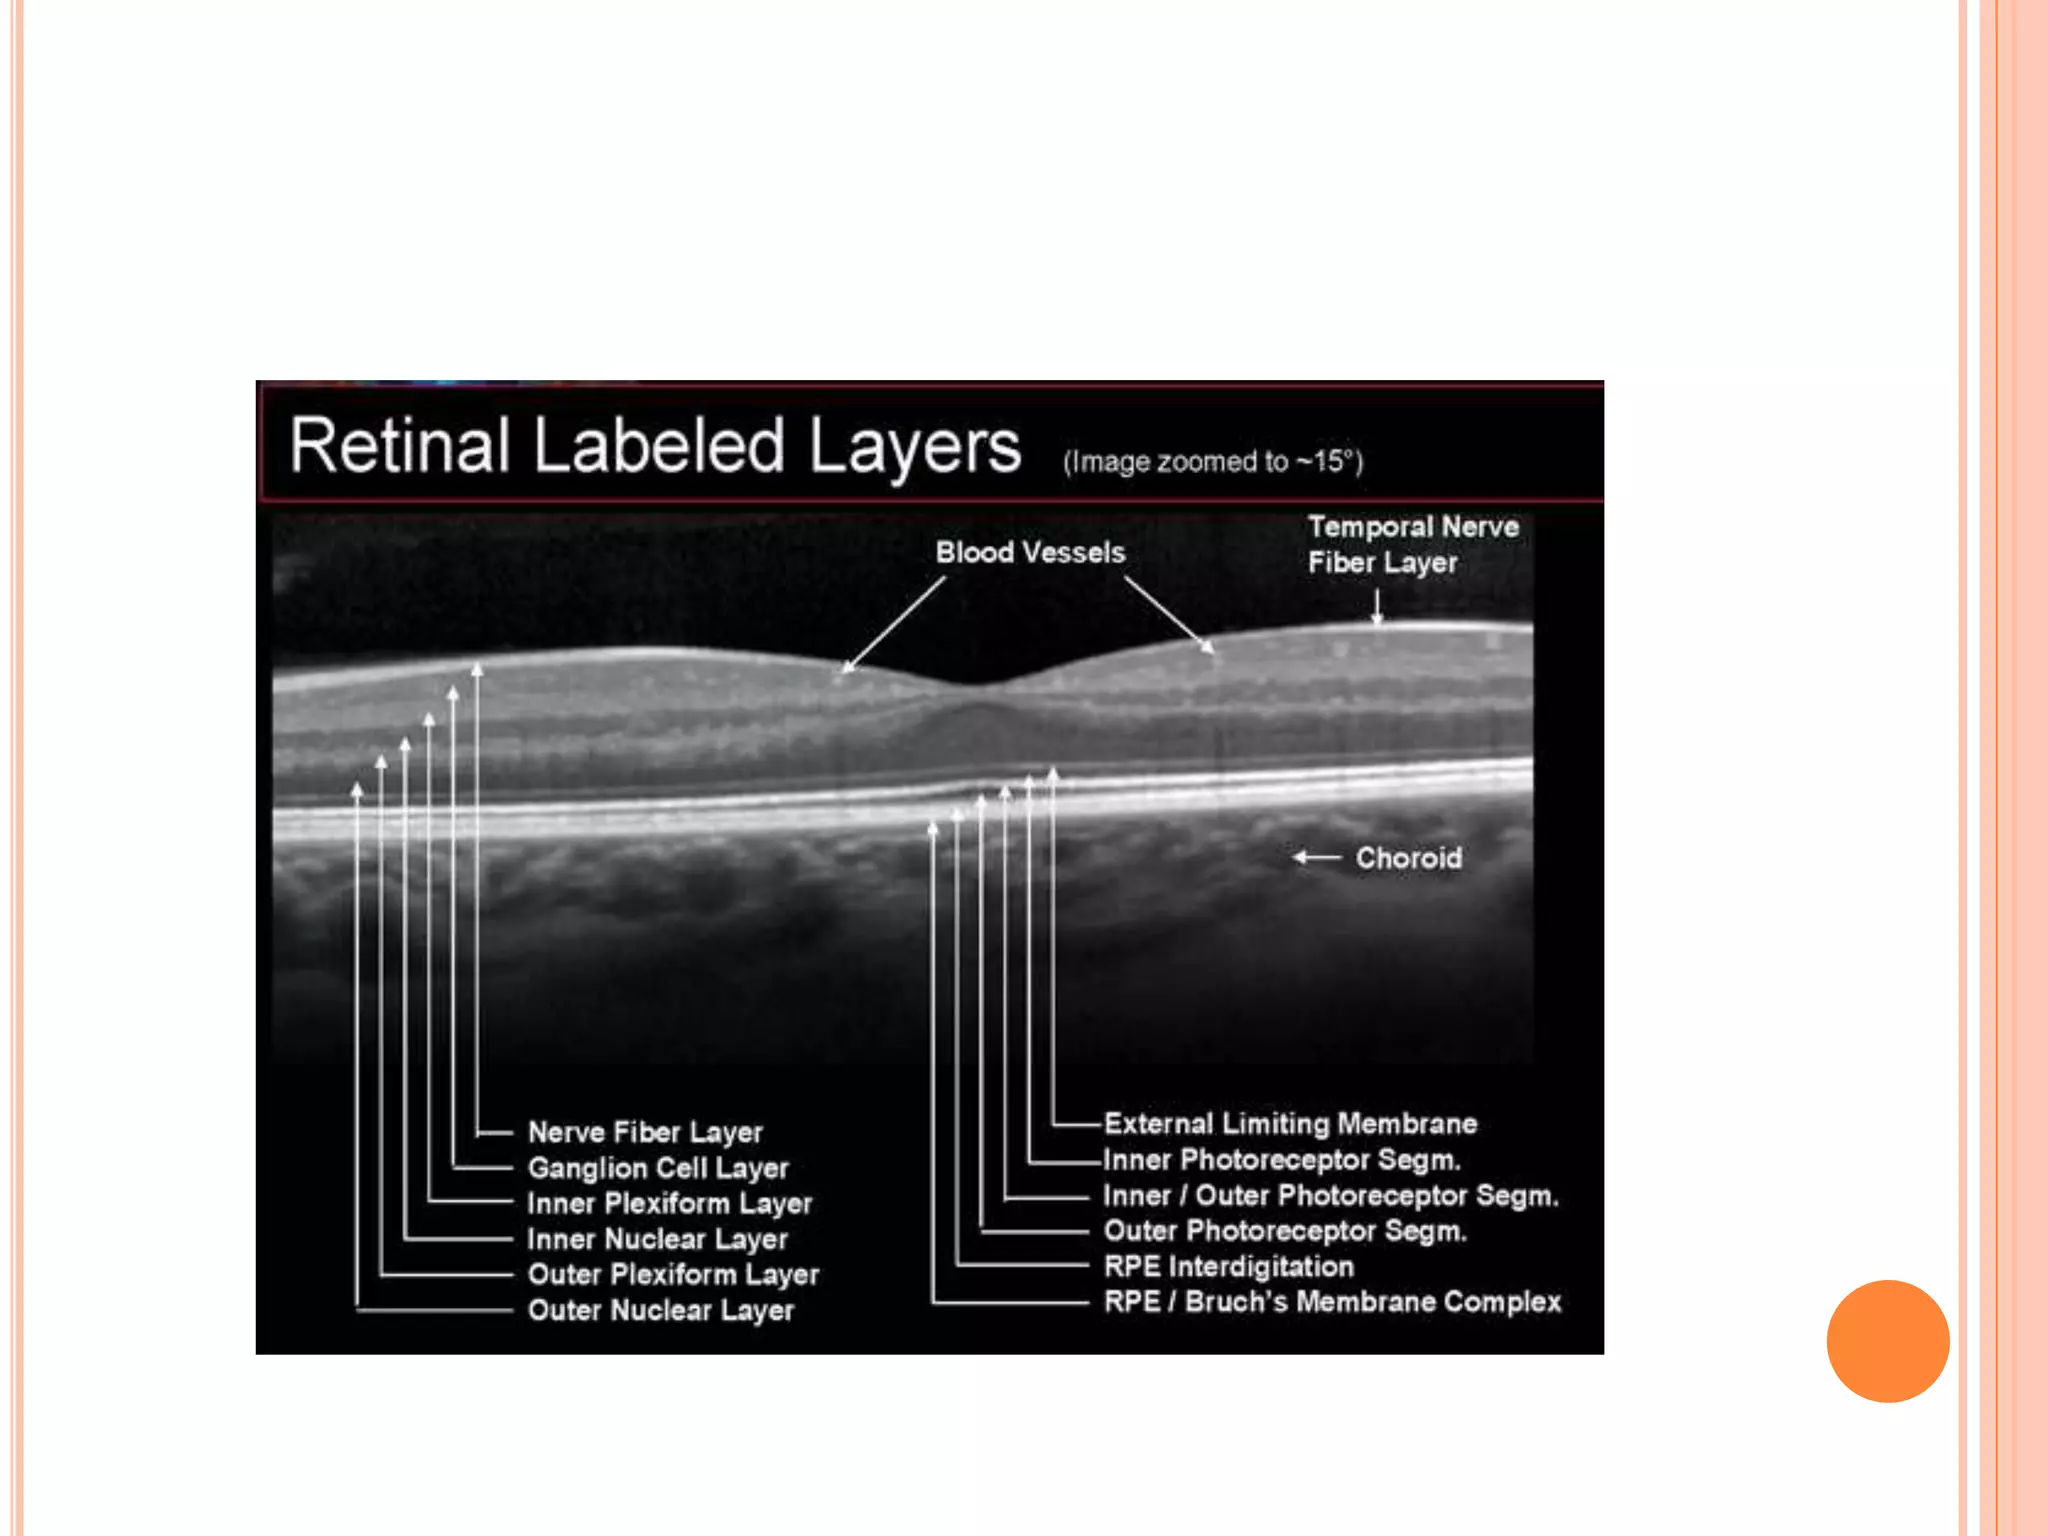
![ The standard color scale uses a modified continous
rainbow spectrum in which darker colors such as
blue and black represent regions of minimal or no
optical reflectivity, and lighter colors such as red
and white represent a relatively high reflectivity.
Studies have shown that the gray scale images are
easier to interpret and are more informative than
the color ones due to their improved ability to
visualise subtle retinal structures such as
photoreceptor inner and outer segment
junction[IS/OS] and subtle pathologies such as thin
epiretinal membranes.](https://image.slidesharecdn.com/octinposteriorsegmentdiseases-200326193458/75/Optical-Coherence-Tomography-OCT-in-posterior-segment-diseases-32-2048.jpg)