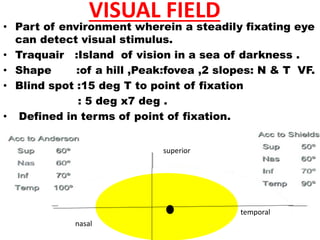
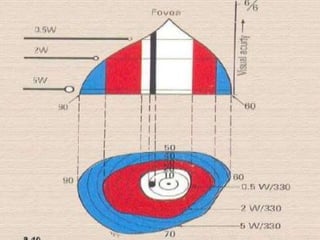
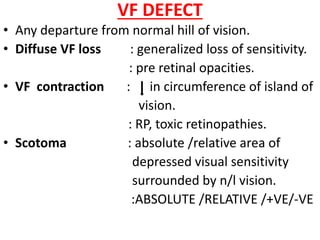
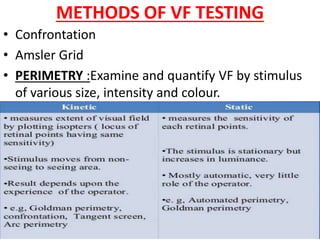
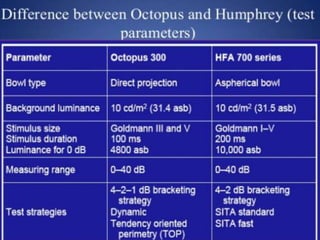
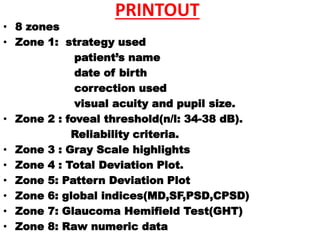
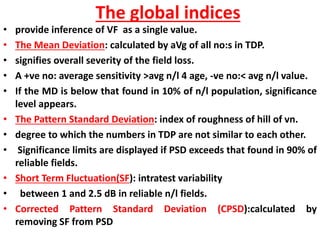
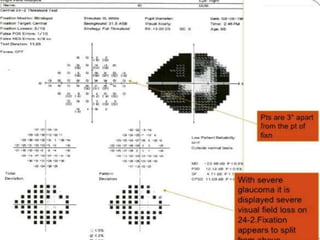
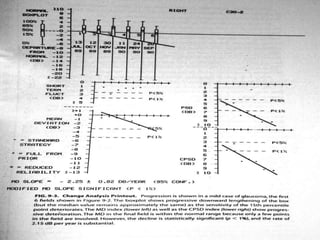
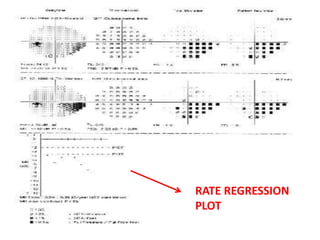
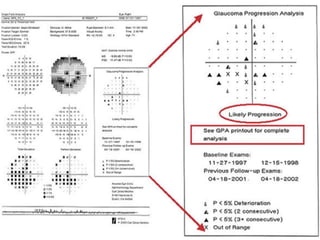
HFA
HFA
VISUAL FIELD
• Part of environment wherein a steadily fixating eye
can detect visual stimulus.
• Traquair :Island of vision in a sea of darkness .
• Shape :of a hill ,Peak:fovea ,2 slopes: N & T VF.
• Blind spot :15 deg T to point of fixation
: 5 deg x7 deg .
• Defined in terms of point of fixation.
nasal
temporal
superior
VF DEFECT
• Any departure from normal hill of vision.
• Diffuse VF loss : generalized loss of sensitivity.
: pre retinal opacities.
• VF contraction : in circumference of island of
vision.
: RP, toxic retinopathies.
• Scotoma : absolute /relative area of
depressed visual sensitivity
surrounded by n/l vision.
:ABSOLUTE /RELATIVE /+VE/-VE
• Central : ≤5 degrees from the point of fixation
• Paracentral :5 – 30 degrees
:Ceacal, paraceacal, periceacal
:Centrocecal
• Peripheral :>30 degrees
INDICATIONS OF VF TESTING
• Find out the extent of VF
• To diagnose and detect diseases as well as extent of
damage caused in VF by the disease
• To locate possible lesion in neurological disorder
• To find out the progression of diseases
METHODS OF VF TESTING
• Confrontation
• Amsler Grid
• PERIMETRY :Examine and quantify VF by stimulus
of various size, intensity and colour.
TERMS
• Threshold : The weakest test stimulus just visible
: Varies across the visual field.
• Sensitivity : subtle characteristics of a stimulus
visible at a specific point in space.
• Fixation : part of visual field corresponding to
fovea centralis.
• Isopter : Line connecting all points in the visual
field with the same threshold.
• Apostilb : measure of luminance (.3183cd/m²)
• Decibel :measure of sensitivity of retina
:0.1 log unit
10,000
1000
100
10
1
0
1 log unit 10
2 log units 20
3 log units 30
4 log units 40
MAX INTENSITY :GOLDMANN =1000 asb
:HFA =10000 asb
FUNDAMENTALS OF PERIMETRY MEASUREMENT
Spot Intensity
• The spot intensity is directly related to the bowl intensity
Background Illumination
• The standard value is 31.5 ASB.
• must remain constant throughout the test.
• Approximates minimum level for photopic vision.
• pupil size or clarity of media have no effect on Contrast/test
results.
Spot Duration
• The default time duration is 200mS + /– 10mS
• its visibility is independent of duration.
• latency for voluntary eye movement not present.
SPOT SIZE
Spot Size is smaller in the HFA II bowl than in
the HFA I, because the bowl radius is smaller.
SPOT SIZE : HFA II<HFA I, as THE BOWL RADIUS IS SMALLER.
TESTING STRATEGIES
1. THRESHOLD TESTING
• minimum amount of light that the eye can detect
at a particular point on the retina.
• 4-2 Bracketing to determines Threshold(staircase).
• Time consuming
• SF & LF
• Catch trials
30 dB
32dB
CATCH TRIALS
• Reliabilty indices
FIXATION LOSSES:
• Indicates steadiness of gaze
• HK blind spot/Observation by perimetrist/gaze monitor
• loss >20% is unreliable(xx)
FALSE POSITIVES
• Trigger happy /anxious patients
• >33% is unreliable
FALSE NEGATIVE:
• Fails to respond to a suprathreshold stimuli
• fatigue,inattentiveness
• Clover leaf model.
• >33% is unreliable
NEW THRESHOLD STRATEGIES
• FASTPAC (1991) : test time by 70% .
: 3-db increment .
:Threshold crossed only 1ce.
:errors & SF .
• SITA (1997)
SITA standard : Takes 50% time vs fastpac
SITA FAST : Takes 25% time vs FT
: only in HFA II
:Elderly ,fatigued
• information index,reaction time,post processing,
few catch trials time reduced
TESTING STRATEGIES
suprathreshold : intensity stimulus than needed
@ a spot is shown at that spot .
: For screening population.
: To diagnose gross neuro VFD.
: Useful for ptosis documentation.
:To calculate disability.
only 1 degree bare area is left surrounding the fixation spot
PRINTOUT
• 8 zones
• Zone 1: strategy used
patient’s name
date of birth
correction used
visual acuity and pupil size.
• Zone 2 : foveal threshold(n/l: 34-38 dB).
Reliability criteria.
• Zone 3 : Gray Scale highlights
• Zone 4 : Total Deviation Plot.
• Zone 5: Pattern Deviation Plot
• Zone 6: global indices(MD,SF,PSD,CPSD)
• Zone 7: Glaucoma Hemifield Test(GHT)
• Zone 8: Raw numeric data
The Grey Scale
• highlights areas which need to be looked in detail.
• For gross false positive or false negative errors.
• should not be used for diagnosis.
Total Deviation Plot
• point by point difference of the p/t’s threshold from expected age
corrected n/l.
• depicted by a numerical and a probability plot.
• ‘overall sinking` of VF by media opacity (cataract,RE,corneal
opacity,miosis.)
• On the Numerical Plot: 0 =p/t has expected threshold 4 age.
+ve no:=higher sensitivity
-ve no:=lower senstivity than the avg 4 age.
• The Probability Plot predict chances of abn/l in the n/l population.
• The blackest dot <0.5% of the n/l population
• highlights any scotoma that may be present, involving a large area
of the field.
The Pattern Deviation Plot
• exposes localized defects masked by generalized
depression/elevation of the hill of vision by making
an adjustment of the threshold according to
‘General Height` of the VF.
• Numerical and Probability Plots
• Of 51 points, 7th highest sensitivity value relative to
age n/l (85th percentile) =h8 of hill of vision.
• The deviation of this point from its n/l value is
subtracted from the deviation from normal of all
tested points.
• The pattern deviation of 7th best point =0
• In 10-2 pattern, all the points are considered.
The global indices
• provide inference of VF as a single value.
• The Mean Deviation: calculated by aVg of all no:s in TDP.
• signifies overall severity of the field loss.
• A +ve no: average sensitivity >avg n/l 4 age, -ve no:< avg n/l value.
• If the MD is below that found in 10% of n/l population, significance
level appears.
• The Pattern Standard Deviation: index of roughness of hill of vn.
• degree to which the numbers in TDP are not similar to each other.
• Significance limits are displayed if PSD exceeds that found in 90% of
reliable fields.
• Short Term Fluctuation(SF): intratest variability
• between 1 and 2.5 dB in reliable n/l fields.
• Corrected Pattern Standard Deviation (CPSD):calculated by
removing SF from PSD
Glaucoma Hemifield Test(GHT)
• 5 sectors in the upper field vs5 sectors in lower field which
are mirror images.
• Outside Normal Limit: At least 1sector pair’s score difference
> that found in 99% of the n/l population or the individual
zone scores in both members of any zone pair > than that
found in 99.5% of n/l population.
• Borderline: At least 1 zone pair difference exceeds that found
in 97% subjects.
• Generalized Reduction in sensitivity: If neither of the 2
conditions of ONL are met but General Height Calculation
shows the best part of the field to be depressed to a degree
that occurs in 0.5% of normal population.
• Abnormally High Senstivity: The General Height calculation
shows that best part of the field has higher sensitivity > that
found in 99.5% population.
• Within normal limits: If none of the above 4 conditions are
met.
Raw numeric data
• actual threshold score in decibels for each of the
tested points.
• Even if all the zones are n/l, but the c/f are very
suspicious, the actual threshold is inspected for
scotomata.
Anderson and Patella‘s Criteria
diagnostic of Glaucomatous Field
• Defect in absence of retinal/neurological disease
affecting the visual field:
1. Pattern Deviation Plot of 30-2 program, 3
contiguous non edge points p< 5% ,1 of it p<1% ,
not contiguous with the blind spot clustered
in arcuate area.
In 24-2 program, no need to ignore edge points.
2.CPSD (PSD in SITA) <5%.
3. GHT outside n/l limits.
EARLY DEFECT
• MD <-6dB
• < 25% of the points are depressed below the 5% level ,< 10 points
are depressed below the 1% level on pattern deviation plot.
• All points in the central 5 degrees must have a sensitivity of at least
15 dB.
• MODERATE DEFECT
• MD<-12dB
• < 50% of the points are depressed below the 5% level ,< 20 points
are depressed below the 1% level on pattern deviation plot.
• No points in the central 5 degrees have a sensitivity of 0dB.
• Only one hemifield may have a point with sensitivity of <15 dB in
5 degrees of fixation
• SEVERE DEFECT(ANY OF THE FOLLOWING)
• MD>-12dB
• > 50% of the points (37) are depressed below the 5% level or > 20
points are depressed below the 1% level on pattern deviation plot.
• At least one point in the central 5 degrees has a sensitivity of 0dB.
• Never rely on first report
• Always correlate clinically
• Correct any significant refractive error before
proceeding
• Sources of error
• Miosis: decreases the threshold sensitivity in peripheral
field Increases the variability in central field .
• Uncorrected refractive errors: Threshold sensitivity
appears less
• Hyperopic patient with contact lens: Defect magnified
& vice versa
• Spectacles can cause rim scotomas
• Ptosis : Suppression of superior visual field
DETECTING PROGRESSION
• Overview printout
• Sequential series of field of same patient over a period
of time
• Displays gray scales,raw data,total & pattern deviation
• Statistical analysis is however not provided.
• change analysis printout
• Using STATPAC analysis:analytical summary of all tests
p/t underwent.
• Not in SITA
• 3 components plotted over time:
• 1.Box plot in dB scale.
• 2.Summary of global indices
• 3.Linear regression analysis of mean deviation.
Glaucoma probability analysis
• Compares rate of change in p/ts visual field vs
stable glaucoma p/t.
• baseline is pattern deviation numerical &
probability plots.
• In SITA.
1. establish a baseline from PDNP depending on 1st
2 tests.
2.Establish the deviation plot in followup test printout
3.Establish progression analysis plot in followup test
printout.
• Criterias to b met:
• 2 baseline +1 followup min
• Each followup shud b compared with 2 baselines
exam’s avg thresholds.
• Additional followups are compared with both to
baseline and 2 most recent followups.
• Symbols:
X or : progressing point repeated in 3 consecutive test
:progression at 95% significance level.
:progressing point repeated in 2 consecutive tests.
if 3 in 1 test:possible progression.
If 3 in 1 test :likely progression.
Printout of GPA
• P/t name,age,DOB,test selected,eye tested.
• Followup tests with grey scale,PDPP,deviation from
baseline, progression analysis plot
• Foveal threshold,reliability indices at bottom of
each
• Rate regression plot with linear regression analysis
of MD .
• PSD
• GHT analysis
• Interpretation of analysis:likely/possible progression
RATE REGRESSION
PLOT
2 or more points deteriorate in 2 consecutive tests
Hfa
Hfa
Hfa

Hfa

  • 1.
  • 2.
    VISUAL FIELD • Partof environment wherein a steadily fixating eye can detect visual stimulus. • Traquair :Island of vision in a sea of darkness . • Shape :of a hill ,Peak:fovea ,2 slopes: N & T VF. • Blind spot :15 deg T to point of fixation : 5 deg x7 deg . • Defined in terms of point of fixation. nasal temporal superior
  • 4.
    VF DEFECT • Anydeparture from normal hill of vision. • Diffuse VF loss : generalized loss of sensitivity. : pre retinal opacities. • VF contraction : in circumference of island of vision. : RP, toxic retinopathies. • Scotoma : absolute /relative area of depressed visual sensitivity surrounded by n/l vision. :ABSOLUTE /RELATIVE /+VE/-VE
  • 5.
    • Central :≤5 degrees from the point of fixation • Paracentral :5 – 30 degrees :Ceacal, paraceacal, periceacal :Centrocecal • Peripheral :>30 degrees
  • 6.
    INDICATIONS OF VFTESTING • Find out the extent of VF • To diagnose and detect diseases as well as extent of damage caused in VF by the disease • To locate possible lesion in neurological disorder • To find out the progression of diseases
  • 7.
    METHODS OF VFTESTING • Confrontation • Amsler Grid • PERIMETRY :Examine and quantify VF by stimulus of various size, intensity and colour.
  • 10.
    TERMS • Threshold :The weakest test stimulus just visible : Varies across the visual field. • Sensitivity : subtle characteristics of a stimulus visible at a specific point in space. • Fixation : part of visual field corresponding to fovea centralis. • Isopter : Line connecting all points in the visual field with the same threshold. • Apostilb : measure of luminance (.3183cd/m²) • Decibel :measure of sensitivity of retina :0.1 log unit
  • 11.
    10,000 1000 100 10 1 0 1 log unit10 2 log units 20 3 log units 30 4 log units 40 MAX INTENSITY :GOLDMANN =1000 asb :HFA =10000 asb
  • 15.
    FUNDAMENTALS OF PERIMETRYMEASUREMENT Spot Intensity • The spot intensity is directly related to the bowl intensity Background Illumination • The standard value is 31.5 ASB. • must remain constant throughout the test. • Approximates minimum level for photopic vision. • pupil size or clarity of media have no effect on Contrast/test results. Spot Duration • The default time duration is 200mS + /– 10mS • its visibility is independent of duration. • latency for voluntary eye movement not present.
  • 16.
    SPOT SIZE Spot Sizeis smaller in the HFA II bowl than in the HFA I, because the bowl radius is smaller. SPOT SIZE : HFA II<HFA I, as THE BOWL RADIUS IS SMALLER.
  • 17.
    TESTING STRATEGIES 1. THRESHOLDTESTING • minimum amount of light that the eye can detect at a particular point on the retina. • 4-2 Bracketing to determines Threshold(staircase). • Time consuming • SF & LF • Catch trials 30 dB 32dB
  • 18.
    CATCH TRIALS • Reliabiltyindices FIXATION LOSSES: • Indicates steadiness of gaze • HK blind spot/Observation by perimetrist/gaze monitor • loss >20% is unreliable(xx) FALSE POSITIVES • Trigger happy /anxious patients • >33% is unreliable FALSE NEGATIVE: • Fails to respond to a suprathreshold stimuli • fatigue,inattentiveness • Clover leaf model. • >33% is unreliable
  • 21.
    NEW THRESHOLD STRATEGIES •FASTPAC (1991) : test time by 70% . : 3-db increment . :Threshold crossed only 1ce. :errors & SF . • SITA (1997) SITA standard : Takes 50% time vs fastpac SITA FAST : Takes 25% time vs FT : only in HFA II :Elderly ,fatigued • information index,reaction time,post processing, few catch trials time reduced
  • 22.
    TESTING STRATEGIES suprathreshold :intensity stimulus than needed @ a spot is shown at that spot . : For screening population. : To diagnose gross neuro VFD. : Useful for ptosis documentation. :To calculate disability.
  • 25.
    only 1 degreebare area is left surrounding the fixation spot
  • 28.
    PRINTOUT • 8 zones •Zone 1: strategy used patient’s name date of birth correction used visual acuity and pupil size. • Zone 2 : foveal threshold(n/l: 34-38 dB). Reliability criteria. • Zone 3 : Gray Scale highlights • Zone 4 : Total Deviation Plot. • Zone 5: Pattern Deviation Plot • Zone 6: global indices(MD,SF,PSD,CPSD) • Zone 7: Glaucoma Hemifield Test(GHT) • Zone 8: Raw numeric data
  • 30.
    The Grey Scale •highlights areas which need to be looked in detail. • For gross false positive or false negative errors. • should not be used for diagnosis. Total Deviation Plot • point by point difference of the p/t’s threshold from expected age corrected n/l. • depicted by a numerical and a probability plot. • ‘overall sinking` of VF by media opacity (cataract,RE,corneal opacity,miosis.) • On the Numerical Plot: 0 =p/t has expected threshold 4 age. +ve no:=higher sensitivity -ve no:=lower senstivity than the avg 4 age. • The Probability Plot predict chances of abn/l in the n/l population. • The blackest dot <0.5% of the n/l population • highlights any scotoma that may be present, involving a large area of the field.
  • 33.
    The Pattern DeviationPlot • exposes localized defects masked by generalized depression/elevation of the hill of vision by making an adjustment of the threshold according to ‘General Height` of the VF. • Numerical and Probability Plots • Of 51 points, 7th highest sensitivity value relative to age n/l (85th percentile) =h8 of hill of vision. • The deviation of this point from its n/l value is subtracted from the deviation from normal of all tested points. • The pattern deviation of 7th best point =0 • In 10-2 pattern, all the points are considered.
  • 35.
    The global indices •provide inference of VF as a single value. • The Mean Deviation: calculated by aVg of all no:s in TDP. • signifies overall severity of the field loss. • A +ve no: average sensitivity >avg n/l 4 age, -ve no:< avg n/l value. • If the MD is below that found in 10% of n/l population, significance level appears. • The Pattern Standard Deviation: index of roughness of hill of vn. • degree to which the numbers in TDP are not similar to each other. • Significance limits are displayed if PSD exceeds that found in 90% of reliable fields. • Short Term Fluctuation(SF): intratest variability • between 1 and 2.5 dB in reliable n/l fields. • Corrected Pattern Standard Deviation (CPSD):calculated by removing SF from PSD
  • 37.
    Glaucoma Hemifield Test(GHT) •5 sectors in the upper field vs5 sectors in lower field which are mirror images. • Outside Normal Limit: At least 1sector pair’s score difference > that found in 99% of the n/l population or the individual zone scores in both members of any zone pair > than that found in 99.5% of n/l population. • Borderline: At least 1 zone pair difference exceeds that found in 97% subjects. • Generalized Reduction in sensitivity: If neither of the 2 conditions of ONL are met but General Height Calculation shows the best part of the field to be depressed to a degree that occurs in 0.5% of normal population. • Abnormally High Senstivity: The General Height calculation shows that best part of the field has higher sensitivity > that found in 99.5% population. • Within normal limits: If none of the above 4 conditions are met.
  • 39.
    Raw numeric data •actual threshold score in decibels for each of the tested points. • Even if all the zones are n/l, but the c/f are very suspicious, the actual threshold is inspected for scotomata.
  • 40.
    Anderson and Patella‘sCriteria diagnostic of Glaucomatous Field • Defect in absence of retinal/neurological disease affecting the visual field: 1. Pattern Deviation Plot of 30-2 program, 3 contiguous non edge points p< 5% ,1 of it p<1% , not contiguous with the blind spot clustered in arcuate area. In 24-2 program, no need to ignore edge points. 2.CPSD (PSD in SITA) <5%. 3. GHT outside n/l limits.
  • 41.
    EARLY DEFECT • MD<-6dB • < 25% of the points are depressed below the 5% level ,< 10 points are depressed below the 1% level on pattern deviation plot. • All points in the central 5 degrees must have a sensitivity of at least 15 dB. • MODERATE DEFECT • MD<-12dB • < 50% of the points are depressed below the 5% level ,< 20 points are depressed below the 1% level on pattern deviation plot. • No points in the central 5 degrees have a sensitivity of 0dB. • Only one hemifield may have a point with sensitivity of <15 dB in 5 degrees of fixation • SEVERE DEFECT(ANY OF THE FOLLOWING) • MD>-12dB • > 50% of the points (37) are depressed below the 5% level or > 20 points are depressed below the 1% level on pattern deviation plot. • At least one point in the central 5 degrees has a sensitivity of 0dB.
  • 44.
    • Never relyon first report • Always correlate clinically • Correct any significant refractive error before proceeding • Sources of error • Miosis: decreases the threshold sensitivity in peripheral field Increases the variability in central field . • Uncorrected refractive errors: Threshold sensitivity appears less • Hyperopic patient with contact lens: Defect magnified & vice versa • Spectacles can cause rim scotomas • Ptosis : Suppression of superior visual field
  • 46.
    DETECTING PROGRESSION • Overviewprintout • Sequential series of field of same patient over a period of time • Displays gray scales,raw data,total & pattern deviation • Statistical analysis is however not provided. • change analysis printout • Using STATPAC analysis:analytical summary of all tests p/t underwent. • Not in SITA • 3 components plotted over time: • 1.Box plot in dB scale. • 2.Summary of global indices • 3.Linear regression analysis of mean deviation.
  • 51.
    Glaucoma probability analysis •Compares rate of change in p/ts visual field vs stable glaucoma p/t. • baseline is pattern deviation numerical & probability plots. • In SITA. 1. establish a baseline from PDNP depending on 1st 2 tests. 2.Establish the deviation plot in followup test printout 3.Establish progression analysis plot in followup test printout. • Criterias to b met: • 2 baseline +1 followup min
  • 52.
    • Each followupshud b compared with 2 baselines exam’s avg thresholds. • Additional followups are compared with both to baseline and 2 most recent followups. • Symbols: X or : progressing point repeated in 3 consecutive test :progression at 95% significance level. :progressing point repeated in 2 consecutive tests. if 3 in 1 test:possible progression. If 3 in 1 test :likely progression.
  • 53.
    Printout of GPA •P/t name,age,DOB,test selected,eye tested. • Followup tests with grey scale,PDPP,deviation from baseline, progression analysis plot • Foveal threshold,reliability indices at bottom of each • Rate regression plot with linear regression analysis of MD . • PSD • GHT analysis • Interpretation of analysis:likely/possible progression
  • 54.
  • 56.
    2 or morepoints deteriorate in 2 consecutive tests