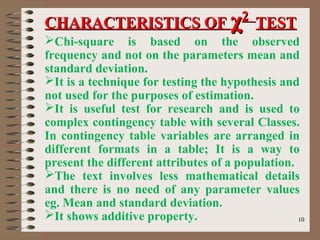
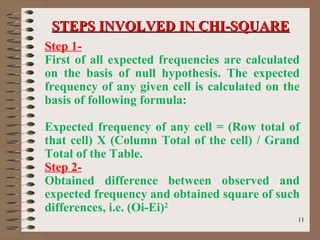
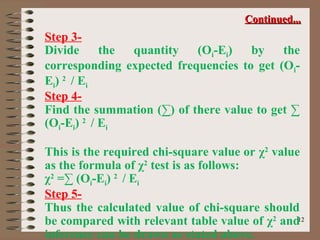
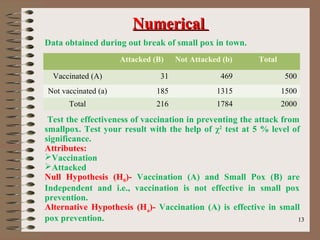
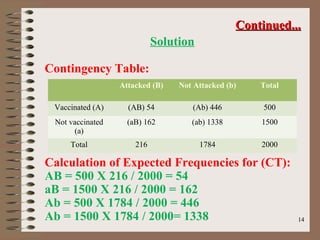
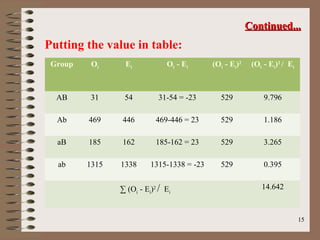
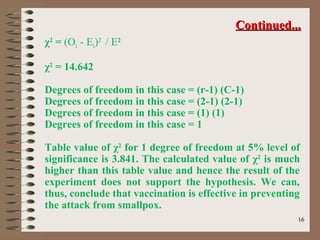
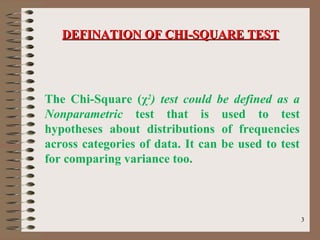
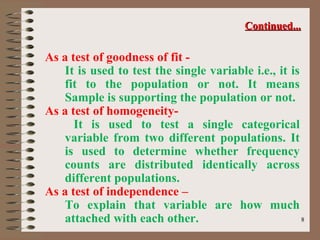
The Chi-Square (χ2) test is a nonparametric test used to test hypotheses about frequency distributions across categories. It can test for independence and compare variances. The key steps are: 1) Calculate expected frequencies under the null hypothesis, 2) Calculate the differences between observed and expected frequencies, 3) Sum the squared differences divided by the expected values to get the chi-square statistic, 4) Compare this statistic to critical values from the chi-square distribution to determine significance. An example tests if vaccination prevents smallpox attacks, finding the results do not support independence between vaccination status and attacks, suggesting vaccination is effective.
This presentation contains information about Mann Whitney U test, what is it, when to use it and how to use it. I have also put an example so that it may help you to easily understand it.
A binomial random variable is the number of successes x in n repeated trials of a binomial experiment. The probability distribution of a binomial random variable is called a binomial distribution. Suppose we flip a coin two times and count the number of heads (successes).
Standard error is used in the place of deviation. it shows the variations among sample is correlate to sampling error. list of formula used for standard error for different statistics and applications of tests of significance in biological sciences
Sample presentation of culture assessment survey resultsJoe Tye
Before I conduct a leadership retreat I typically conduct a Culture Assessment Survey so that I can share results with the group. This is a typical excerpt from a presentation with specific organizational identity removed
Categorical Data and Statistical AnalysisMichael770443
In this presentation, we will introduce two tests and hypothesis testing based on it, and different non-parametric methods such as the Kolmogorov-Smirnov test, the Wilcoxon’s signed-rank test, the Mann-Whitney U test, and the Kruskal-Wallis test.
Quantitative Analysis for Emperical ResearchAmit Kamble
Overview for Approach Methods for quantitative analysis; which includes
1) Planning of Experiments
2) Data Generation
3) presentation of report
some numerical approach methods; data modeling; hypothesis methods
Please Subscribe to this Channel for more solutions and lectures
http://www.youtube.com/onlineteaching
Chapter 11: Goodness-of-Fit and Contingency Tables
11.2: Contingency Tables
linearity concept of significance, standard deviation, chi square test, stude...KavyasriPuttamreddy
Linearity concept of significance, standard deviation, chi square test, students T- test, ANOVA test , pharmaceutical science, statistical analysis, statistical methods, optimization technique, modern pharmaceutics, pharmaceutics, mpharm 1 unit i sem, 1 year m
pharm, applications of chi square test, application of standard deviation , pharmacy, method to compare dissolution profile, statistical analysis of dissolution profile, important statical analysis, m. pharmacy, graphical representation of standard deviation, graph of chi square test, graph of T test , graph of ANOVA test ,formulation of t test, formulation of chi square test, formula of standard deviation.
Similar to Chi square test final presentation (20)
Macroeconomics- Movie Location
This will be used as part of your Personal Professional Portfolio once graded.
Objective:
Prepare a presentation or a paper using research, basic comparative analysis, data organization and application of economic information. You will make an informed assessment of an economic climate outside of the United States to accomplish an entertainment industry objective.
Read| The latest issue of The Challenger is here! We are thrilled to announce that our school paper has qualified for the NATIONAL SCHOOLS PRESS CONFERENCE (NSPC) 2024. Thank you for your unwavering support and trust. Dive into the stories that made us stand out!
Instructions for Submissions thorugh G- Classroom.pptxJheel Barad
This presentation provides a briefing on how to upload submissions and documents in Google Classroom. It was prepared as part of an orientation for new Sainik School in-service teacher trainees. As a training officer, my goal is to ensure that you are comfortable and proficient with this essential tool for managing assignments and fostering student engagement.
Model Attribute Check Company Auto PropertyCeline George
In Odoo, the multi-company feature allows you to manage multiple companies within a single Odoo database instance. Each company can have its own configurations while still sharing common resources such as products, customers, and suppliers.
How to Make a Field invisible in Odoo 17Celine George
It is possible to hide or invisible some fields in odoo. Commonly using “invisible” attribute in the field definition to invisible the fields. This slide will show how to make a field invisible in odoo 17.
2024.06.01 Introducing a competency framework for languag learning materials ...Sandy Millin
http://sandymillin.wordpress.com/iateflwebinar2024
Published classroom materials form the basis of syllabuses, drive teacher professional development, and have a potentially huge influence on learners, teachers and education systems. All teachers also create their own materials, whether a few sentences on a blackboard, a highly-structured fully-realised online course, or anything in between. Despite this, the knowledge and skills needed to create effective language learning materials are rarely part of teacher training, and are mostly learnt by trial and error.
Knowledge and skills frameworks, generally called competency frameworks, for ELT teachers, trainers and managers have existed for a few years now. However, until I created one for my MA dissertation, there wasn’t one drawing together what we need to know and do to be able to effectively produce language learning materials.
This webinar will introduce you to my framework, highlighting the key competencies I identified from my research. It will also show how anybody involved in language teaching (any language, not just English!), teacher training, managing schools or developing language learning materials can benefit from using the framework.
Francesca Gottschalk - How can education support child empowerment.pptxEduSkills OECD
Francesca Gottschalk from the OECD’s Centre for Educational Research and Innovation presents at the Ask an Expert Webinar: How can education support child empowerment?
Home assignment II on Spectroscopy 2024 Answers.pdf
Chi square test final presentation
1. χ 2 (chi - square) Test: as a test of Independenceχ 2 (chi - square) Test: as a test of Independence
condition of application of chi - square testcondition of application of chi - square test
&&
steps involvedsteps involved
------------------------------------------------------------------------------------------------------
A
2. DEFINITION OF CHI-SQUARE TEST
INTRODUCTION TO CHI-SQUARE TEST
CHI-SQUARE AS A TEST FOR COMPARING VARIANCE
CHI-SQUARE AS A NON-PARAMETRIC TEST
CONDITIONS FOR THE APPLICATION OF χ2 TEST
CHARACTERISTICS OF χ2
TEST
STEPS INVOLVED IN APPLYING CHI-SQUARE TEST AND
A NUEMERICAL TO EXPLAIN
SIGNIFICANCE OF CHI SQUARE TEST
ONE TAILED AND TWO TAILED TESTS
CONCLUSION
REFERENCES
CONTENTS:CONTENTS:
3. 33
The Chi-Square (χ2
) test could be defined as a
Nonparametric test that is used to test
hypotheses about distributions of frequencies
across categories of data. It can be used to test
for comparing variance too.
DEFINATION OF CHI-SQUARE TESTDEFINATION OF CHI-SQUARE TEST
4. 44
We often have occasions to make comparisons
between two characteristics of something to see
if they are linked or related to each other.
One way to do this is to work out what we
would expect to find if there was no relationship
between them (the usual null hypothesis) and
what we actually observe.
The test we use to measure the differences
between what is observed and what is expected
according to an assumed hypothesis is called
the chi-square test.
INTRODUCTION TO CHI-SQUARE TESTINTRODUCTION TO CHI-SQUARE TEST
5. 55
The chi-square test is often used to judge the
significance of population variance.
Formula of Chi-square test of comparing
variance:
χ2
= σ2
s /σ2
p (n-1)
Where
σ2
s = variance of the sample
σ2
p = variance of the population
(n-1) = degree of freedom, n being the number
of items in the sample.
CHI-SQUARE TEST AS A TEST FORCHI-SQUARE TEST AS A TEST FOR
COMPARING VARIANCECOMPARING VARIANCE
7. 77
Chi-square is an important test and as such no
rigid assumptions are necessary in respect of
the type of population. We require only the
degree of freedom (implicitly of course the size
of the sample) for using this test. As a non-
parametric test, chi square can be used (i) as a
test of goodness of fit, (ii) as a test of
homogeniety and (iii) as a test of independence.
CHI-SQUARE AS A NON-PARAMETRIC TESTCHI-SQUARE AS A NON-PARAMETRIC TEST
8. 88
As a test of goodness of fit -
It is used to test the single variable i.e., it is
fit to the population or not. It means
Sample is supporting the population or not.
As a test of homogeneity-
It is used to test a single categorical
variable from two different populations. It
is used to determine whether frequency
counts are distributed identically across
different populations.
As a test of independence –
To explain that variable are how much
attached with each other.
Continued...Continued...
9. 99
There must be two observed set of data or one
observed set and one expected set [generally
there are n - rows and c - columns].
The number of observations or items must be
reasonably large [i.e., normally equal or greater
than 50].
Expected frequency should not be very small
should not be less than five.
Observations recorded and used are collected
on random basis.
All the times in the sample must be
independent.
CONDITIONS FOR THE APPLICATIONS OFCONDITIONS FOR THE APPLICATIONS OF
χχ22
TESTTEST
10. 1010
Chi-square is based on the observed
frequency and not on the parameters mean and
standard deviation.
It is a technique for testing the hypothesis and
not used for the purposes of estimation.
It is useful test for research and is used to
complex contingency table with several Classes.
In contingency table variables are arranged in
different formats in a table; It is a way to
present the different attributes of a population.
The text involves less mathematical details
and there is no need of any parameter values
eg. Mean and standard deviation.
It shows additive property.
CHARACTERISTICS OFCHARACTERISTICS OF χχ22
TESTTEST
11. 1111
Step 1-
First of all expected frequencies are calculated
on the basis of null hypothesis. The expected
frequency of any given cell is calculated on the
basis of following formula:
Expected frequency of any cell = (Row total of
that cell) X (Column Total of the cell) / Grand
Total of the Table.
Step 2-
Obtained difference between observed and
expected frequency and obtained square of such
differences, i.e. (Oi-Ei)2
STEPS INVOLVED IN CHI-SQUARESTEPS INVOLVED IN CHI-SQUARE
12. 1212
Step 3-
Divide the quantity (Oi-Ei) by the
corresponding expected frequencies to get (Oi-
Ei) 2
/ Ei
Step 4-
Find the summation (∑) of there value to get ∑
(Oi-Ei) 2
/ Ei
This is the required chi-square value or χ2
value
as the formula of χ2
test is as follows:
χ2
=∑ (Oi-Ei) 2
/ Ei
Step 5-
Thus the calculated value of chi-square should
be compared with relevant table value of χ2
and
inference can be drawn as stated above.
Continued...Continued...
13. 1313
Data obtained during out break of small pox in town.
Test the effectiveness of vaccination in preventing the attack from
smallpox. Test your result with the help of χ2
test at 5 % level of
significance.
Attributes:
Vaccination
Attacked
Null Hypothesis (H0)- Vaccination (A) and Small Pox (B) are
Independent and i.e., vaccination is not effective in small pox
prevention.
Alternative Hypothesis (Ha)- Vaccination (A) is effective in small
pox prevention.
NumericalNumerical
Attacked (B) Not Attacked (b) Total
Vaccinated (A) 31 469 500
Not vaccinated (a) 185 1315 1500
Total 216 1784 2000
14. 1414
Solution
Contingency Table:
Calculation of Expected Frequencies for (CT):
AB = 500 X 216 / 2000 = 54
aB = 1500 X 216 / 2000 = 162
Ab = 500 X 1784 / 2000 = 446
Ab = 1500 X 1784 / 2000= 1338
Continued...Continued...
Attacked (B) Not Attacked (b) Total
Vaccinated (A) (AB) 54 (Ab) 446 500
Not vaccinated
(a)
(aB) 162 (ab) 1338 1500
Total 216 1784 2000
15. 1515
Putting the value in table:
Continued...Continued...
Group Oi Ei Oi - Ei (Oi - Ei)2
(Oi - Ei)2
/ Ei
AB 31 54 31-54 = -23 529 9.796
Ab 469 446 469-446 = 23 529 1.186
aB 185 162 185-162 = 23 529 3.265
ab 1315 1338 1315-1338 = -23 529 0.395
∑ (Oi - Ei)2
/ Ei
14.642
16. 1616
χ2
= (Oi - Ei)2
/ E2
χ2
= 14.642
Degrees of freedom in this case = (r-1) (C-1)
Degrees of freedom in this case = (2-1) (2-1)
Degrees of freedom in this case = (1) (1)
Degrees of freedom in this case = 1
Table value of χ2
for 1 degree of freedom at 5% level of
significance is 3.841. The calculated value of χ2
is much
higher than this table value and hence the result of the
experiment does not support the hypothesis. We can,
thus, conclude that vaccination is effective in preventing
the attack from smallpox.
Continued...Continued...
17. 1717
SIGNIFICANCE OF THE CHI-SQUARE TEST IS AS
FOLLOW:
It is very useful to check the Interdependence of two variables on
each other.
Chi Square can also be used to test differences between two or
more actual samples.
Being a nonparametric tests chi-square test is much easier to
compute, and also to apply.
The Chi Square (X2
) test is undoubtedly the most important and
most used member of the nonparametric family of statistical tests.
Chi Square is employed to test the difference between an actual
sample and another hypothetical or previously established
distribution such as that which may be expected due to chance or
probability.
Chi square test can be used to treat data which have been
measured on nominal (classificatory) scales. Such data cannot, on
any logical basis, be ordered numerically, hence there is no
possibility of using parametric statistical tests which require
numerical data.
SIGNIFICANCE OF CHI-SQUARE TESTSIGNIFICANCE OF CHI-SQUARE TEST
18. 1818
As conclusion we can say that the chi-square
test is an important test amongst the several
tests of significance developed by statisticians.
Being a non-parametric test It’s calculations
are easier than other tests. It tests for effect of
one variable over the other, hence it is very
helpful to understand the effectiveness of
products. It is very useful for all researchers to
Test goodness of fit.
Test the significance of association between
two attributes.
Test the homogeneity or the significance of
population variance.
ConclusionConclusion
19. 1919
Fundamentals of Statistics by Elhance, D.N., Elhance,
Veena and Aggarwal, B.M., Published by Kitab Mahal
Introduction to statistics by Hooda, R.P., Published
by McMillan Publishing
Research Methodology: methods and techniques by
Kothari, C.R., Published by New Age International
Class notes of Mdm. Aarti joshi
ReferencesReferences