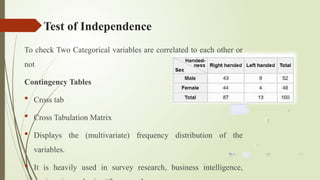
Government College University Faisalabad
Chi-Square Test
Presented to :
Sir Irfan Ali Raza
Presented by :
Irum Arshad (247124)
Zunaira Hameed (247121)
Maria Batool (247122)
Musaab Sohail (247130)
Chi-Square Test (non parametric Test)
 A chi-square (x²) statistic is a test that measures how Expectations
compare to actual observed data.
 Data Collected (Observed) ← === → Data Predicted (Expected)
 Null Hypothesis Observed = Expected
 Alternate Hypothesis → Observed ≠ Expected
CHI Square performs Two types of Test
 Goodness of Fit Test
 (Single C Variable)
 The test of independence
 (Between Multiple C Variables)
Goodness of fit test
The goodness of fit test is a statistical hypothesis test to see how well sample
data fit a distribution from a population with a normal distribution. Fit Test
Defining a Null and Alternate Hypothesis
 Null Hypothesis: ratio of 50-50 exists in office
 Alternate Hypothesis in office: Raito of 50:50 is not there.
 Males employees < Female Employees
 Males employees >Female Employees
Continue….
 Calculated Chi-Square value = 1.8
 Critical Value from the Chart = 3.8
 If calculated Chi-Square value </= the value in chart We can not
reject the null Hypothesis.
 Null Hypothesis Observed = Expected
 Alternate Hypothesis Observed ≠ Expected
Test of Independence
To check Two Categorical variables are correlated to each other or
not
Contingency Tables
 Cross tab
 Cross Tabulation Matrix
 Displays the (multivariate) frequency distribution of the
variables.
 It is heavily used in survey research, business intelligence,
Steps to find independence of Variables

Step 1:
Define Null and Alternate Hypothesis
 Null Hypothesis: NO relation between gender and favorite ruling party.
 If calculated Chi-Square value </= the value in chart. We can not reject
the null Hypothesis.
 Alternate Hypothesis in school: there is relation between gender and
favorite ruling party
Why we use the Chi-Square test
Purpose of the Chi-Square test
 The Chi-Square test is used due to the following reasons
 To handle non-numeric data.
 To test the validity of assumptions.
 To apply in a wide range of fields.
 To support decision-making based on Data.
 To compare expected and observed frequencies.
 To identify significant deviations from hypothesis.
 To test relationships between categorical variables.
Main reasons for using the test
The key reasons behind using the Chi-Square test are mentioned below
 To test goodness of fit.
 To make evidence-based decisions.
 To handle large sample sizes easily.
 To Identify non-random associations.
 To test the Independence between variables.
 To validate hypotheses in categorical data.
Importance
The Chi-Square test has gained importance due to following
reasons
 Simplicity: Easy to calculate and interpret.
 Versatility: Applies to many fields like health, marketing,
and education.
 Objectivity: Replaces guesswork with statistical evidence.
 Non-parametric: Doesn’t assume normal distribution —
great for categorical data.
When we use Chi-Square Test
The Chi-square (χ²) test is a widely used non-parametric statistical tool
designed to analyze relationships between categorical variables.
 To test the hypothesis of no association between two or more groups,
population or criteria (i.e. to check independence between two
variables)
 To test how likely the observed distribution of data fits with the
distribution that is expected (i.e., to test the goodness-of-fit)
Continue…..
General Criteria for Using the Chi-Square Test:
 You can use the chi-square test when:
 You are working with categorical variables (i.e., data that can be sorted
into groups or categories like gender, preferences, colors, brands).
 You want to compare observed data with expected data based on a
hypothesis or a known distribution.
 You want to check whether two categorical variables are independent.
 There is random sampling from population.
 Expected frequency in each cell should be at least 5 (to ensure accuracy).
Continue…
 The Chi-square test is suitable for the following statistical
purposes:
 To determine whether there is a statistically significant
association between two categorical variables.
 To compare the observed distribution of data with an
expected theoretical distribution.
 To test hypotheses about proportional differences in groups
or conditions.
Example
If we want to test that in a health camp attended by 50 persons the one
who exercise regularly are having lesser body mass index (BMI) by
taking their actual BMI values, than it cannot be tested using a Chi-
square test. However, if we divide the same set of 50 persons into two
categories as obese with BMI ≥ 30 and nonobese with BMI < 30, than
the same data can be tested using a Chi-square test by counting the
number of obese and nonobese persons across two groups, the one who
exercise regularly and the one who does not. A 2×2 contingency table
also known as cross tables can be constructed for calculating a Chi-
square statistic.
When to use a Chi-square Test in the context of
research/data analysis
Life sciences(Botany)
Analyzing Categorical Data
 The Chi-square test is designed for data that falls into categories, such as
plant species, disease resistance, or flower colors.
 It's not appropriate for continuous data like plant height or leaf size, unless
you first categorize the data (e.g., by dividing height into intervals).
Comparing Observed and Expected Frequencies
 You might be observing frequencies of certain traits in a plant population
and want to see if these frequencies align with what you would expect
based on a hypothesis or model.
Continue…
 For example, you could use a Chi-square test to compare the
observed number of plants with a certain trait (like disease resistance)
to the expected number based on genetic principles.
Testing for Independence (Association):
 The Chi-square test can also be used to determine if two categorical
variables are related or independent.
 For example, you could use it to see if there's an association between
plant species and their susceptibility to a disease.
Where to use Chi-Square test
 The Chi-Square Test used across diverse fields to analyze categorical
data and detect associations or discrepancies between observed and
expected frequencies.
Fields of Application
Life Sciences
 Risk Factor Analysis: Evaluates associations between lifestyle factors
(e.g., smoking) and diseases (e.g., lung cancer) using contingency tables.
 Treatment Comparisons: Tests if different treatments (e.g., drug vs.
placebo) yield significantly different recovery rates.
Continue…
 Epidemiology: Assesses disease distribution across populations or
vaccination effectiveness.
 Genetic Studies: Determines if observed trait distributions (e.g., coat
color in animals) align with Mendelian inheritance models
 Ecology: Analyzes species distribution across habitats or
environmental conditions.
 Pollution Studies: Examines associations between industrial activity
and pollution levels in regions
Social Sciences and Business
 Public Policy: Analyzes voting patterns, education levels, or
demographic trends to inform policy decisions.
 Curriculum Analysis: Tests if teaching methods (e.g., online vs. in-
person) correlate with student performance
 Consumer Preferences: Tests associations between age groups and
product features (e.g., app color themes)
 Market Research: Evaluates payment method preferences across
product categories (e.g., credit cards vs. PayPal in e-commerce).
 Manufacturing: Verifies if product defects follow a random
distribution or are linked to specific production batches
Real-World Examples
 Medical Research: A study tested if COVID-19 vaccination status was
linked to hospitalization rates using a 2x2 contingency table.
 Genetics: Researchers tested if cat litters exhibited expected
genetic trait ratios (e.g., fur color) using observed vs. expected
frequencies.
 Tech Industry: A streaming platform analyzed user preferences for
movie genres and snack purchases to optimize theater inventory.
 Retail: A candy manufacturer used a Goodness-of-Fit Test to verify if
color distributions in candy bags matched advertised claims
Software Advancements and Tools
 SPSS: Offers built-in Crosstabs procedures for Chi-Square Tests of
Independence, including expected frequencies and p-values.
 Python/R: Libraries like scipy.stats (Python) and chisq.test() (R) automate
calculations for large datasets
 JMP: Provides interactive visualizations (e.g., clustered bar charts) alongside
test results
 Quantpsy.org: Interactive tools for Goodness-of-Fit and Independence tests
with real-time calculations
 SocSciStatistics: Simplifies Chi-Square computations for contingency tables
up to 5x5.
 Tableau/Power BI: Integrate Chi-Square results into dashboards,
highlighting associations via heatmaps or contingency diagrams.
Chi-Square Test assignment Stat  ppt.pptx

Chi-Square Test assignment Stat ppt.pptx

  • 1.
    Government College UniversityFaisalabad Chi-Square Test Presented to : Sir Irfan Ali Raza Presented by : Irum Arshad (247124) Zunaira Hameed (247121) Maria Batool (247122) Musaab Sohail (247130)
  • 2.
    Chi-Square Test (nonparametric Test)  A chi-square (x²) statistic is a test that measures how Expectations compare to actual observed data.  Data Collected (Observed) ← === → Data Predicted (Expected)  Null Hypothesis Observed = Expected  Alternate Hypothesis → Observed ≠ Expected
  • 3.
    CHI Square performsTwo types of Test  Goodness of Fit Test  (Single C Variable)  The test of independence  (Between Multiple C Variables)
  • 4.
    Goodness of fittest The goodness of fit test is a statistical hypothesis test to see how well sample data fit a distribution from a population with a normal distribution. Fit Test Defining a Null and Alternate Hypothesis  Null Hypothesis: ratio of 50-50 exists in office  Alternate Hypothesis in office: Raito of 50:50 is not there.  Males employees < Female Employees  Males employees >Female Employees
  • 5.
    Continue….  Calculated Chi-Squarevalue = 1.8  Critical Value from the Chart = 3.8  If calculated Chi-Square value </= the value in chart We can not reject the null Hypothesis.  Null Hypothesis Observed = Expected  Alternate Hypothesis Observed ≠ Expected
  • 6.
    Test of Independence Tocheck Two Categorical variables are correlated to each other or not Contingency Tables  Cross tab  Cross Tabulation Matrix  Displays the (multivariate) frequency distribution of the variables.  It is heavily used in survey research, business intelligence,
  • 7.
    Steps to findindependence of Variables 
  • 8.
    Step 1: Define Nulland Alternate Hypothesis  Null Hypothesis: NO relation between gender and favorite ruling party.  If calculated Chi-Square value </= the value in chart. We can not reject the null Hypothesis.  Alternate Hypothesis in school: there is relation between gender and favorite ruling party
  • 9.
    Why we usethe Chi-Square test Purpose of the Chi-Square test  The Chi-Square test is used due to the following reasons  To handle non-numeric data.  To test the validity of assumptions.  To apply in a wide range of fields.  To support decision-making based on Data.  To compare expected and observed frequencies.  To identify significant deviations from hypothesis.  To test relationships between categorical variables.
  • 10.
    Main reasons forusing the test The key reasons behind using the Chi-Square test are mentioned below  To test goodness of fit.  To make evidence-based decisions.  To handle large sample sizes easily.  To Identify non-random associations.  To test the Independence between variables.  To validate hypotheses in categorical data.
  • 11.
    Importance The Chi-Square testhas gained importance due to following reasons  Simplicity: Easy to calculate and interpret.  Versatility: Applies to many fields like health, marketing, and education.  Objectivity: Replaces guesswork with statistical evidence.  Non-parametric: Doesn’t assume normal distribution — great for categorical data.
  • 12.
    When we useChi-Square Test The Chi-square (χ²) test is a widely used non-parametric statistical tool designed to analyze relationships between categorical variables.  To test the hypothesis of no association between two or more groups, population or criteria (i.e. to check independence between two variables)  To test how likely the observed distribution of data fits with the distribution that is expected (i.e., to test the goodness-of-fit)
  • 13.
    Continue….. General Criteria forUsing the Chi-Square Test:  You can use the chi-square test when:  You are working with categorical variables (i.e., data that can be sorted into groups or categories like gender, preferences, colors, brands).  You want to compare observed data with expected data based on a hypothesis or a known distribution.  You want to check whether two categorical variables are independent.  There is random sampling from population.  Expected frequency in each cell should be at least 5 (to ensure accuracy).
  • 14.
    Continue…  The Chi-squaretest is suitable for the following statistical purposes:  To determine whether there is a statistically significant association between two categorical variables.  To compare the observed distribution of data with an expected theoretical distribution.  To test hypotheses about proportional differences in groups or conditions.
  • 15.
    Example If we wantto test that in a health camp attended by 50 persons the one who exercise regularly are having lesser body mass index (BMI) by taking their actual BMI values, than it cannot be tested using a Chi- square test. However, if we divide the same set of 50 persons into two categories as obese with BMI ≥ 30 and nonobese with BMI < 30, than the same data can be tested using a Chi-square test by counting the number of obese and nonobese persons across two groups, the one who exercise regularly and the one who does not. A 2×2 contingency table also known as cross tables can be constructed for calculating a Chi- square statistic.
  • 16.
    When to usea Chi-square Test in the context of research/data analysis Life sciences(Botany) Analyzing Categorical Data  The Chi-square test is designed for data that falls into categories, such as plant species, disease resistance, or flower colors.  It's not appropriate for continuous data like plant height or leaf size, unless you first categorize the data (e.g., by dividing height into intervals). Comparing Observed and Expected Frequencies  You might be observing frequencies of certain traits in a plant population and want to see if these frequencies align with what you would expect based on a hypothesis or model.
  • 17.
    Continue…  For example,you could use a Chi-square test to compare the observed number of plants with a certain trait (like disease resistance) to the expected number based on genetic principles. Testing for Independence (Association):  The Chi-square test can also be used to determine if two categorical variables are related or independent.  For example, you could use it to see if there's an association between plant species and their susceptibility to a disease.
  • 18.
    Where to useChi-Square test  The Chi-Square Test used across diverse fields to analyze categorical data and detect associations or discrepancies between observed and expected frequencies. Fields of Application Life Sciences  Risk Factor Analysis: Evaluates associations between lifestyle factors (e.g., smoking) and diseases (e.g., lung cancer) using contingency tables.  Treatment Comparisons: Tests if different treatments (e.g., drug vs. placebo) yield significantly different recovery rates.
  • 19.
    Continue…  Epidemiology: Assessesdisease distribution across populations or vaccination effectiveness.  Genetic Studies: Determines if observed trait distributions (e.g., coat color in animals) align with Mendelian inheritance models  Ecology: Analyzes species distribution across habitats or environmental conditions.  Pollution Studies: Examines associations between industrial activity and pollution levels in regions
  • 20.
    Social Sciences andBusiness  Public Policy: Analyzes voting patterns, education levels, or demographic trends to inform policy decisions.  Curriculum Analysis: Tests if teaching methods (e.g., online vs. in- person) correlate with student performance  Consumer Preferences: Tests associations between age groups and product features (e.g., app color themes)  Market Research: Evaluates payment method preferences across product categories (e.g., credit cards vs. PayPal in e-commerce).  Manufacturing: Verifies if product defects follow a random distribution or are linked to specific production batches
  • 21.
    Real-World Examples  MedicalResearch: A study tested if COVID-19 vaccination status was linked to hospitalization rates using a 2x2 contingency table.  Genetics: Researchers tested if cat litters exhibited expected genetic trait ratios (e.g., fur color) using observed vs. expected frequencies.  Tech Industry: A streaming platform analyzed user preferences for movie genres and snack purchases to optimize theater inventory.  Retail: A candy manufacturer used a Goodness-of-Fit Test to verify if color distributions in candy bags matched advertised claims
  • 22.
    Software Advancements andTools  SPSS: Offers built-in Crosstabs procedures for Chi-Square Tests of Independence, including expected frequencies and p-values.  Python/R: Libraries like scipy.stats (Python) and chisq.test() (R) automate calculations for large datasets  JMP: Provides interactive visualizations (e.g., clustered bar charts) alongside test results  Quantpsy.org: Interactive tools for Goodness-of-Fit and Independence tests with real-time calculations  SocSciStatistics: Simplifies Chi-Square computations for contingency tables up to 5x5.  Tableau/Power BI: Integrate Chi-Square results into dashboards, highlighting associations via heatmaps or contingency diagrams.