Downloaded 441 times

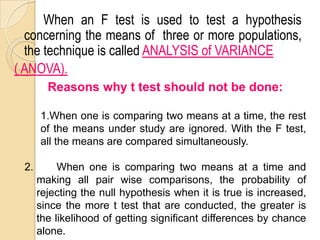
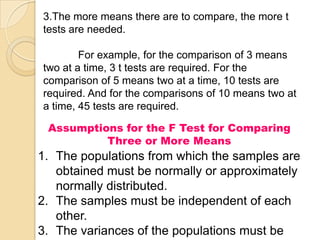
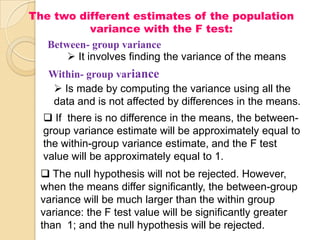

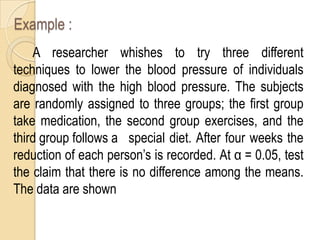
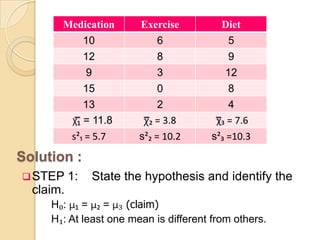

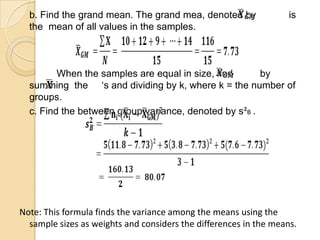
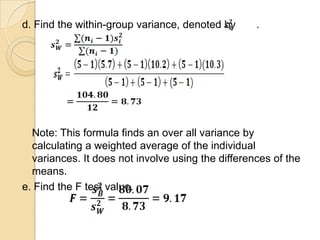
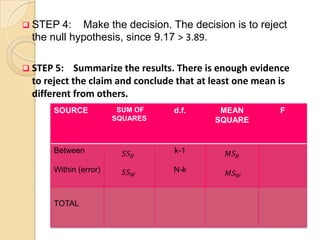

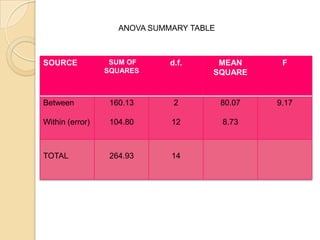


This document explains how to use analysis of variance (ANOVA) to compare the means of three or more populations simultaneously. It outlines the assumptions of ANOVA, including normality, independence, and equal variances. The document also describes how to calculate the between-group variance, within-group variance, and F-test value. An example is provided where ANOVA is used to test if three blood pressure treatment techniques have different effectiveness by comparing the reduction in blood pressure means across the three groups. The results show the F-test value is greater than the critical value, so the null hypothesis that the means are equal is rejected.