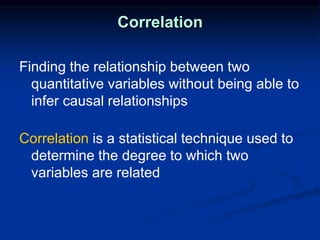
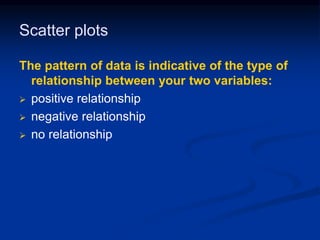
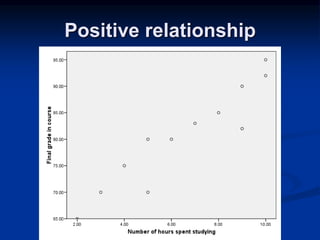
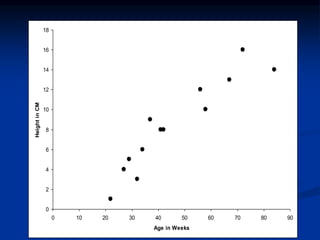
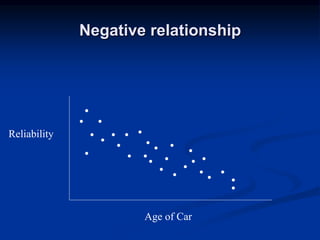
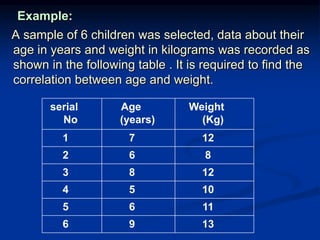
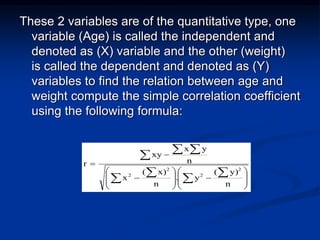
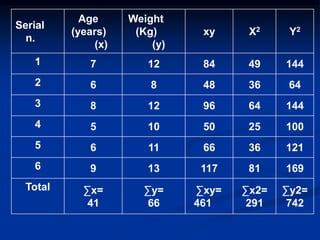
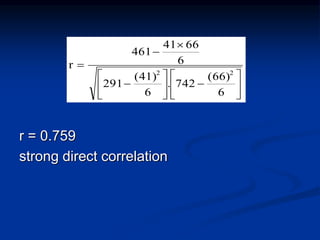
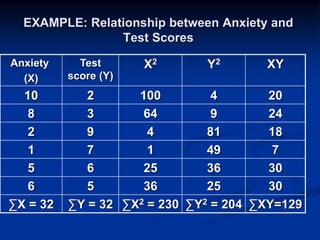
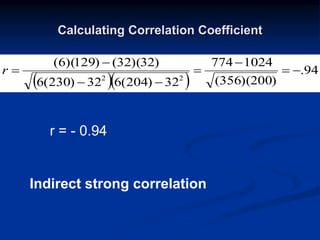
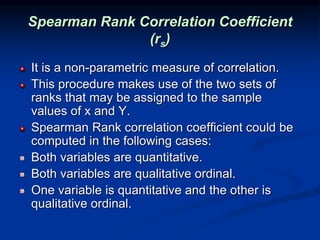
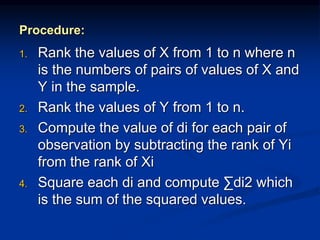
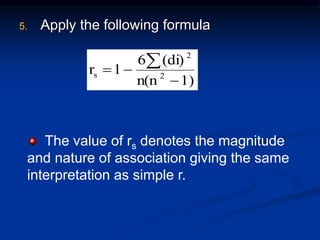
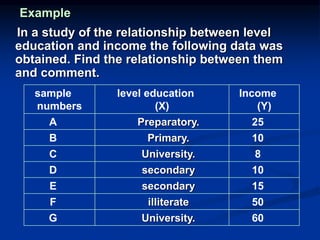
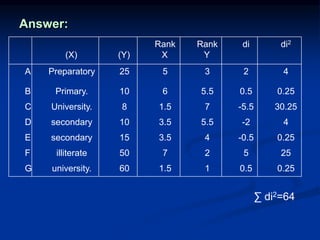
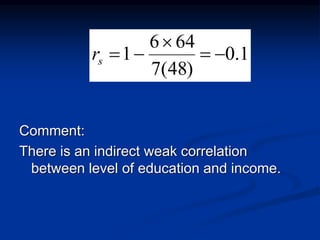
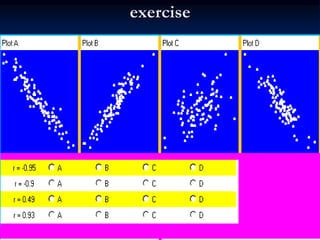
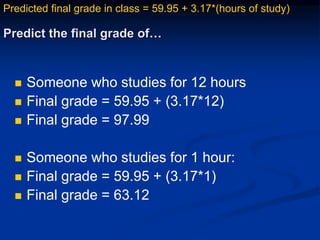
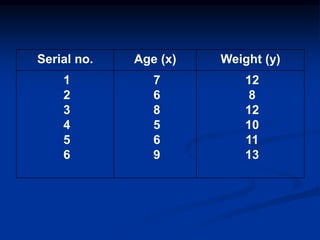
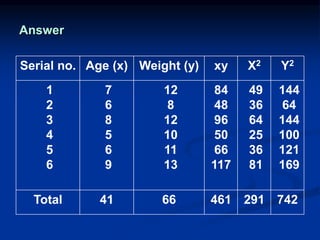
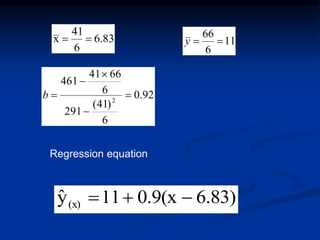
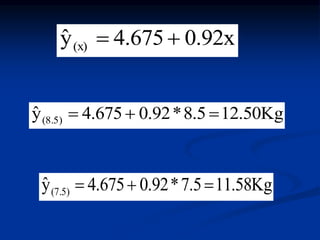
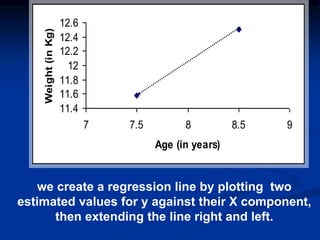
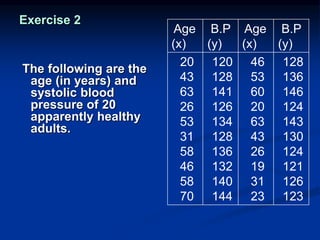
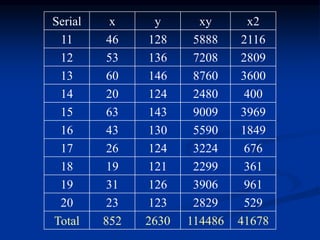
Finding the relationship between two quantitative variables without being able to infer causal relationships
Correlation is a statistical technique used to determine the degree to which two variables are related
It is most useful for the students of BBA for the subject of "Data Analysis and Modeling"/
It has covered the content of chapter- Data regression Model
Visit for more on www.ramkumarshah.com.np/
It is most useful for the students of BBA for the subject of "Data Analysis and Modeling"/
It has covered the content of chapter- Data regression Model
Visit for more on www.ramkumarshah.com.np/
The standard deviation is a measure of the spread of scores within a set of data. Usually, we are interested in the standard deviation of a population.
Assumptions of parametric and non-parametric tests
Testing the assumption of normality
Commonly used non-parametric tests
Applying tests in SPSS
Advantages of non-parametric tests
Limitations
This presentation covered the following topics:
1. Definition of Correlation and Regression
2. Meaning of Correlation and Regression
3. Types of Correlation and Regression
4. Karl Pearson's methods of correlation
5. Bivariate Grouped data method
6. Spearman's Rank correlation Method
7. Scattered diagram method
8. Interpretation of correlation coefficient
9. Lines of Regression
10. regression Equations
11. Difference between correlation and regression
12. Related examples
Unit-I, BP801T. BIOSTATISITCS AND RESEARCH METHODOLOGY (Theory)
Correlation: Definition, Karl Pearson’s coefficient of correlation, Multiple correlations -
Pharmaceuticals examples.
Correlation: is there a relationship between 2
variables.
Debridement is an important component of the wound bed preparation (WBP) management Model.
Cause of the wound and patient-centered concerns, debridement is a necessary step in local wound care.
Debridement is the removal of necrotic tissue, exudate, bacteria, and metabolic waste from a wound in order to improve or facilitate the healing process
Chest pain or discomfort
Common presenting symptom of cardiovascular disease
May be cardiac or noncardiac in origin.
Cardiac – angina, MI, pericarditis, mitral valve prolapse, dissecting aortic aneurysm
Non cardiac – anemia (physical exertion), cervical disc disease, anxiety, trigger points etc
Follows pattern of ulnar nerve distribution (heart supplied by C3-T4 spinal segments)
Radiating pain to neck, jaw, upper trapezius, upper back, shoulder or arms (commonly left
Biologist & gerontologist used concept of senescence to explain biological aging
Senescence or normal aging refers to a gradual, time related to biological process that takes places as degenerative processes overtake regenerative or growth processes.
or
senescence: a change in the behavior of an organism with age leading to a decreased power of survival and adjustment
Immunology plays a very important role in homeostasis but it possesses two edge sword actions. Either hypo or hyperimmunity both can cause systemic diseases which will manifest in the oral cavity.
Immunomodulators are the agents which modulate the body immunity according to
the need.
There are natural and synthetic immunomodulatory agents .
Endocrinology is a specialty of medicine; some would say a sub-specialty of internal medicine, which deals with the diagnosis and treatment of diseases related to hormones. Endocrinology covers such human functions as the coordination of metabolism, respiration, reproduction, sensory perception, and movement
non-skeletal mesodermal tissues: adipose tissue, fibrous tissue, muscle, blood vessels and peripheral nerves (despite neuroectodermal origin)
benign, malignant and intermediate (low-grade malignant – locally aggressive, can recur, no metastatic potential)
originate from primitive mesenchymal stem cells
classification according to differentiation lines (e.g. liposarcoma is not a tumor arising from adipose tissue but exhibiting lipoblastic differentiation)
Down syndrome (DS or DNS), also known as trisomy 21, is a genetic disorder caused by the presence of all or part of a third copy of chromosome 21. It is typically associated with physical growth delays, characteristic facial features and mild to moderate intellectual disability. The average IQ of a young adult with Down syndrome is 50, equivalent to the mental ability of an 8- or 9-year-old child, but this can vary widely.
Facial pain is pain felt in any part of the face, including the mouth and eyes.
It’s normally due to an injury or a headache, occasionally facial pain may also be due to neurological or vascular causes, but equally well may be dental in origin.
The lymphatic system is responsible for the production, transport and filtration of lymph fluid throughout the body. In addition to its important circulatory functions, the lymphatic system also has important immunological functions
The pressure of the blood in the circulatory system, often measured for diagnosis since it is closely related to the force and rate of the heartbeat and the diameter and elasticity of the arterial walls.
Eating a diet high in vegetables, fruits, whole grains, and legumes.
Choosing lean, low-fat sources of protein.
Limiting sweets, soft drinks, and foods with added sugar.
Including proteins, carbohydrates, and a little good fat in all meals and snacks.
Vectors are organisms that transmit pathogens and parasites from one infected person (or animal) to another, causing serious diseases in human populations
She has a wonderful personality.”“He has no personality.”“He has a charming personality.”“We seem to have a personality conflict.”“It’s just her personality.”“She has her mother’s personality.”“He’s a real personality.”
Basavarajeeyam is an important text for ayurvedic physician belonging to andhra pradehs. It is a popular compendium in various parts of our country as well as in andhra pradesh. The content of the text was presented in sanskrit and telugu language (Bilingual). One of the most famous book in ayurvedic pharmaceutics and therapeutics. This book contains 25 chapters called as prakaranas. Many rasaoushadis were explained, pioneer of dhatu druti, nadi pareeksha, mutra pareeksha etc. Belongs to the period of 15-16 century. New diseases like upadamsha, phiranga rogas are explained.
Antimicrobial stewardship to prevent antimicrobial resistanceGovindRankawat1
India is among the nations with the highest burden of bacterial infections.
India is one of the largest consumers of antibiotics worldwide.
India carries one of the largest burdens of drug‑resistant pathogens worldwide.
Highest burden of multidrug‑resistant tuberculosis,
Alarmingly high resistance among Gram‑negative and Gram‑positive bacteria even to newer antimicrobials such as carbapenems.
NDM‑1 ( New Delhi Metallo Beta lactamase 1, an enzyme which inactivates majority of Beta lactam antibiotics including carbapenems) was reported in 2008
Ozempic: Preoperative Management of Patients on GLP-1 Receptor Agonists Saeid Safari
Preoperative Management of Patients on GLP-1 Receptor Agonists like Ozempic and Semiglutide
ASA GUIDELINE
NYSORA Guideline
2 Case Reports of Gastric Ultrasound
These lecture slides, by Dr Sidra Arshad, offer a quick overview of the physiological basis of a normal electrocardiogram.
Learning objectives:
1. Define an electrocardiogram (ECG) and electrocardiography
2. Describe how dipoles generated by the heart produce the waveforms of the ECG
3. Describe the components of a normal electrocardiogram of a typical bipolar lead (limb II)
4. Differentiate between intervals and segments
5. Enlist some common indications for obtaining an ECG
6. Describe the flow of current around the heart during the cardiac cycle
7. Discuss the placement and polarity of the leads of electrocardiograph
8. Describe the normal electrocardiograms recorded from the limb leads and explain the physiological basis of the different records that are obtained
9. Define mean electrical vector (axis) of the heart and give the normal range
10. Define the mean QRS vector
11. Describe the axes of leads (hexagonal reference system)
12. Comprehend the vectorial analysis of the normal ECG
13. Determine the mean electrical axis of the ventricular QRS and appreciate the mean axis deviation
14. Explain the concepts of current of injury, J point, and their significance
Study Resources:
1. Chapter 11, Guyton and Hall Textbook of Medical Physiology, 14th edition
2. Chapter 9, Human Physiology - From Cells to Systems, Lauralee Sherwood, 9th edition
3. Chapter 29, Ganong’s Review of Medical Physiology, 26th edition
4. Electrocardiogram, StatPearls - https://www.ncbi.nlm.nih.gov/books/NBK549803/
5. ECG in Medical Practice by ABM Abdullah, 4th edition
6. Chapter 3, Cardiology Explained, https://www.ncbi.nlm.nih.gov/books/NBK2214/
7. ECG Basics, http://www.nataliescasebook.com/tag/e-c-g-basics
Adv. biopharm. APPLICATION OF PHARMACOKINETICS : TARGETED DRUG DELIVERY SYSTEMSAkankshaAshtankar
MIP 201T & MPH 202T
ADVANCED BIOPHARMACEUTICS & PHARMACOKINETICS : UNIT 5
APPLICATION OF PHARMACOKINETICS : TARGETED DRUG DELIVERY SYSTEMS By - AKANKSHA ASHTANKAR
share - Lions, tigers, AI and health misinformation, oh my!.pptxTina Purnat
• Pitfalls and pivots needed to use AI effectively in public health
• Evidence-based strategies to address health misinformation effectively
• Building trust with communities online and offline
• Equipping health professionals to address questions, concerns and health misinformation
• Assessing risk and mitigating harm from adverse health narratives in communities, health workforce and health system
NVBDCP.pptx Nation vector borne disease control programSapna Thakur
NVBDCP was launched in 2003-2004 . Vector-Borne Disease: Disease that results from an infection transmitted to humans and other animals by blood-feeding arthropods, such as mosquitoes, ticks, and fleas. Examples of vector-borne diseases include Dengue fever, West Nile Virus, Lyme disease, and malaria.
Rasamanikya is a excellent preparation in the field of Rasashastra, it is used in various Kushtha Roga, Shwasa, Vicharchika, Bhagandara, Vatarakta, and Phiranga Roga. In this article Preparation& Comparative analytical profile for both Formulationon i.e Rasamanikya prepared by Kushmanda swarasa & Churnodhaka Shodita Haratala. The study aims to provide insights into the comparative efficacy and analytical aspects of these formulations for enhanced therapeutic outcomes.
Here is the updated list of Top Best Ayurvedic medicine for Gas and Indigestion and those are Gas-O-Go Syp for Dyspepsia | Lavizyme Syrup for Acidity | Yumzyme Hepatoprotective Capsules etc
Local Advanced Lung Cancer: Artificial Intelligence, Synergetics, Complex Sys...Oleg Kshivets
Overall life span (LS) was 1671.7±1721.6 days and cumulative 5YS reached 62.4%, 10 years – 50.4%, 20 years – 44.6%. 94 LCP lived more than 5 years without cancer (LS=2958.6±1723.6 days), 22 – more than 10 years (LS=5571±1841.8 days). 67 LCP died because of LC (LS=471.9±344 days). AT significantly improved 5YS (68% vs. 53.7%) (P=0.028 by log-rank test). Cox modeling displayed that 5YS of LCP significantly depended on: N0-N12, T3-4, blood cell circuit, cell ratio factors (ratio between cancer cells-CC and blood cells subpopulations), LC cell dynamics, recalcification time, heparin tolerance, prothrombin index, protein, AT, procedure type (P=0.000-0.031). Neural networks, genetic algorithm selection and bootstrap simulation revealed relationships between 5YS and N0-12 (rank=1), thrombocytes/CC (rank=2), segmented neutrophils/CC (3), eosinophils/CC (4), erythrocytes/CC (5), healthy cells/CC (6), lymphocytes/CC (7), stick neutrophils/CC (8), leucocytes/CC (9), monocytes/CC (10). Correct prediction of 5YS was 100% by neural networks computing (error=0.000; area under ROC curve=1.0).
Knee anatomy and clinical tests 2024.pdfvimalpl1234
This includes all relevant anatomy and clinical tests compiled from standard textbooks, Campbell,netter etc..It is comprehensive and best suited for orthopaedicians and orthopaedic residents.
3. Correlation
Finding the relationship between two
quantitative variables without being able to
infer causal relationships
Correlation is a statistical technique used to
determine the degree to which two
variables are related
4. • Rectangular coordinate
• Two quantitative variables
• One variable is called independent (X) and
the second is called dependent (Y)
• Points are not joined
• No frequency table
Scatter diagram
Y
* *
*
X
8. Scatter plots
The pattern of data is indicative of the type of
relationship between your two variables:
positive relationship
negative relationship
no relationship
14. Simple Correlation coefficient (r)
It is also called Pearson's correlation
or product moment correlation
coefficient.
It measures the nature and strength
between two variables of
the quantitative type.
15. The sign of r denotes the nature of
association
while the value of r denotes the
strength of association.
16. If the sign is +ve this means the relation
is direct (an increase in one variable is
associated with an increase in the
other variable and a decrease in one
variable is associated with a
decrease in the other variable).
While if the sign is -ve this means an
inverse or indirect relationship (which
means an increase in one variable is
associated with a decrease in the other).
17. The value of r ranges between ( -1) and ( +1)
The value of r denotes the strength of the
association as illustrated
by the following diagram.
-1 10-0.25-0.75 0.750.25
strong strongintermediate intermediateweak weak
no relation
perfect
correlation
perfect
correlation
Directindirect
18. If r = Zero this means no association or
correlation between the two variables.
If 0 < r < 0.25 = weak correlation.
If 0.25 ≤ r < 0.75 = intermediate correlation.
If 0.75 ≤ r < 1 = strong correlation.
If r = l = perfect correlation.
20. Example:
A sample of 6 children was selected, data about their
age in years and weight in kilograms was recorded as
shown in the following table . It is required to find the
correlation between age and weight.
Weight
(Kg)
Age
(years)
serial
No
1271
862
1283
1054
1165
1396
21. These 2 variables are of the quantitative type, one
variable (Age) is called the independent and
denoted as (X) variable and the other (weight)
is called the dependent and denoted as (Y)
variables to find the relation between age and
weight compute the simple correlation coefficient
using the following formula:
n
y)(
y.
n
x)(
x
n
yx
xy
r
2
2
2
2
26. Spearman Rank Correlation Coefficient
(rs)
It is a non-parametric measure of correlation.
This procedure makes use of the two sets of
ranks that may be assigned to the sample
values of x and Y.
Spearman Rank correlation coefficient could be
computed in the following cases:
Both variables are quantitative.
Both variables are qualitative ordinal.
One variable is quantitative and the other is
qualitative ordinal.
27. Procedure:
1. Rank the values of X from 1 to n where n
is the numbers of pairs of values of X and
Y in the sample.
2. Rank the values of Y from 1 to n.
3. Compute the value of di for each pair of
observation by subtracting the rank of Yi
from the rank of Xi
4. Square each di and compute ∑di2 which
is the sum of the squared values.
28. 5. Apply the following formula
1)n(n
(di)6
1r 2
2
s
The value of rs denotes the magnitude
and nature of association giving the same
interpretation as simple r.
29. Example
In a study of the relationship between level
education and income the following data was
obtained. Find the relationship between them
and comment.
Income
(Y)
level education
(X)
sample
numbers
25Preparatory.A
10Primary.B
8University.C
10secondaryD
15secondaryE
50illiterateF
60University.G
34. Regression
Uses a variable (x) to predict some outcome
variable (y)
Tells you how values in y change as a function
of changes in values of x
35. Correlation and Regression
Correlation describes the strength of a linear
relationship between two variables
Linear means “straight line”
Regression tells us how to draw the straight line
described by the correlation
36. Regression
Calculates the “best-fit” line for a certain set of data
The regression line makes the sum of the squares of
the residuals smaller than for any other line
Regression minimizes residuals
80
100
120
140
160
180
200
220
60 70 80 90 100 110 120
Wt (kg)
SBP(mmHg)
37. By using the least squares method (a procedure
that minimizes the vertical deviations of plotted
points surrounding a straight line) we are
able to construct a best fitting straight line to the
scatter diagram points and then formulate a
regression equation in the form of:
n
x)(
x
n
yx
xy
b 2
2
1
)xb(xyyˆ b
bXayˆ
41. Regressing grades on hours
Linear Regression
2.00 4.00 6.00 8.00 10.00
Number of hours spent studying
70.00
80.00
90.00
Finalgradeincourse
Final grade in course = 59.95 + 3.17 * study
R-Square = 0.88
Predicted final grade in class =
59.95 + 3.17*(number of hours you study per week)
42. Predict the final grade of…
Someone who studies for 12 hours
Final grade = 59.95 + (3.17*12)
Final grade = 97.99
Someone who studies for 1 hour:
Final grade = 59.95 + (3.17*1)
Final grade = 63.12
Predicted final grade in class = 59.95 + 3.17*(hours of study)
43. Exercise
A sample of 6 persons was selected the
value of their age ( x variable) and their
weight is demonstrated in the following
table. Find the regression equation and
what is the predicted weight when age is
8.5 years.
48. 11.4
11.6
11.8
12
12.2
12.4
12.6
7 7.5 8 8.5 9
Age (in years)
Weight(inKg)
we create a regression line by plotting two
estimated values for y against their X component,
then extending the line right and left.
49. Exercise 2
The following are the
age (in years) and
systolic blood
pressure of 20
apparently healthy
adults.
B.P
(y)
Age
(x)
B.P
(y)
Age
(x)
128
136
146
124
143
130
124
121
126
123
46
53
60
20
63
43
26
19
31
23
120
128
141
126
134
128
136
132
140
144
20
43
63
26
53
31
58
46
58
70
50. Find the correlation between age
and blood pressure using simple
and Spearman's correlation
coefficients, and comment.
Find the regression equation?
What is the predicted blood
pressure for a man aging 25 years?
53.
n
x)(
x
n
yx
xy
b 2
2
1 4547.0
20
852
41678
20
2630852
114486
2
=
=112.13 + 0.4547 x
for age 25
B.P = 112.13 + 0.4547 * 25=123.49 = 123.5 mm hg
yˆ
54. Multiple Regression
Multiple regression analysis is a
straightforward extension of simple
regression analysis which allows more
than one independent variable.