CHI-SQUARE
CHI-SQUARE Test
Test
YULI PAUL 8803
Non-Parametric Test
The chi-square test is represented by the Greek letter chi, χ2.
Developed by renowned statistician Karl Pearson in 1900, this
test has become a fundamental tool in research across multiple
disciplines.
Statistical test used to analyze categorical data (Qualitative) and
determine relationships between variables based on chi-square
distribution i.e. counts or categories (like Yes/No, Male/Female,
Like/Dislike) rather than numbers like averages or percentages.
It’s a non-parametric test, meaning it doesn’t rely on assumptions
about the data’s normal distribution, this means it doesn’t require
the data to follow a normal (bell-shaped) pattern.
It's used to determine if there is a difference between groups or if
the two variables are independent.
Chi-square Test or Pearson chi-square test
The chi-square test is calculated
by finding the squared
difference between actual and
expected data values, and
dividing that difference by the
expected data values.
Let's say we want to investigate whether there is a connection between gender and the highest
level of education. To do this, we create a questionnaire in which the participants tick their gender
and what their highest educational level is. The result of the survey is then displayed in a
contingency table.
Non-Parametric Test: It does not require the data to follow a normal distribution. It is used for
categorical data (e.g., Male/Female, Yes/No, Like/Dislike).
Based on Frequencies: It compares observed vs. expected frequencies in a dataset. Used to check
if there is a significant relationship between two variables.
Always Positive: The Chi-Square statistic is always positive (≥ 0). The formula squares the
difference between observed and expected values, ensuring non-negative results.
Shape Depends on Degrees of Freedom (df): For small df the distribution is skewed right and large
df, the distribution becomes bell-shaped (normal-like).
Used for Hypothesis Testing: Helps test Independence (Are two variables related?) and Goodness-
of-Fit (Does observed data fit a theoretical model?)
Properties of the Chi-Square Test
Terms related to Chi-Square
Degrees of Freedom: Degrees of freedom (df) in a Chi-Square test represent the number of values that
can vary while ensuring constraints (like totals) remain fixed. It helps determine the critical value for
decision-making in hypothesis testing and the shape of the Chi-Square distribution
Degrees of Freedom for the Chi-Square Goodness-of-Fit Test
Example, If a company categorizes customer preferences into 4 types (A, B, C, D), then: df = 4−1 = 3
df = (k−1)
Degrees of Freedom for the Chi-Square Test for Independence df = (r−1) × (c−1)
where, k = Number of categories
Where:
r = Number of rows (categories of one variable)
c = Number of columns (categories of the second variable)
Example, If a survey categorizes respondents by Gender (Male, Female) and Preference (Brand A, Brand
B, Brand C), then: 𝑑𝑓 = (2 −1) × (3 −1) = 2
Example:
If df = 2, most Chi-Square values will be small, with a few
large ones.
If df = 10, Chi-Square values will be more spread out, with
larger possible values appearing more often.
If df = 30, the distribution starts to look more like a
normal curve, meaning values are more evenly
distributed.
Terms related to Chi-Square
Variance & Degrees of Freedom: Variance (spread of values) in a Chi-Square distribution is twice the
number of degrees of freedom (df).
Formula: Variance (σ2)= 2 x df
Since the Chi-Square statistic is a sum of squared
deviations, it inherently reflects the concept of variance. A
higher variance indicates that observed values deviate more
from expected values, potentially leading to a significant
Chi-Square result.
Mean of the Chi-Square Distribution: Mean (average value) is equal to the degrees of freedom,
represents the expected value of the Chi-Square statistic under the null hypothesis. If the calculated
Chi-Square value is significantly greater than the mean (based on critical values or p-value), the null
hypothesis may be rejected
Formula: Mean (μ) = df
As df increases, the average value of the Chi-Square test statistic also
increases, shifting the distribution to the right.
Types of Chi-Square tests
Chi-Square Test of Independence Chi-Square Goodness of Fit Test
Determines whether a sample
distribution matches an expected
distribution.
Assesses whether two categorical
variables are independent or related.
For example, it can be used to see if a
die is fair by comparing the observed
rolls to the expected rolls.
For example, it can be used to
determine if there is a relationship
between gender and product
preference.
A researcher wants to determine if there is an association between gender (Male, Female) and preference
for a product (Like, Dislike).
Chi-Square Test of Independence
Step 1: State the Hypotheses
Null Hypothesis (H0​
): There is no association between gender and product preference (i.e., gender and
preference are independent).
Alternative Hypothesis (H1 or Ha​
): There is an association between gender and product preference.
Step 2: Construct the Contingency Table Step 3: Compute Expected Frequencies
Step 4: Compute the Chi-Square Statistic
Step 5: Determine the Critical Value
Step 6: Compare and Make a Decision
This means there is a significant association between gender and product preference. Thus, gender
does influence whether someone likes or dislikes the product.
A dice manufacturer wants to determine if a six-sided die is fair. They roll the die 60 times, expecting each
face to appear 10 times.
Chi-Square Goodness of Fit Test
Step 1: State the Hypotheses
Null Hypothesis (H₀): The die is fair, meaning each face appears with equal probability.
Alternative Hypothesis (H₁): The die is not fair, meaning the observed frequencies significantly differ
from expected frequencies
Step 2: Given Data
Total Rolls = 60
Expected Frequency for Each Face Observed Frequencies (O) from Dice Rolls:
Step 3: Apply the Chi-Square Formula
Step 4: Determine the Critical Value and p-value
where k= number of categories (die faces).
Step 5: Compare with Critical Value and take Decision
The calculated Chi-Square statistic = 1.0
The p-value = 11.07.
At α = 0.05, since the p-value (11.07) > 0.05, we fail to reject the null hypothesis (H₀).
There is no significant evidence to suggest that the die is unfair. The observed results are consistent
with a fair die. Thus, we conclude that the die appears to be fair based on this test
What is the P-Value in a Chi-Square Test?
The p-value or probability value in a Chi-Square test is a critical statistic used to determine the
significance of the observed results.
P-value serves as a measure to assess whether the
observed data deviates significantly from what would
be expected if there were no effect or association.
Use in Hypothesis Testing: In hypothesis testing, the p-value helps determine whether the observed
data supports or refutes the null hypothesis. A low p-value suggests that the observed results are
unlikely under the null hypothesis, leading to its rejection. Conversely, a high p-value indicates that
the data does not provide enough evidence to reject the null hypothesis.
Significance Levels: Thresholds: Researchers commonly use a significance level (alpha) of 0.05. If the
p-value is below this threshold, the result is considered statistically significant.
Step 1: Calculate the Chi-Square Test Statistic
Step 2: Determine the Degrees of Freedom: Degrees of freedom (df) are essential for locating the correct p-
value.
Finding P-Value
Step 3: Find the P-Value Using Distribution Tables
Locate Critical Value: Compare the calculated X2 test statistic to a critical value from the Chi-Square
distribution table. The critical value depends on the chosen alpha level (e.g., 0.05) and degrees of
freedom.
Decision Rule: If X2 exceeds the critical value from the table, the p-value is less than the alpha level,
suggesting statistical significance.
Step 4: Interpret the P-Value: Comparison to Alpha Level: Compare the obtained p-value to the chosen alpha
level (e.g., 0.05). If the p-value is less than or equal to the alpha level, reject the null hypothesis. If the p-
value is greater, do not reject the null hypothesis.
Interpreting P-Value
When the p-value is less than or equal to 0.05, the result is considered statistically
significant. This indicates that there is sufficient evidence to reject the null
hypothesis. In other words, the observed deviation from the expected frequencies is
unlikely to have occurred by chance alone.
P ≤ 0.05
If the p-value is greater than 0.05, the result is not considered statistically
significant. This means there is insufficient evidence to reject the null hypothesis,
suggesting that the observed frequencies do not deviate significantly from what was
expected.
P > 0.05
Advantages and Limitations
Easy to Apply: The test is simple to understand and use, especially for categorical data. Only
requires counting observed and expected frequencies.
Non-Parametric Test: Works without assuming a normal distribution in the population. Suitable
for nominal (categorical) data like gender, preference, or region.
Works for Large Data Sets: Can handle big sample sizes effectively. More data makes the test
more reliable.
Helps Test Relationships & Fit: Chi-Square Test for Independence checks if two categorical
variables are related and Chi-Square Goodness-of-Fit Test checks if observed data fits a
theoretical model.
Widely Used in Research: Common in social sciences, economics, marketing, and healthcare.
Helps analyze survey responses, voting patterns, and customer preferences.
Advantages
Advantages and Limitations
Requires Large Sample Size: Small sample sizes may lead to inaccurate results, as the test
assumes a sufficient number of observations in each category.
Only for Categorical Data: Cannot be used for continuous variables (e.g., income, height, or
weight).
Does Not Indicate Strength of Relationship: The test only determines whether a relationship
exists, not how strong the relationship is.
Cannot Handle Causality: Even if the test finds a significant relationship, it does not mean one
variable causes the other.
Limitations
Real-Life Applications of the Chi-Square Test
Medical & Health Studies
Education & Student Performance
Insurance & Risk Analysis
Market Research & Consumer Behavior
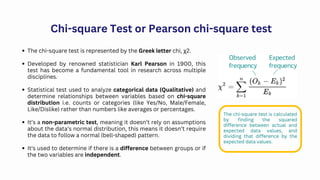
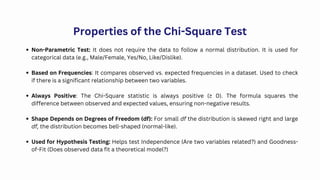
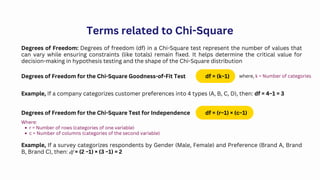
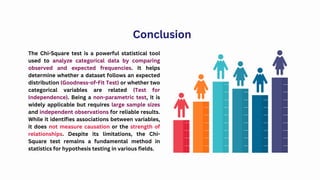
The Chi-Square test is a powerful statistical tool
used to analyze categorical data by comparing
observed and expected frequencies. It helps
determine whether a dataset follows an expected
distribution (Goodness-of-Fit Test) or whether two
categorical variables are related (Test for
Independence). Being a non-parametric test, it is
widely applicable but requires large sample sizes
and independent observations for reliable results.
While it identifies associations between variables,
it does not measure causation or the strength of
relationships. Despite its limitations, the Chi-
Square test remains a fundamental method in
statistics for hypothesis testing in various fields.
Conclusion

Pearson's Chi-square Test for Research Analysis

  • 1.
  • 2.
    The chi-square testis represented by the Greek letter chi, χ2. Developed by renowned statistician Karl Pearson in 1900, this test has become a fundamental tool in research across multiple disciplines. Statistical test used to analyze categorical data (Qualitative) and determine relationships between variables based on chi-square distribution i.e. counts or categories (like Yes/No, Male/Female, Like/Dislike) rather than numbers like averages or percentages. It’s a non-parametric test, meaning it doesn’t rely on assumptions about the data’s normal distribution, this means it doesn’t require the data to follow a normal (bell-shaped) pattern. It's used to determine if there is a difference between groups or if the two variables are independent. Chi-square Test or Pearson chi-square test The chi-square test is calculated by finding the squared difference between actual and expected data values, and dividing that difference by the expected data values.
  • 3.
    Let's say wewant to investigate whether there is a connection between gender and the highest level of education. To do this, we create a questionnaire in which the participants tick their gender and what their highest educational level is. The result of the survey is then displayed in a contingency table.
  • 4.
    Non-Parametric Test: Itdoes not require the data to follow a normal distribution. It is used for categorical data (e.g., Male/Female, Yes/No, Like/Dislike). Based on Frequencies: It compares observed vs. expected frequencies in a dataset. Used to check if there is a significant relationship between two variables. Always Positive: The Chi-Square statistic is always positive (≥ 0). The formula squares the difference between observed and expected values, ensuring non-negative results. Shape Depends on Degrees of Freedom (df): For small df the distribution is skewed right and large df, the distribution becomes bell-shaped (normal-like). Used for Hypothesis Testing: Helps test Independence (Are two variables related?) and Goodness- of-Fit (Does observed data fit a theoretical model?) Properties of the Chi-Square Test
  • 5.
    Terms related toChi-Square Degrees of Freedom: Degrees of freedom (df) in a Chi-Square test represent the number of values that can vary while ensuring constraints (like totals) remain fixed. It helps determine the critical value for decision-making in hypothesis testing and the shape of the Chi-Square distribution Degrees of Freedom for the Chi-Square Goodness-of-Fit Test Example, If a company categorizes customer preferences into 4 types (A, B, C, D), then: df = 4−1 = 3 df = (k−1) Degrees of Freedom for the Chi-Square Test for Independence df = (r−1) × (c−1) where, k = Number of categories Where: r = Number of rows (categories of one variable) c = Number of columns (categories of the second variable) Example, If a survey categorizes respondents by Gender (Male, Female) and Preference (Brand A, Brand B, Brand C), then: 𝑑𝑓 = (2 −1) × (3 −1) = 2
  • 6.
    Example: If df =2, most Chi-Square values will be small, with a few large ones. If df = 10, Chi-Square values will be more spread out, with larger possible values appearing more often. If df = 30, the distribution starts to look more like a normal curve, meaning values are more evenly distributed.
  • 7.
    Terms related toChi-Square Variance & Degrees of Freedom: Variance (spread of values) in a Chi-Square distribution is twice the number of degrees of freedom (df). Formula: Variance (σ2)= 2 x df Since the Chi-Square statistic is a sum of squared deviations, it inherently reflects the concept of variance. A higher variance indicates that observed values deviate more from expected values, potentially leading to a significant Chi-Square result. Mean of the Chi-Square Distribution: Mean (average value) is equal to the degrees of freedom, represents the expected value of the Chi-Square statistic under the null hypothesis. If the calculated Chi-Square value is significantly greater than the mean (based on critical values or p-value), the null hypothesis may be rejected Formula: Mean (μ) = df As df increases, the average value of the Chi-Square test statistic also increases, shifting the distribution to the right.
  • 8.
    Types of Chi-Squaretests Chi-Square Test of Independence Chi-Square Goodness of Fit Test Determines whether a sample distribution matches an expected distribution. Assesses whether two categorical variables are independent or related. For example, it can be used to see if a die is fair by comparing the observed rolls to the expected rolls. For example, it can be used to determine if there is a relationship between gender and product preference.
  • 9.
    A researcher wantsto determine if there is an association between gender (Male, Female) and preference for a product (Like, Dislike). Chi-Square Test of Independence Step 1: State the Hypotheses Null Hypothesis (H0​ ): There is no association between gender and product preference (i.e., gender and preference are independent). Alternative Hypothesis (H1 or Ha​ ): There is an association between gender and product preference. Step 2: Construct the Contingency Table Step 3: Compute Expected Frequencies
  • 10.
    Step 4: Computethe Chi-Square Statistic
  • 11.
    Step 5: Determinethe Critical Value Step 6: Compare and Make a Decision This means there is a significant association between gender and product preference. Thus, gender does influence whether someone likes or dislikes the product.
  • 12.
    A dice manufacturerwants to determine if a six-sided die is fair. They roll the die 60 times, expecting each face to appear 10 times. Chi-Square Goodness of Fit Test Step 1: State the Hypotheses Null Hypothesis (H₀): The die is fair, meaning each face appears with equal probability. Alternative Hypothesis (H₁): The die is not fair, meaning the observed frequencies significantly differ from expected frequencies Step 2: Given Data Total Rolls = 60 Expected Frequency for Each Face Observed Frequencies (O) from Dice Rolls:
  • 13.
    Step 3: Applythe Chi-Square Formula
  • 14.
    Step 4: Determinethe Critical Value and p-value where k= number of categories (die faces). Step 5: Compare with Critical Value and take Decision The calculated Chi-Square statistic = 1.0 The p-value = 11.07. At α = 0.05, since the p-value (11.07) > 0.05, we fail to reject the null hypothesis (H₀). There is no significant evidence to suggest that the die is unfair. The observed results are consistent with a fair die. Thus, we conclude that the die appears to be fair based on this test
  • 15.
    What is theP-Value in a Chi-Square Test? The p-value or probability value in a Chi-Square test is a critical statistic used to determine the significance of the observed results. P-value serves as a measure to assess whether the observed data deviates significantly from what would be expected if there were no effect or association. Use in Hypothesis Testing: In hypothesis testing, the p-value helps determine whether the observed data supports or refutes the null hypothesis. A low p-value suggests that the observed results are unlikely under the null hypothesis, leading to its rejection. Conversely, a high p-value indicates that the data does not provide enough evidence to reject the null hypothesis. Significance Levels: Thresholds: Researchers commonly use a significance level (alpha) of 0.05. If the p-value is below this threshold, the result is considered statistically significant.
  • 16.
    Step 1: Calculatethe Chi-Square Test Statistic Step 2: Determine the Degrees of Freedom: Degrees of freedom (df) are essential for locating the correct p- value. Finding P-Value Step 3: Find the P-Value Using Distribution Tables Locate Critical Value: Compare the calculated X2 test statistic to a critical value from the Chi-Square distribution table. The critical value depends on the chosen alpha level (e.g., 0.05) and degrees of freedom. Decision Rule: If X2 exceeds the critical value from the table, the p-value is less than the alpha level, suggesting statistical significance. Step 4: Interpret the P-Value: Comparison to Alpha Level: Compare the obtained p-value to the chosen alpha level (e.g., 0.05). If the p-value is less than or equal to the alpha level, reject the null hypothesis. If the p- value is greater, do not reject the null hypothesis.
  • 17.
    Interpreting P-Value When thep-value is less than or equal to 0.05, the result is considered statistically significant. This indicates that there is sufficient evidence to reject the null hypothesis. In other words, the observed deviation from the expected frequencies is unlikely to have occurred by chance alone. P ≤ 0.05 If the p-value is greater than 0.05, the result is not considered statistically significant. This means there is insufficient evidence to reject the null hypothesis, suggesting that the observed frequencies do not deviate significantly from what was expected. P > 0.05
  • 18.
    Advantages and Limitations Easyto Apply: The test is simple to understand and use, especially for categorical data. Only requires counting observed and expected frequencies. Non-Parametric Test: Works without assuming a normal distribution in the population. Suitable for nominal (categorical) data like gender, preference, or region. Works for Large Data Sets: Can handle big sample sizes effectively. More data makes the test more reliable. Helps Test Relationships & Fit: Chi-Square Test for Independence checks if two categorical variables are related and Chi-Square Goodness-of-Fit Test checks if observed data fits a theoretical model. Widely Used in Research: Common in social sciences, economics, marketing, and healthcare. Helps analyze survey responses, voting patterns, and customer preferences. Advantages
  • 19.
    Advantages and Limitations RequiresLarge Sample Size: Small sample sizes may lead to inaccurate results, as the test assumes a sufficient number of observations in each category. Only for Categorical Data: Cannot be used for continuous variables (e.g., income, height, or weight). Does Not Indicate Strength of Relationship: The test only determines whether a relationship exists, not how strong the relationship is. Cannot Handle Causality: Even if the test finds a significant relationship, it does not mean one variable causes the other. Limitations
  • 20.
    Real-Life Applications ofthe Chi-Square Test Medical & Health Studies Education & Student Performance Insurance & Risk Analysis Market Research & Consumer Behavior
  • 21.
    The Chi-Square testis a powerful statistical tool used to analyze categorical data by comparing observed and expected frequencies. It helps determine whether a dataset follows an expected distribution (Goodness-of-Fit Test) or whether two categorical variables are related (Test for Independence). Being a non-parametric test, it is widely applicable but requires large sample sizes and independent observations for reliable results. While it identifies associations between variables, it does not measure causation or the strength of relationships. Despite its limitations, the Chi- Square test remains a fundamental method in statistics for hypothesis testing in various fields. Conclusion