Download to read offline

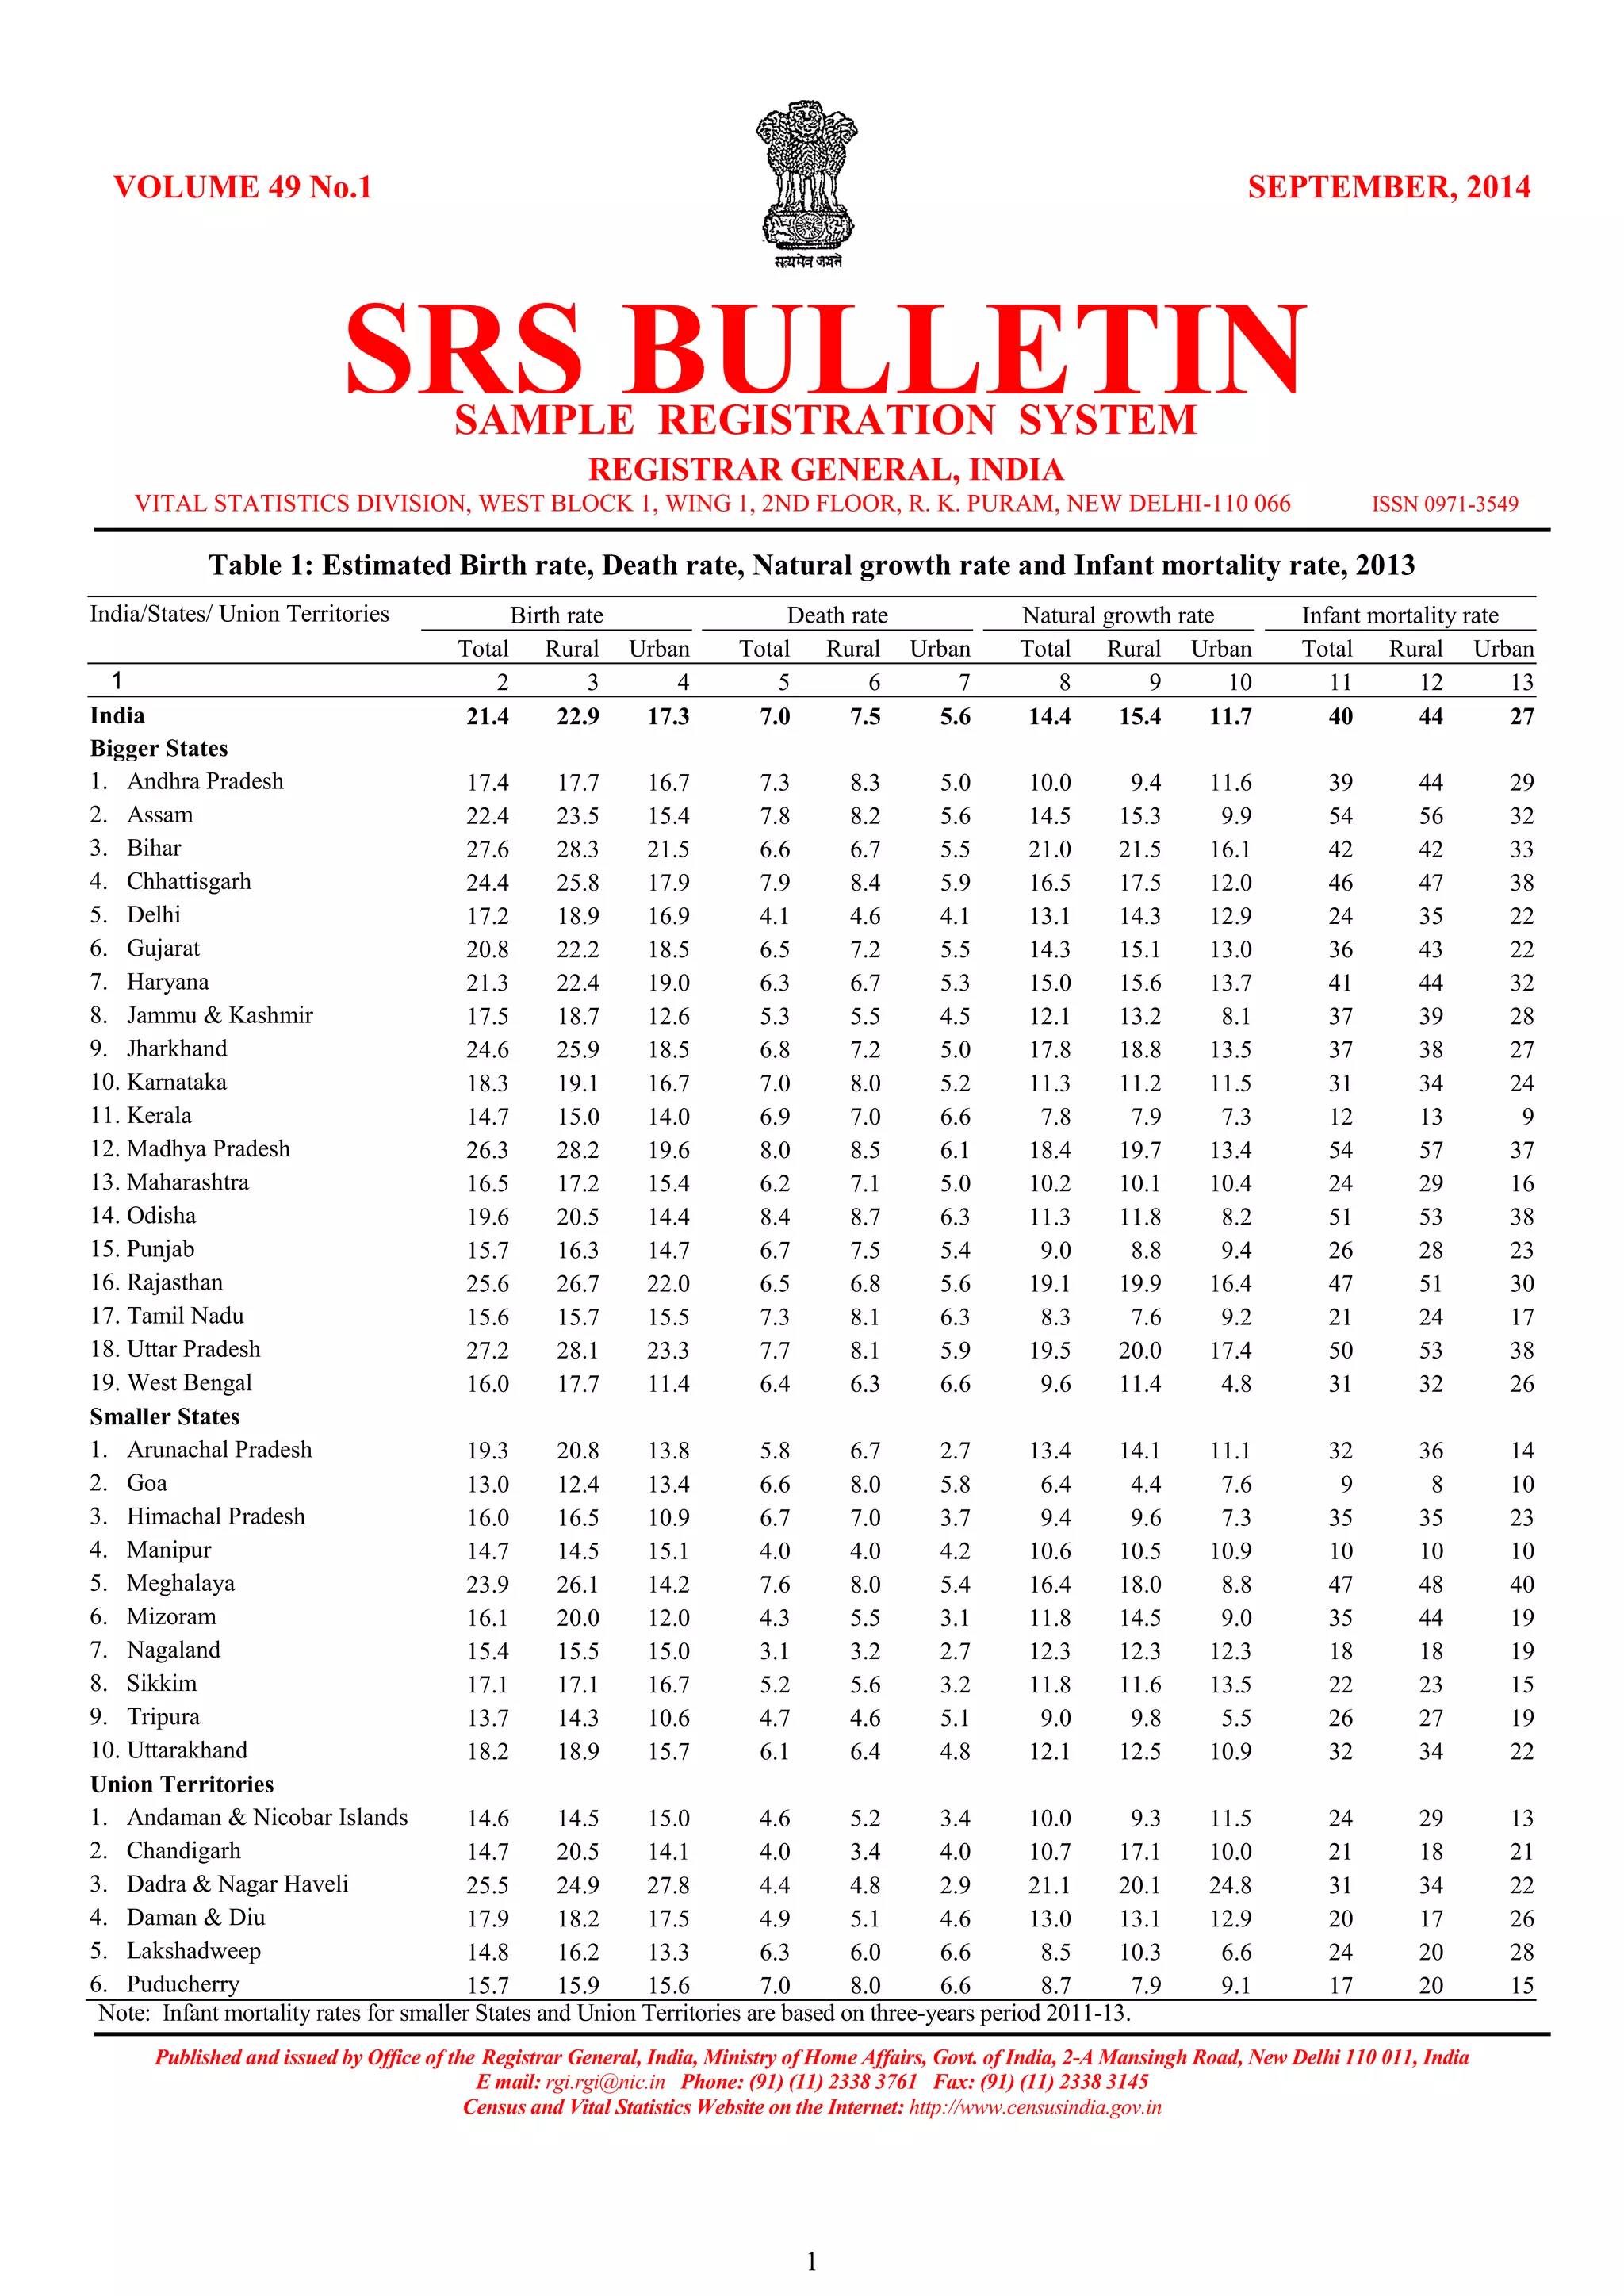

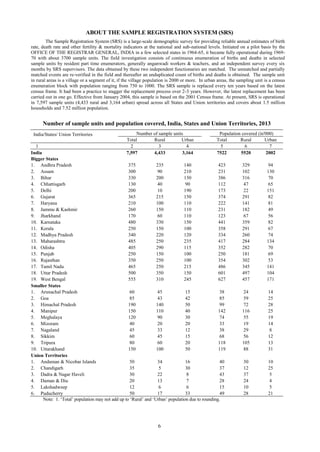

This document provides statistics on birth rates, death rates, natural growth rates, and infant mortality rates for India and its states/union territories for 2013. Some key findings include: - India's birth rate was 21.4, death rate was 7, and infant mortality rate was 40. - Bihar had the highest birth rate at 27.6 while Kerala had the lowest at 14.7. Madhya Pradesh had the highest death rate at 8 and Nagaland the lowest at 3.1. - Infant mortality rates ranged from 12 in Kerala to 54 in Madhya Pradesh.


