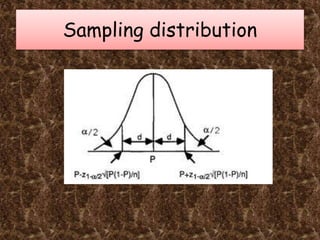
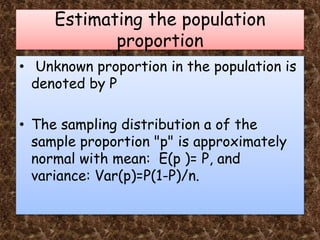
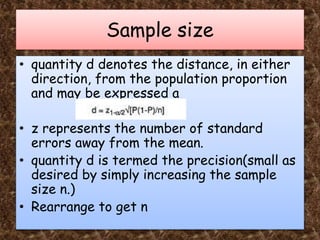
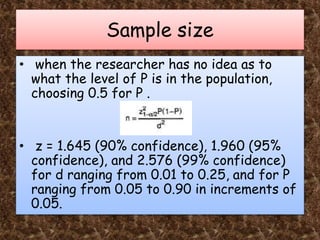
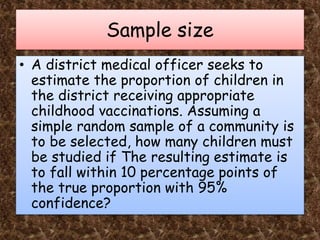
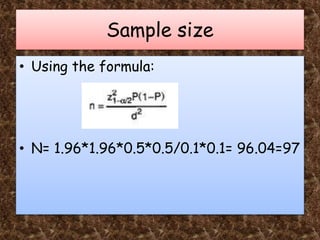
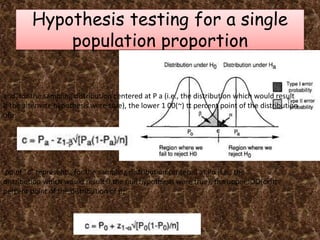
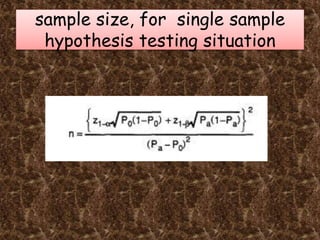
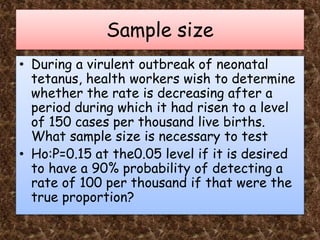
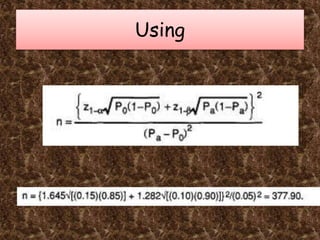
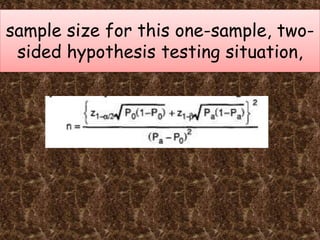
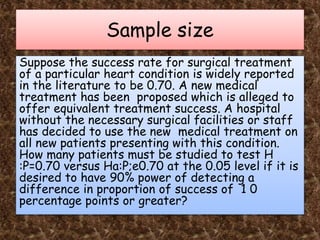
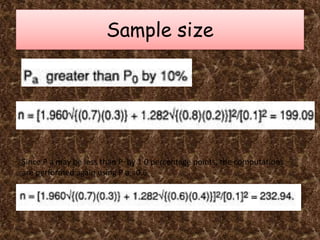
Sample size FOR ONE
SAMPLE
DR HAR ASHISH JINDAL
JR
PGIMS Rohtak
Sampling distribution
Estimating the population
proportion
• Unknown proportion in the population is
denoted by P
• The sampling distribution a of the
sample proportion "p" is approximately
normal with mean: E(p )= P, and
variance: Var(p)=P(1-P)/n.
Sample size
• quantity d denotes the distance, in either
direction, from the population proportion
and may be expressed a
• z represents the number of standard
errors away from the mean.
• quantity d is termed the precision(small as
desired by simply increasing the sample
size n.)
• Rearrange to get n
Sample size
• when the researcher has no idea as to
what the level of P is in the population,
choosing 0.5 for P .
• z = 1.645 (90% confidence), 1.960 (95%
confidence), and 2.576 (99% confidence)
for d ranging from 0.01 to 0.25, and for P
ranging from 0.05 to 0.90 in increments of
0.05.
Sample size
• A district medical officer seeks to
estimate the proportion of children in
the district receiving appropriate
childhood vaccinations. Assuming a
simple random sample of a community is
to be selected, how many children must
be studied if The resulting estimate is
to fall within 10 percentage points of
the true proportion with 95%
confidence?
Sample size
• Using the formula:
• N= 1.96*1.96*0.5*0.5/0.1*0.1= 96.04=97
Sample size
• It should be noted that 97 is the requirement if
simple random Sampling is to be used. This would
never be the case in an actual field survey.
• As a result, the sample size would go up by the
amount
• of the "design effect"!.
• For example, if cluster samplingc were to be used,
the design effect might be estimated as 2.
• This means that in order to obtain the same
precision, twice as many individuals must be studied
with cluster sampling as with the simple random
sampling strategy. Hence, 184 subjects would be
required.
Sample size
• example, to require the estimate of P to fall within
10% of P rather than to within 10 percentage points
of P.
• example,
• if the true proportion vaccinated was0.20, the
strategy used in the above example would result in
estimates falling between .10 and 0.30 in 95 out of
every 100 samples drawn from this population.
• Instead,if we require our estimate to fall within
10% of 0.20, we would fmd that 95 out of every
100 samples would result in estimates between
0.20+0.1(0.20) = 0.22 and 0.20-0.1(0.20) = 0.18.
Sample size for desired precision
e,= the desired precision,
Sample size
• Q determine the sample size necessary
to estimate the proportion vaccinated in
the population to within 10% of the true
value?
Hypothesis testing for a single
population proportion
point "c" represents, for the sampling distribution centered at Po (i.e., the
distribution which would result if the null hypothesis were true), the upper lOO(cx)tt
percent point of the distribution of p:
and, for the sampling distribution centered at P a (i.e., the distribution which would result
if the alternate hypothesis were true), the lower 1 00(~) tt percent point of the distribution
ofp:
sample size, for single sample
hypothesis testing situation
Sample size
• During a virulent outbreak of neonatal
tetanus, health workers wish to determine
whether the rate is decreasing after a
period during which it had risen to a level
of 150 cases per thousand live births.
What sample size is necessary to test
• Ho:P=0.15 at the0.05 level if it is desired
to have a 90% probability of detecting a
rate of 100 per thousand if that were the
true proportion?
Using
Sample size
• with Po=0.15, P a=0.1 0, a=0.05, and P
0=0.1 (since the desired power is 90%).
• as Pa gets further and further away
from P, the necessary sample size
decreases.
sample size for this one-sample, two-
sided hypothesis testing situation,
Sample size
• In determining sample size for this one-sample,
two-sided hypothesis testing situation, the
problem is that we cannot be sure whether P a
was larger than or smaller than P
• Hence, to determine adequate sample size, it is
necessary to compute n twice; once with P a
larger by a stated amount than P 0 and again
with P a less than P by that stated amount.
• The appropriate sample size is the larger of
these two numbers.
Sample size
Suppose the success rate for surgical treatment
of a particular heart condition is widely reported
in the literature to be 0.70. A new medical
treatment has been proposed which is alleged to
offer equivalent treatment success. A hospital
without the necessary surgical facilities or staff
has decided to use the new medical treatment on
all new patients presenting with this condition.
How many patients must be studied to test H
:P=0.70 versus Ha:P;e0.70 at the 0.05 level if it is
desired to have 90% power of detecting a
difference in proportion of success of 1 0
percentage points or greater?
Sample size
Since P a may be less than P by 1 0 percentage points, the computations
are performed again using P a =0.6
Thank You

Sample size

  • 1.
    Sample size FORONE SAMPLE DR HAR ASHISH JINDAL JR PGIMS Rohtak
  • 2.
  • 3.
    Estimating the population proportion •Unknown proportion in the population is denoted by P • The sampling distribution a of the sample proportion "p" is approximately normal with mean: E(p )= P, and variance: Var(p)=P(1-P)/n.
  • 4.
    Sample size • quantityd denotes the distance, in either direction, from the population proportion and may be expressed a • z represents the number of standard errors away from the mean. • quantity d is termed the precision(small as desired by simply increasing the sample size n.) • Rearrange to get n
  • 5.
    Sample size • whenthe researcher has no idea as to what the level of P is in the population, choosing 0.5 for P . • z = 1.645 (90% confidence), 1.960 (95% confidence), and 2.576 (99% confidence) for d ranging from 0.01 to 0.25, and for P ranging from 0.05 to 0.90 in increments of 0.05.
  • 6.
    Sample size • Adistrict medical officer seeks to estimate the proportion of children in the district receiving appropriate childhood vaccinations. Assuming a simple random sample of a community is to be selected, how many children must be studied if The resulting estimate is to fall within 10 percentage points of the true proportion with 95% confidence?
  • 7.
    Sample size • Usingthe formula: • N= 1.96*1.96*0.5*0.5/0.1*0.1= 96.04=97
  • 8.
    Sample size • Itshould be noted that 97 is the requirement if simple random Sampling is to be used. This would never be the case in an actual field survey. • As a result, the sample size would go up by the amount • of the "design effect"!. • For example, if cluster samplingc were to be used, the design effect might be estimated as 2. • This means that in order to obtain the same precision, twice as many individuals must be studied with cluster sampling as with the simple random sampling strategy. Hence, 184 subjects would be required.
  • 9.
    Sample size • example,to require the estimate of P to fall within 10% of P rather than to within 10 percentage points of P. • example, • if the true proportion vaccinated was0.20, the strategy used in the above example would result in estimates falling between .10 and 0.30 in 95 out of every 100 samples drawn from this population. • Instead,if we require our estimate to fall within 10% of 0.20, we would fmd that 95 out of every 100 samples would result in estimates between 0.20+0.1(0.20) = 0.22 and 0.20-0.1(0.20) = 0.18.
  • 10.
    Sample size fordesired precision e,= the desired precision,
  • 11.
    Sample size • Qdetermine the sample size necessary to estimate the proportion vaccinated in the population to within 10% of the true value?
  • 12.
    Hypothesis testing fora single population proportion point "c" represents, for the sampling distribution centered at Po (i.e., the distribution which would result if the null hypothesis were true), the upper lOO(cx)tt percent point of the distribution of p: and, for the sampling distribution centered at P a (i.e., the distribution which would result if the alternate hypothesis were true), the lower 1 00(~) tt percent point of the distribution ofp:
  • 13.
    sample size, forsingle sample hypothesis testing situation
  • 14.
    Sample size • Duringa virulent outbreak of neonatal tetanus, health workers wish to determine whether the rate is decreasing after a period during which it had risen to a level of 150 cases per thousand live births. What sample size is necessary to test • Ho:P=0.15 at the0.05 level if it is desired to have a 90% probability of detecting a rate of 100 per thousand if that were the true proportion?
  • 15.
  • 16.
    Sample size • withPo=0.15, P a=0.1 0, a=0.05, and P 0=0.1 (since the desired power is 90%). • as Pa gets further and further away from P, the necessary sample size decreases.
  • 17.
    sample size forthis one-sample, two- sided hypothesis testing situation,
  • 18.
    Sample size • Indetermining sample size for this one-sample, two-sided hypothesis testing situation, the problem is that we cannot be sure whether P a was larger than or smaller than P • Hence, to determine adequate sample size, it is necessary to compute n twice; once with P a larger by a stated amount than P 0 and again with P a less than P by that stated amount. • The appropriate sample size is the larger of these two numbers.
  • 19.
    Sample size Suppose thesuccess rate for surgical treatment of a particular heart condition is widely reported in the literature to be 0.70. A new medical treatment has been proposed which is alleged to offer equivalent treatment success. A hospital without the necessary surgical facilities or staff has decided to use the new medical treatment on all new patients presenting with this condition. How many patients must be studied to test H :P=0.70 versus Ha:P;e0.70 at the 0.05 level if it is desired to have 90% power of detecting a difference in proportion of success of 1 0 percentage points or greater?
  • 20.
    Sample size Since Pa may be less than P by 1 0 percentage points, the computations are performed again using P a =0.6
  • 21.